Visualizing Network Monitoring with Site24x7
Monitor your network devices and interfaces using intuitive maps, graphs, and dashboards in Site24x7. You can also visualize and record everything happening in your network all in one place—no more jumping between dashboards.
Layer 2 maps
Layer 2 maps discover and map all the devices in your network that are available within your configured IP range. Site24x7 automatically maps your whole network and structurally organizes all devices. Monitored and unmonitored devices are labeled with different colors, and icons denote device type. You can also hover over or click a device to view its connections and details (if it is a monitored device).
Layer 3 maps
When discovering your Layer 2 map using the Address Resolution Protocol (ARP), details about your Layer 3 switches and routers are automatically included in your Layer 2 maps. Creating a Layer 3 map allows network administrators to see details about subnets and data communication across the entire network.
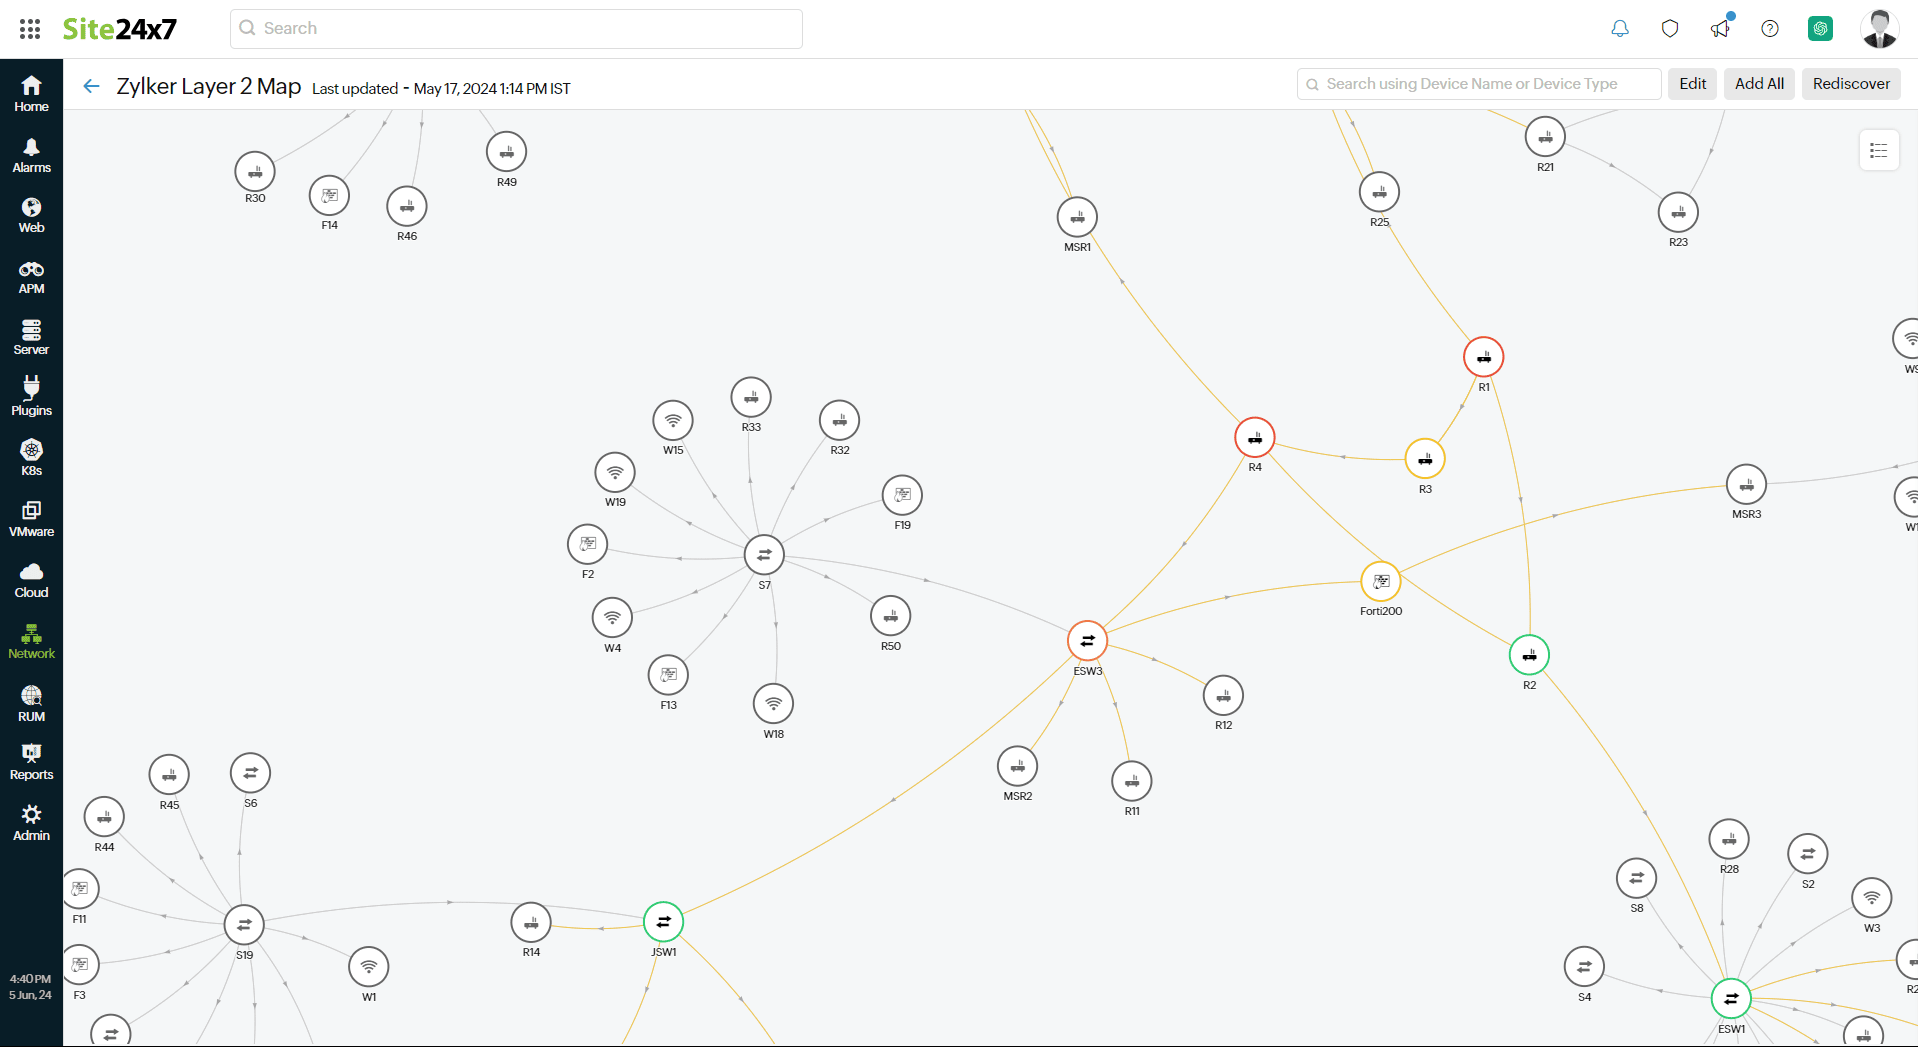
Figure 1. Layer 2/ Layer 3 map.
Topology maps
Topology maps offer an enhanced network mapping experience, allowing you to create a detailed view of how your devices and interfaces are interconnected. You can logically and hierarchically arrange your network devices and interfaces over a predefined or custom background to picture how your network works and what it looks like. Add monitor groups or custom nodes to visualize your network topology completely.
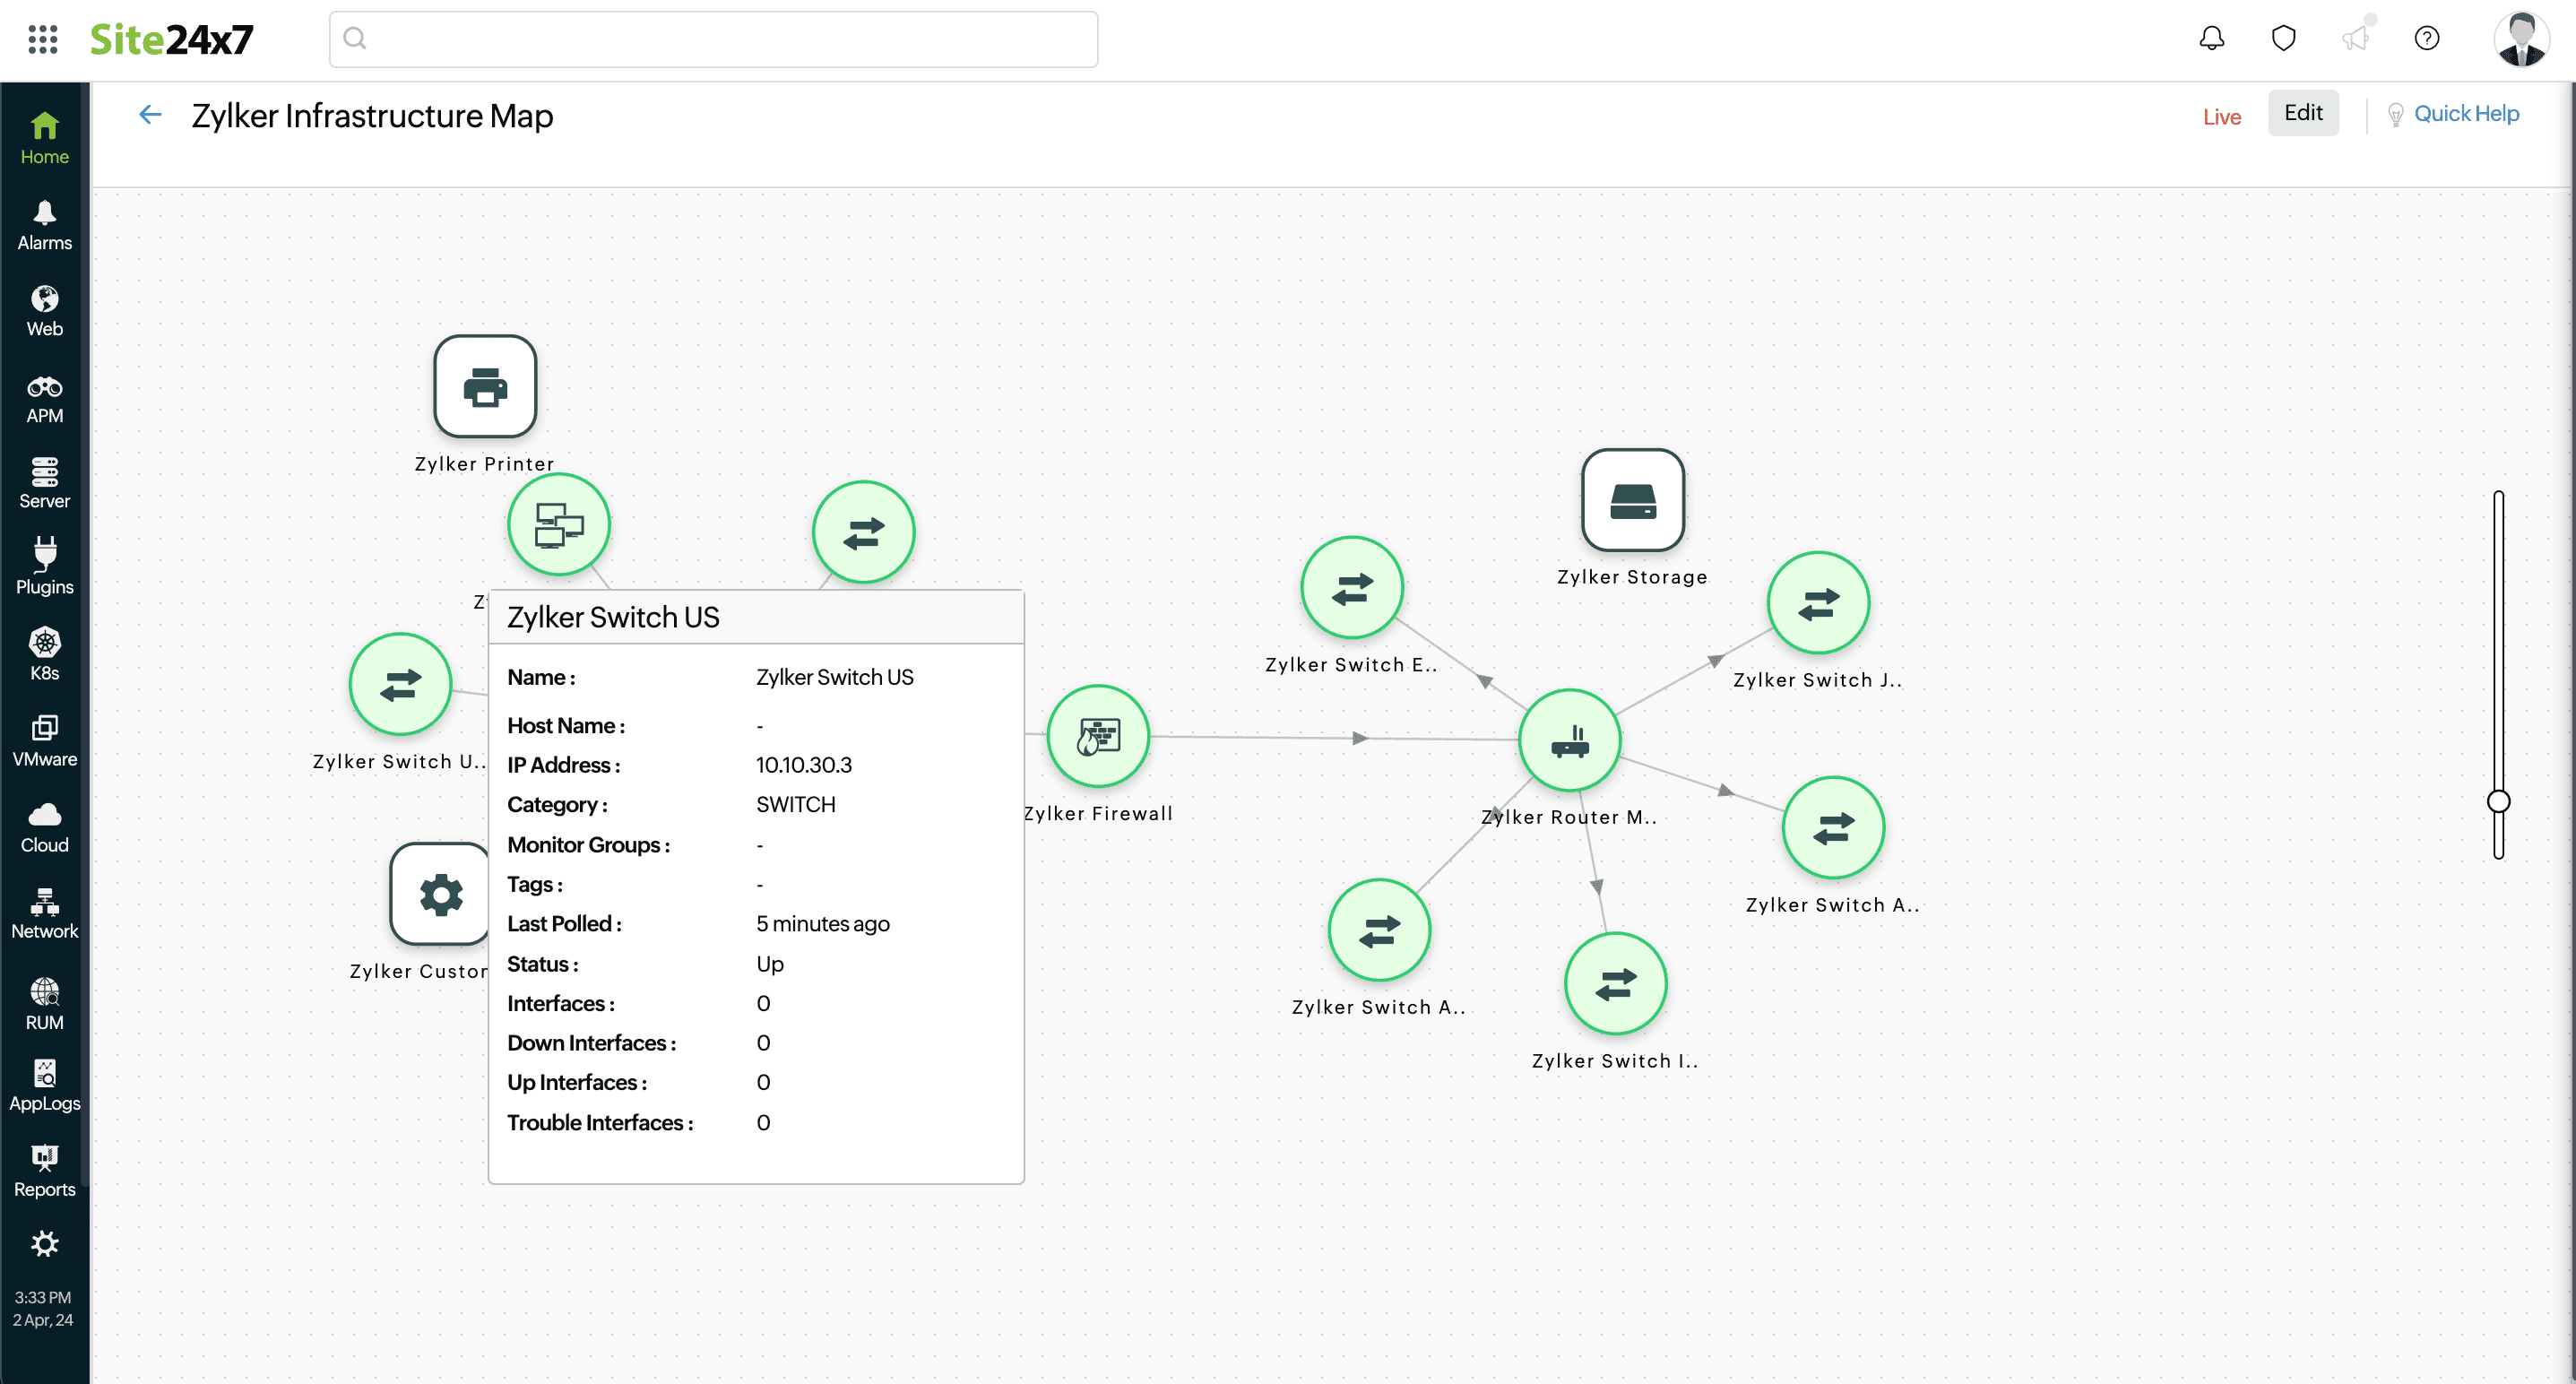
Figure 2. Network topology map.
NOC view
Site24x7 offers a network operations center (NOC) view for both network devices and network interfaces, with each entity displayed as a color-coded tile. Click the ![]() icon on the Network Devices or Network Interfaces page to navigate to the NOC view.
icon on the Network Devices or Network Interfaces page to navigate to the NOC view.
The NOC view for network devices displays statuses as follows: green for up, red for down, yellow for trouble, blue for configuration error, dark gray for discovery in progress, lilac for maintenance, and light gray for suspended. You can filter the view based on these statuses. Every tile displays the device name and the reason for the current status.
The NOC view for network interfaces displays statuses as follows: green for up, red for down, and yellow for trouble. You can filter the view based on these statuses, as well. Every tile displays the interface name, the corresponding device name in brackets, and the reason behind the current status.

Figure 3. NOC view.
Health Dashboard
The Health Dashboard offers information about the crucial nodes in your network, enabling you to better understand your network's performance. With this dashboard, you can view stats on the top performing devices and interfaces in your network based on several key metrics.
Generate graphs for the top network devices and analyze their performance based on response time and packet loss. You can also see the top 10 network interfaces under each of the following categories: out traffic, in traffic, transmitting bandwidth utilization, receiving bandwidth utilization, out errors, in errors, out discards, and in discards.

Figure 4. Health Dashboard.
-
On this page
- Layer 2 maps
- Layer 3 maps
- Topology maps
- NOC view
- Health Dashboard