Topology Maps
Create a schema of your network topology and track live statuses using Site24x7's Topology Maps feature. These are custom network maps you can use to logically and hierarchically arrange your network devices and interfaces over a predefined or custom background. This enables you to visualize how your network appears and how it operates. You can obtain a quick overview of your entire network from a single console, which will enable you to promptly take corrective measures when necessary.
Use cases
-
Impact analysis during incidents
When a device or link goes down, the topology map helps you:- Instantly identify affected downstream devices and services.
- Understand blast radius before taking corrective action.
- Prioritize remediation based on business-critical dependencies.
-
Faster root cause analysis
Instead of checking devices individually:- Trace issues upstream to identify the actual source of failure.
- Correlate alerts with dependency paths shown on the map.
- Reduce mean time to identify (MTTI) and resolve (MTTR) issues.
-
Network change validation
Before or after making changes:- Validate whether new devices are correctly placed in the network hierarchy.
- Confirm that dependency paths reflect the intended design.
- Detect unintended topology changes or missing links.
-
Onboarding and knowledge transfer
For new team members or cross-functional teams:- Quickly understand how the network is structured.
- Visualize core, edge, and access layers without reading detailed diagrams.
- Reduce dependency on static, outdated network documentation.
-
Capacity and design review
Use the topology map to:- Review network design and redundancy paths.
- Identify single points of failure.
- Support audits, design discussions, and optimization planning.
-
Device inventory validation
With the map inventory:- Ensure all critical devices are monitored and mapped.
- Identify orphaned devices not linked correctly.
- Cross-check monitored inventory against actual network layout.
Monitor groups in topology maps
A cluster of monitors can be organized into groups and displayed on a map, which enables you to track the devices based on specific categories according to your organizational policies. For example, if you have a group of monitors at a particular location and the status of the group indicates trouble, you can easily click the monitor group to view a list of devices in that group and identify which device in which location requires attention.
Custom nodes in topology maps
Custom nodes are specific components for network administrators to manage their organization's devices and connections. These nodes can be used according to the organization's needs, enabling admins to visualize the connections in a way that makes the most sense for their operations.
For example, to group monitors based on their location on a particular floor, you can create a custom node and give it a name. If you want to group the devices on the first floor, you can create a custom node named Floor 1 . Next, connect all the devices located on that floor to the custom node named Floor 1 . By doing so, you can efficiently organize and monitor the devices on each floor. You can use a custom node as you wish for better visualization.
The Topology Maps view
Here you can create and view network topology maps.
- Log in to your Site24x7 account.
- Navigate to Network > Topology/Layer 2 Maps.
You can also view maps that were created in the Infrastructure Maps tab (found at Home > Dashboards > Infrastructure Maps).
Creating topology maps
- Opening the map editor
- Navigate to Network > Topology/ Layer 2 Maps.
- Click Add Topology Map in the top-right of the screen to add a new map. This opens the Map Editor view.
- Setting a background image
- Click Map Settings in the top-right of the editor. Then, click Change Background.
- Select from the available backgrounds or upload any image that you want. For example, uploading your organization’s layout helps you pinpoint device locations easily.
- You can use the toggles in the Map Settings to Show Grid, Show Map Label, Show Link Label, and Show Arrows.

- Map Settings: The Map Settings button allows you to control the visual behavior and appearance of the topology map. Available options include:
- Show grid: Displays a background grid to help align nodes and maintain consistent spacing.
- Show map label: On enabling, displays location labels or country names. This option will be available only if a map is selected as the background image.
- Show link label: Toggles visibility of labels on links, such as interface names or relationship types.
- Show arrows: Displays directional arrows on links to indicate traffic flow or dependency direction.
- Change background: Lets you switch the map background for better contrast or presentation needs. You can select from existing options or upload a new one as needed.
- Adding nodes
- Site24x7 aggregates and shows all the configured network devices in your Site24x7 account in the left pane of the editor screen. You can use the tabs to search and add:
- Monitors: Individual network devices.
- Monitor Groups: Logical groups of related monitors.
- Custom Nodes: User-defined nodes for visual representation. Double-click a custom node to change its type.
Drag and drop them onto the map as required.

- Creating links
- When you hover over a node, a circular halo appears around it, and the pointer changes to a crosshair.
- Then, click anywhere on the halo and drag to start drawing a link. Release on the destination node to complete drawing a link between the nodes.
- In the pop-up that opens, select the required Interface, provide the Link Name, and select the Line Type (Continuous or Dotted ) and Line Style (Straight, Curved, or Sigmoid ) from the respective drop-down menus. If the link is between two devices, you can select the interface details for both directions in the same pop-up window, provided the interfaces for those devices are monitored in Site24x7.
NoteIf more than one link connects the same two nodes, the default link style is Curved.
- For curved links, you can adjust the curvature by dragging the handle on the link. For a sigmoid link, click the circular handle on the link to flip the curve flow orientation between vertical and horizontal.
- Double-click a link to edit its properties. You can draw multiple links between two nodes and select the appropriate interfaces for each to monitor the link availability.
- You can also use the Linktool
 to draw and adjust dependency or connectivity links between nodes. This option allows you to draw links in bulk and configure the details later.
NoteYou can link a custom node to a device that is monitored within Site24x7. However, interface details for the custom node will not be available.
- Replacing nodes: You can also easily replace a node. Right-click the node to be replaced and click Replace . In the pop-up window that opens, select the required device from the drop-down menu and click Save.
 Note
NoteOnly the devices that have not been mapped will be displayed in the drop-down menu.
- Adding visual elements: You can add elements like shapes and text to design, annotate, and fine-tune the map layout for better clarity and presentation. The inline editing tool allows you to draw shapes and add text wherever needed.
- Text
 :
:
- Select the Texttool, and then click anywhere on the map to add a text box.
- Enter the required text and click outside the box to save it. You can use text boxes to add labels, notes, or annotations for topology segments.
- Use the top toolbar to adjust the properties of the text to keep the layout clean and readable.
NotePress Esc on your keyboard to switch back to the Selection Tool at any time.
- Shapes
 :
:
- Select the Shapes tool, and click and drag on the map using the crosshair to draw a shape.
- Select the required shape (rectangle, circle, or ellipse), and customize its properties from the toolbar at the top.
- Available controls on the toolbar include:
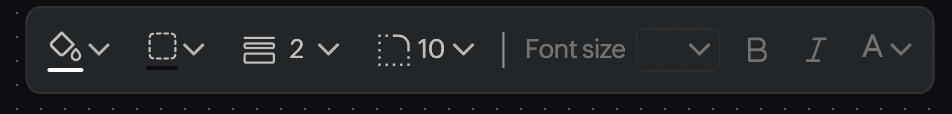
- Fill Color: Select from available colors or use the Color Picker to select any color.
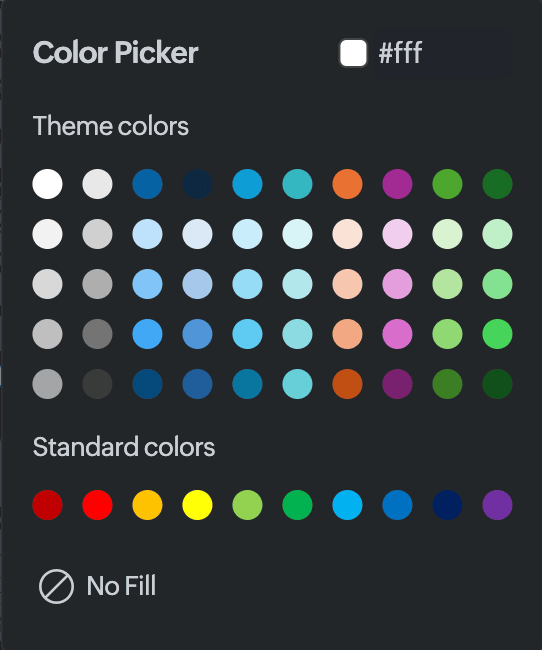
- Border Color: Select from available colors or use the Color Picker to select any color.
- Line Width: Select the required line width for the shape.
- Corner Rounding: Select the required number to round the corner of the shape. This option is not available for circles and ellipses.
- Font size: Select the size of the text.
- Bold: Apply bold formatting to the selected text.
- Italic: Apply italic formatting to the selected text.
- Font color: Change the color of the selected text. Use the Color Picker to select any color.
- Fill Color: Select from available colors or use the Color Picker to select any color.
- Text
- Selection and deletion:
- Select
 : Select and move nodes, links, or grouped elements. Alternatively, you can press and hold Ctrl while clicking to select the required elements.
 - Rectangular Selection
 : Use the tool to draw a rectangular selection box to select multiple nodes or shapes that fall within the box. Alternatively, hold the Shift button on your keyboard and click and drag to draw a rectangle for selection.
 - Use Ctrl + click to select or deselect additional nodes or links. You can select multiple nodes at once by holding control (Ctrl ) on your keyboard and clicking the required devices. Once selected, delete them by clicking the trash icon
 found in the top-right corner of the page.
 - Reposition nodes by clicking and dragging them on the map.
- Select
- Map controls
- Fit to View: Click to fit the map in the screen.
- Reset Zoom: Click to reset zoom and pan to the default map view.
- Zoom In: Increase the zoom level for a closer view.
- Zoom Out: Decrease the zoom level for a wider view.
- Once you've drawn your topology map, click Done. You can view the real-time status of devices and links, directly from the map, by hovering over or clicking a device or a link.
Monitoring using topology maps
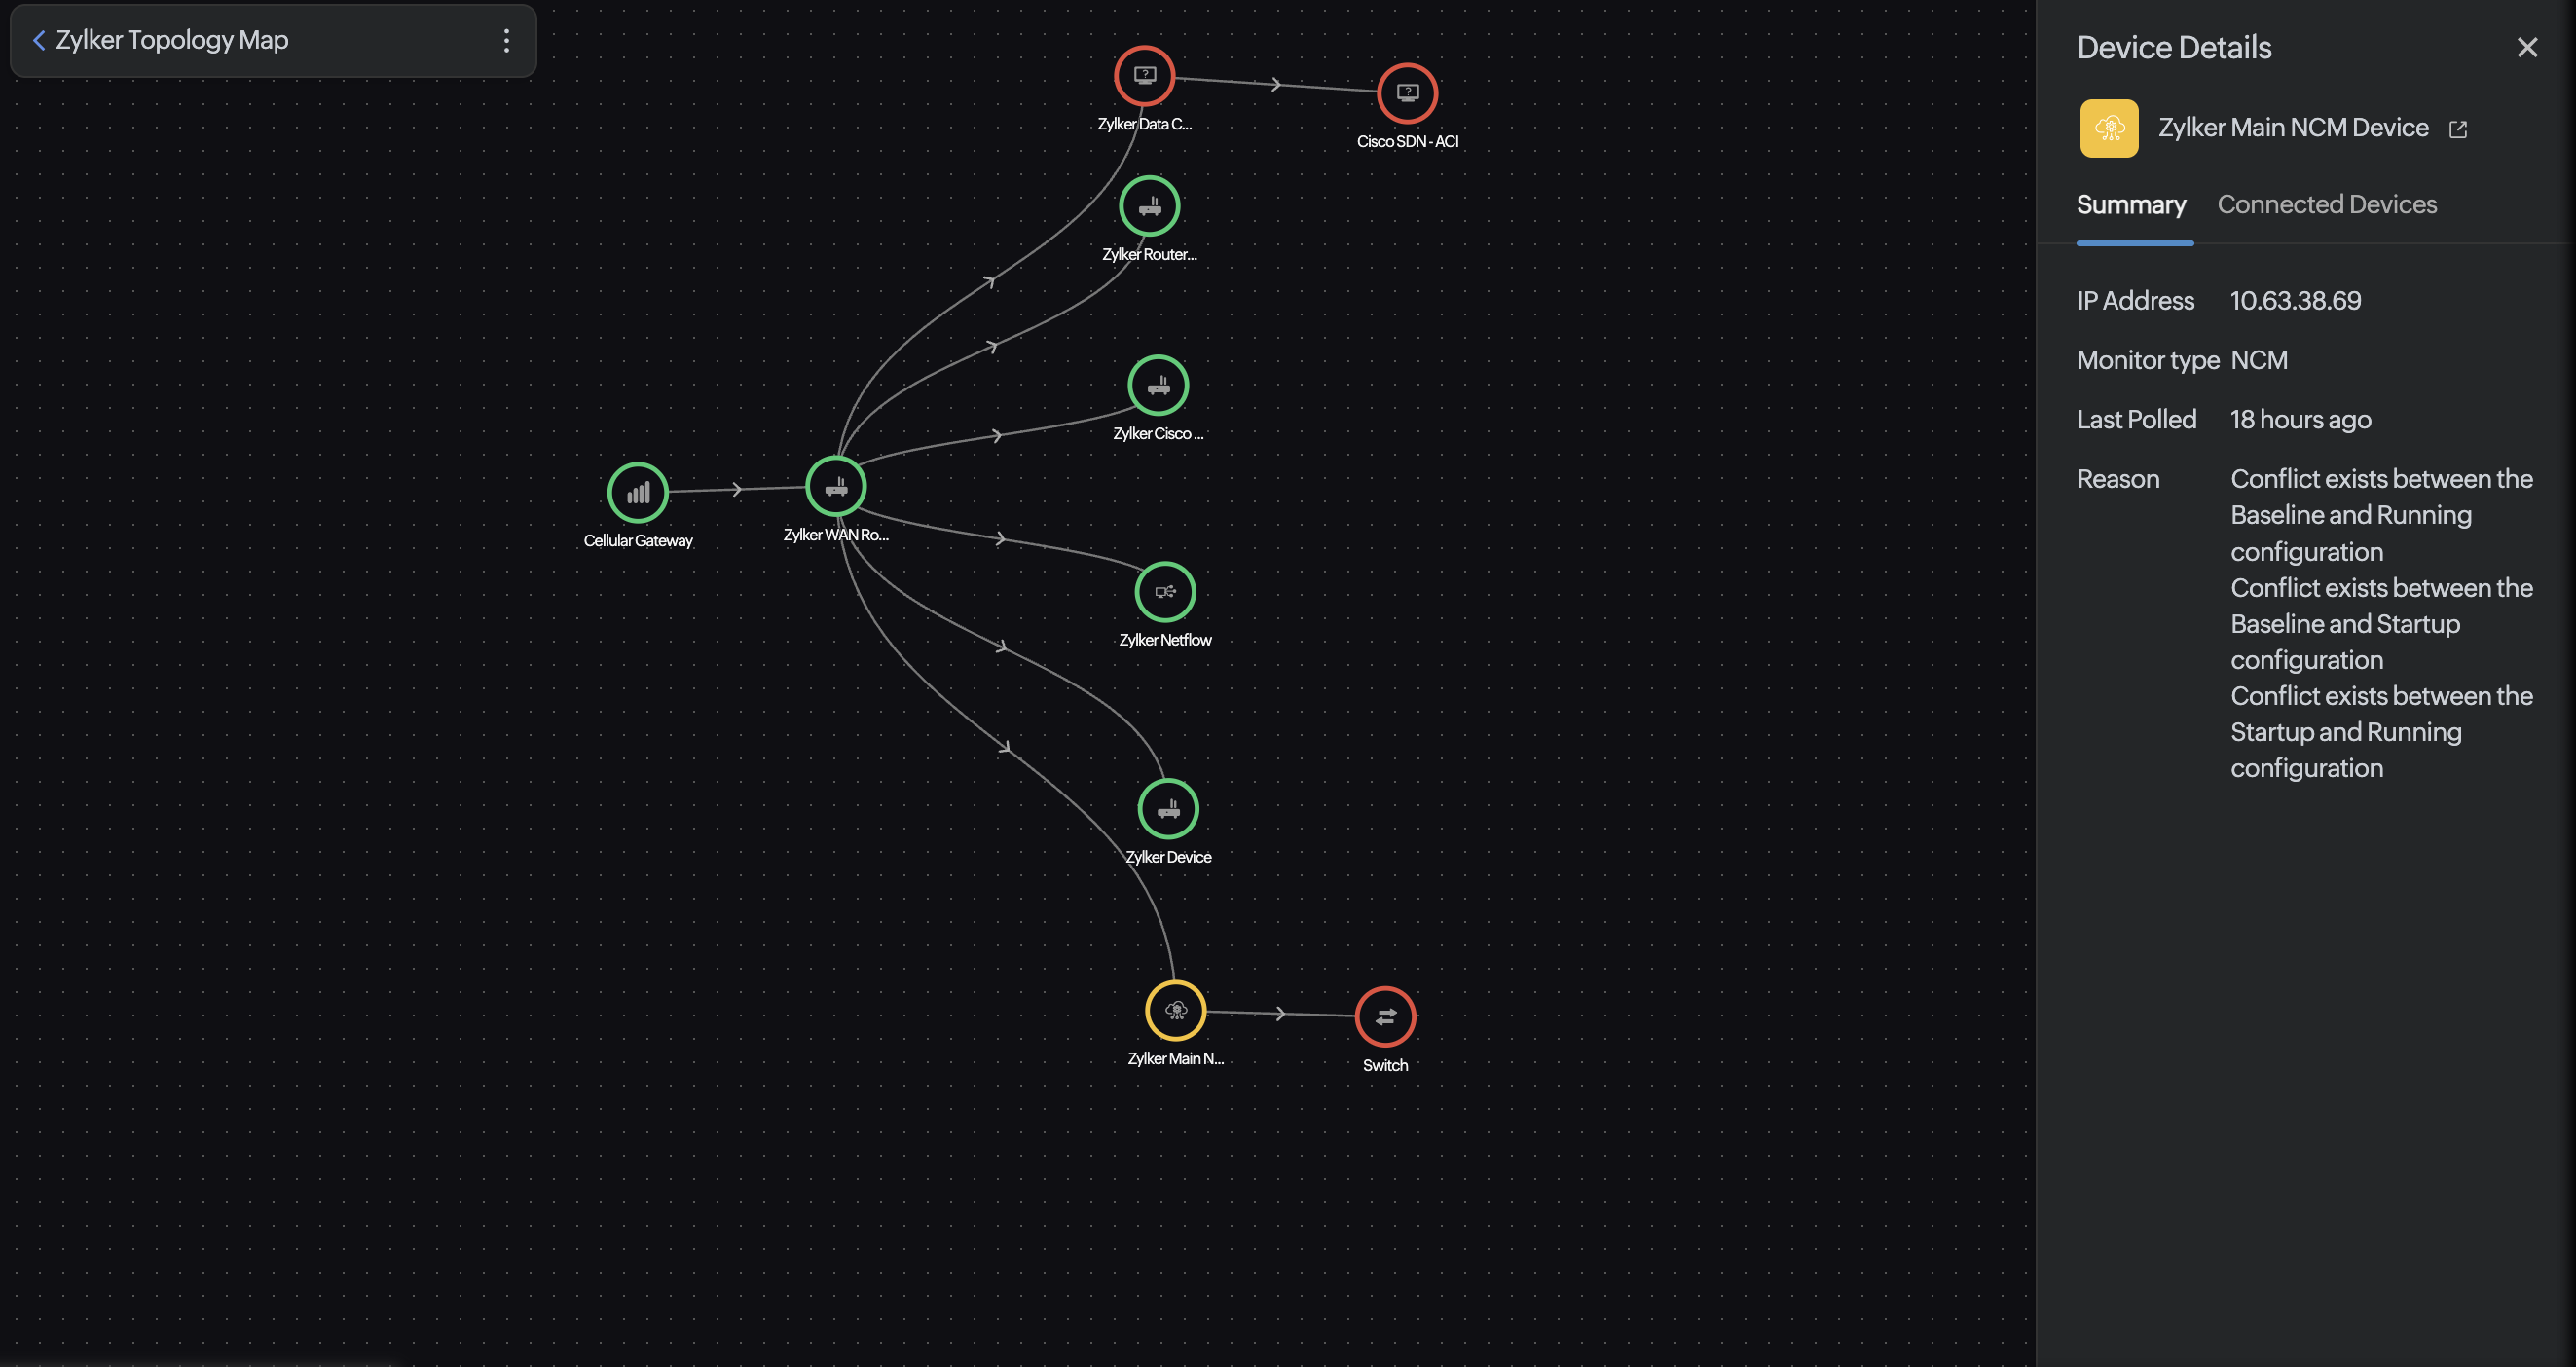
- Observe real-time updates using topology maps without the need to manually refresh the page. For instance, if a device or link status changes from Trouble to Critical, the color changes from yellow to orange in real time. The status of nodes and links are displayed as green, red, yellow, or orange, which denote that they're in an Up, Down, Trouble, or Critical state, respectively.
- Hovering over a node also highlights the link connections to and from the node for easier troubleshooting.
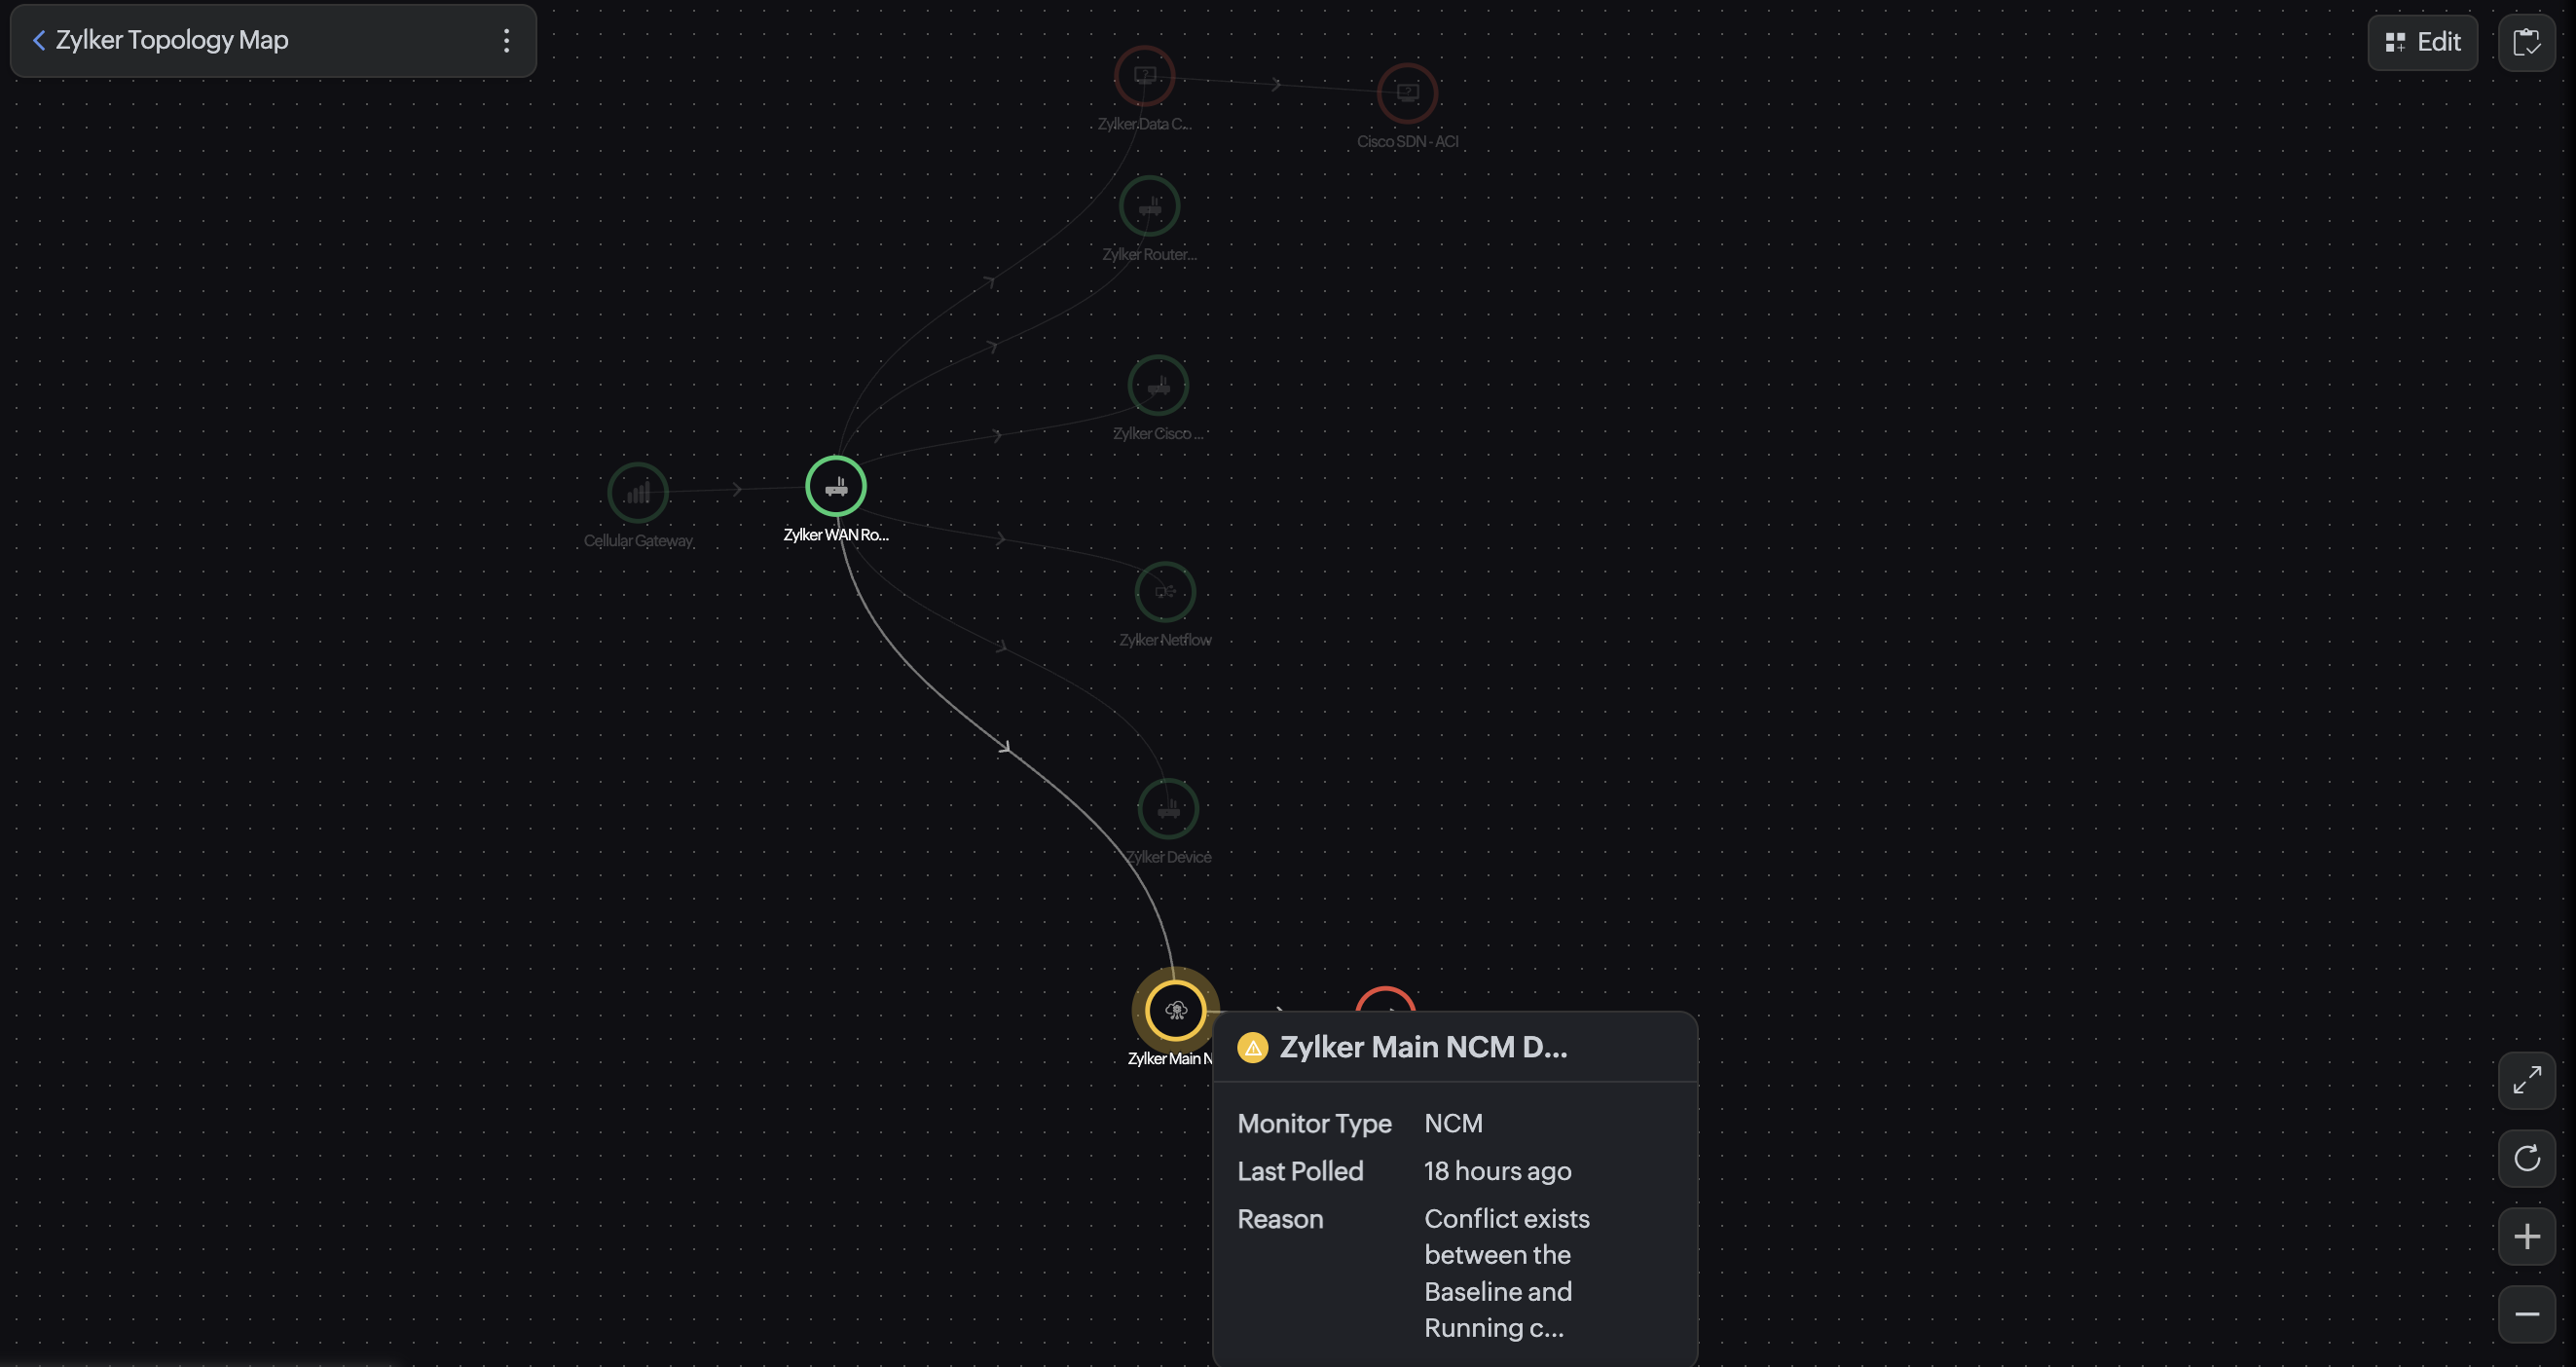
- Clicking a device shows the Device Details in the right pane. You can also view the connected devices. This will not be available for custom nodes.
- Click the Map Inventory icon
 in the top-right of the page to view all the devices added in the map.
 - Click a device in the Map Inventory to zoom to the respective node.
- Hover over a link to view details like the in speed and out speed of the interface. Only the connected devices are highlighted on hovering.
Editing topology maps
- From the list of topology maps, click the name of the map that needs to be edited.
- In the Map Editor view that opens, click the three dotted lines beside the name of the map and click Edit .
- Once you've finished applying edits, click Done.
NoteYou can edit or delete your maps from both the Topology Maps view and the Infrastructure Maps view.
Cloning topology maps
- Navigate to Network > Topology/Layer 2 Maps.
- Click on the plus icon
 beside a map to clone it. Clicking Yes will generate an identical copy of the map that can be modified as needed.
NoteYou can also automatically discover and map a complete network, with each interconnection clearly labeled within your configured IP range, using Layer 2 maps.