Network Interfaces
A network interface is the interconnection between a device and a network. Monitoring network interfaces provides real-time availability statistics and detailed analysis of data from switches, routers, firewalls, and other SNMP-enabled devices.
Where are network interfaces listed in Site24x7?
- Log in to your Site24x7 account.
- Navigate to Network > Interfaces.
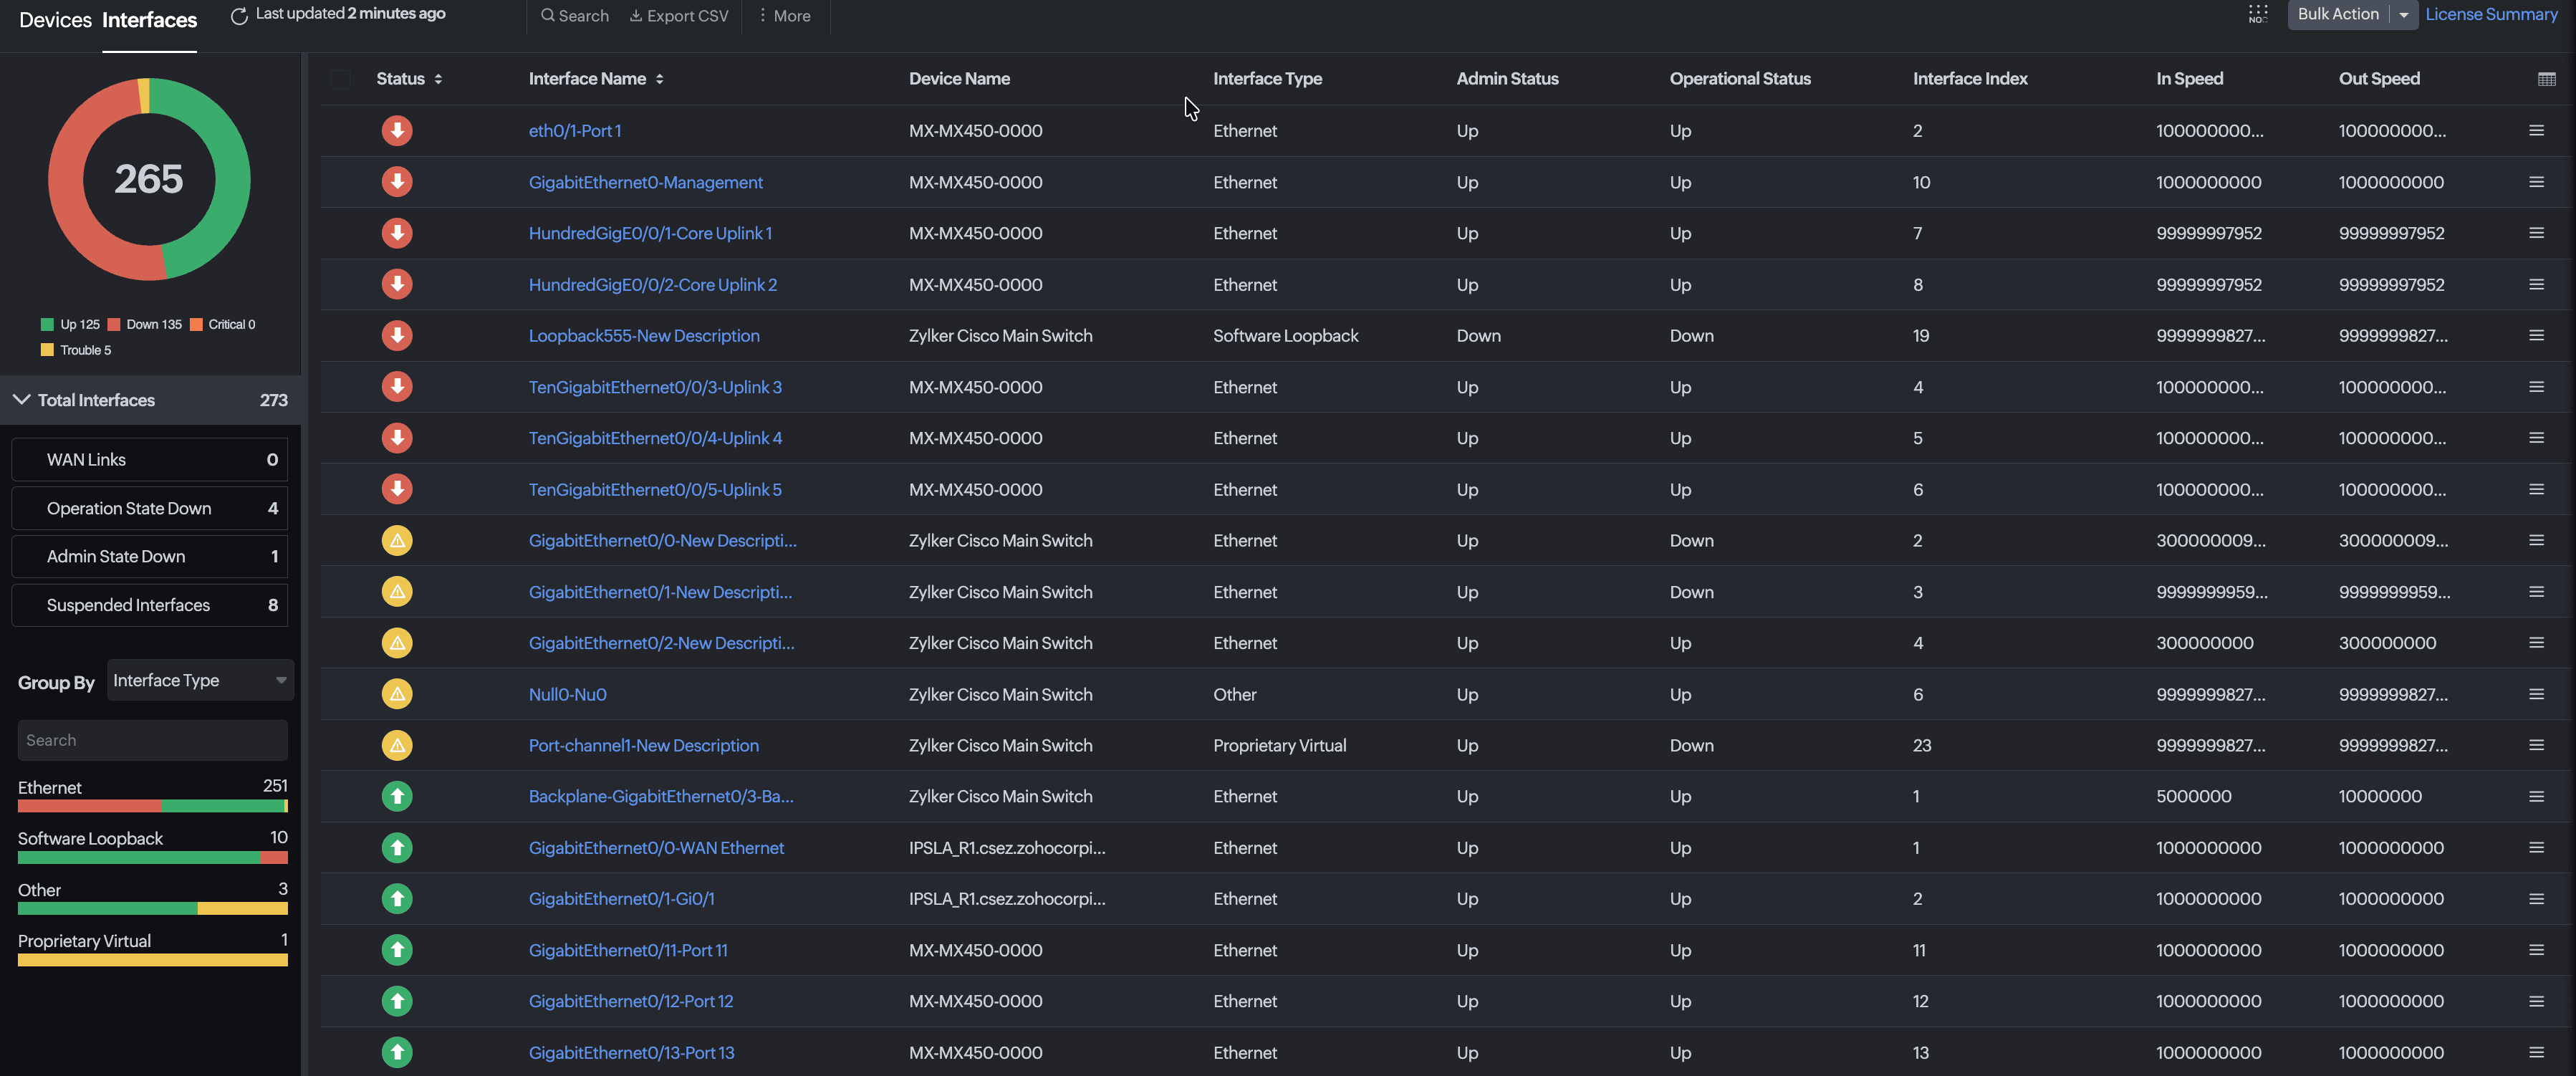
Figure 1. Viewing all network interfaces.
To view the network interfaces corresponding to a particular network device:
- Navigate to Network > Devices.
- Click the device and select the Interfaces tab (Fig. 2, marked as 1).
- Click the hamburger icon
 next to a network interface to suspend it, edit the display name, change the interface settings, and associate tags.
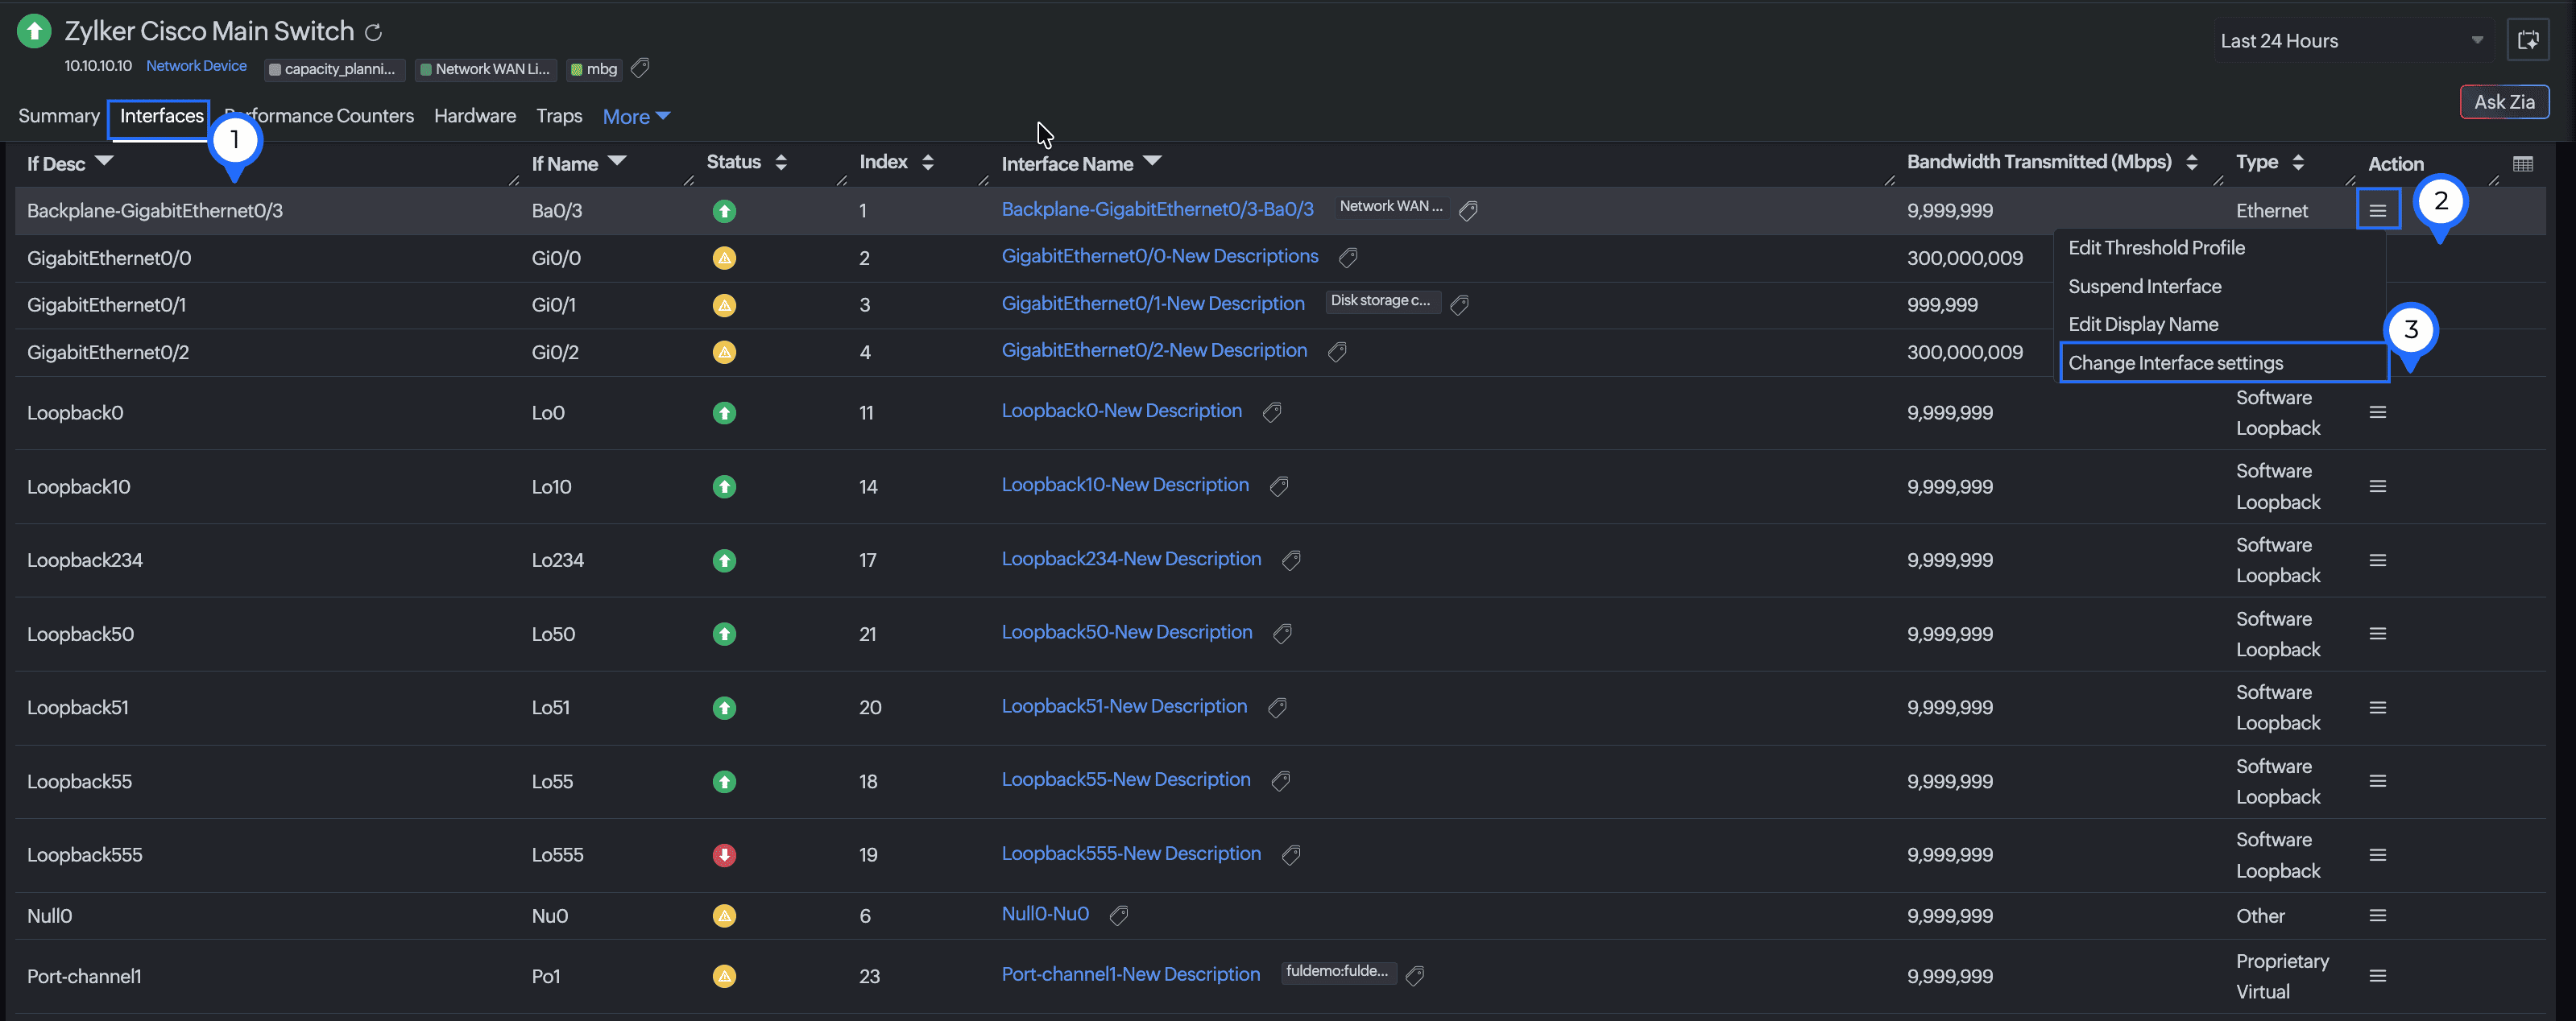
Figure 2. Viewing network interfaces in a device.
How can the Network Interfaces page help me?
This page lists the state of interfaces as Down, Up, or Trouble based on the most recent poll. Network interfaces that have their admin and operation states as Down are also listed.
Operation state: The current running state.
Admin state: The configured state of an interface.
How do I change the interface settings?
Updating the bandwidth configuration helps in calculating accurate values for Rx and Tx Utilized (%). The bandwidth configuration can be updated for an individual interface or in bulk either from a network device or via the Network Interfaces tab found in the left pane. In a network device, you can select Change Interface Settings by clicking the hamburger icon ![]() in the Action column beside an interface (Fig. 2, marked as 3). This action can also be performed in the Network Interfaces tab.
in the Action column beside an interface (Fig. 2, marked as 3). This action can also be performed in the Network Interfaces tab.
How are network interfaces organized?
Tags are unique labels that allow you to assign custom metadata to your monitors for better classification and organization. You can also assign unique colors to each tag to easily identify and sort them.
Network interfaces are enabled to support tags, which can be viewed by clicking the interface tab inside the network device's dashboard. You can associate predefined tags or create new ones; aside from that, you can also filter your network interfaces based on these tags in the Network Interfaces view.
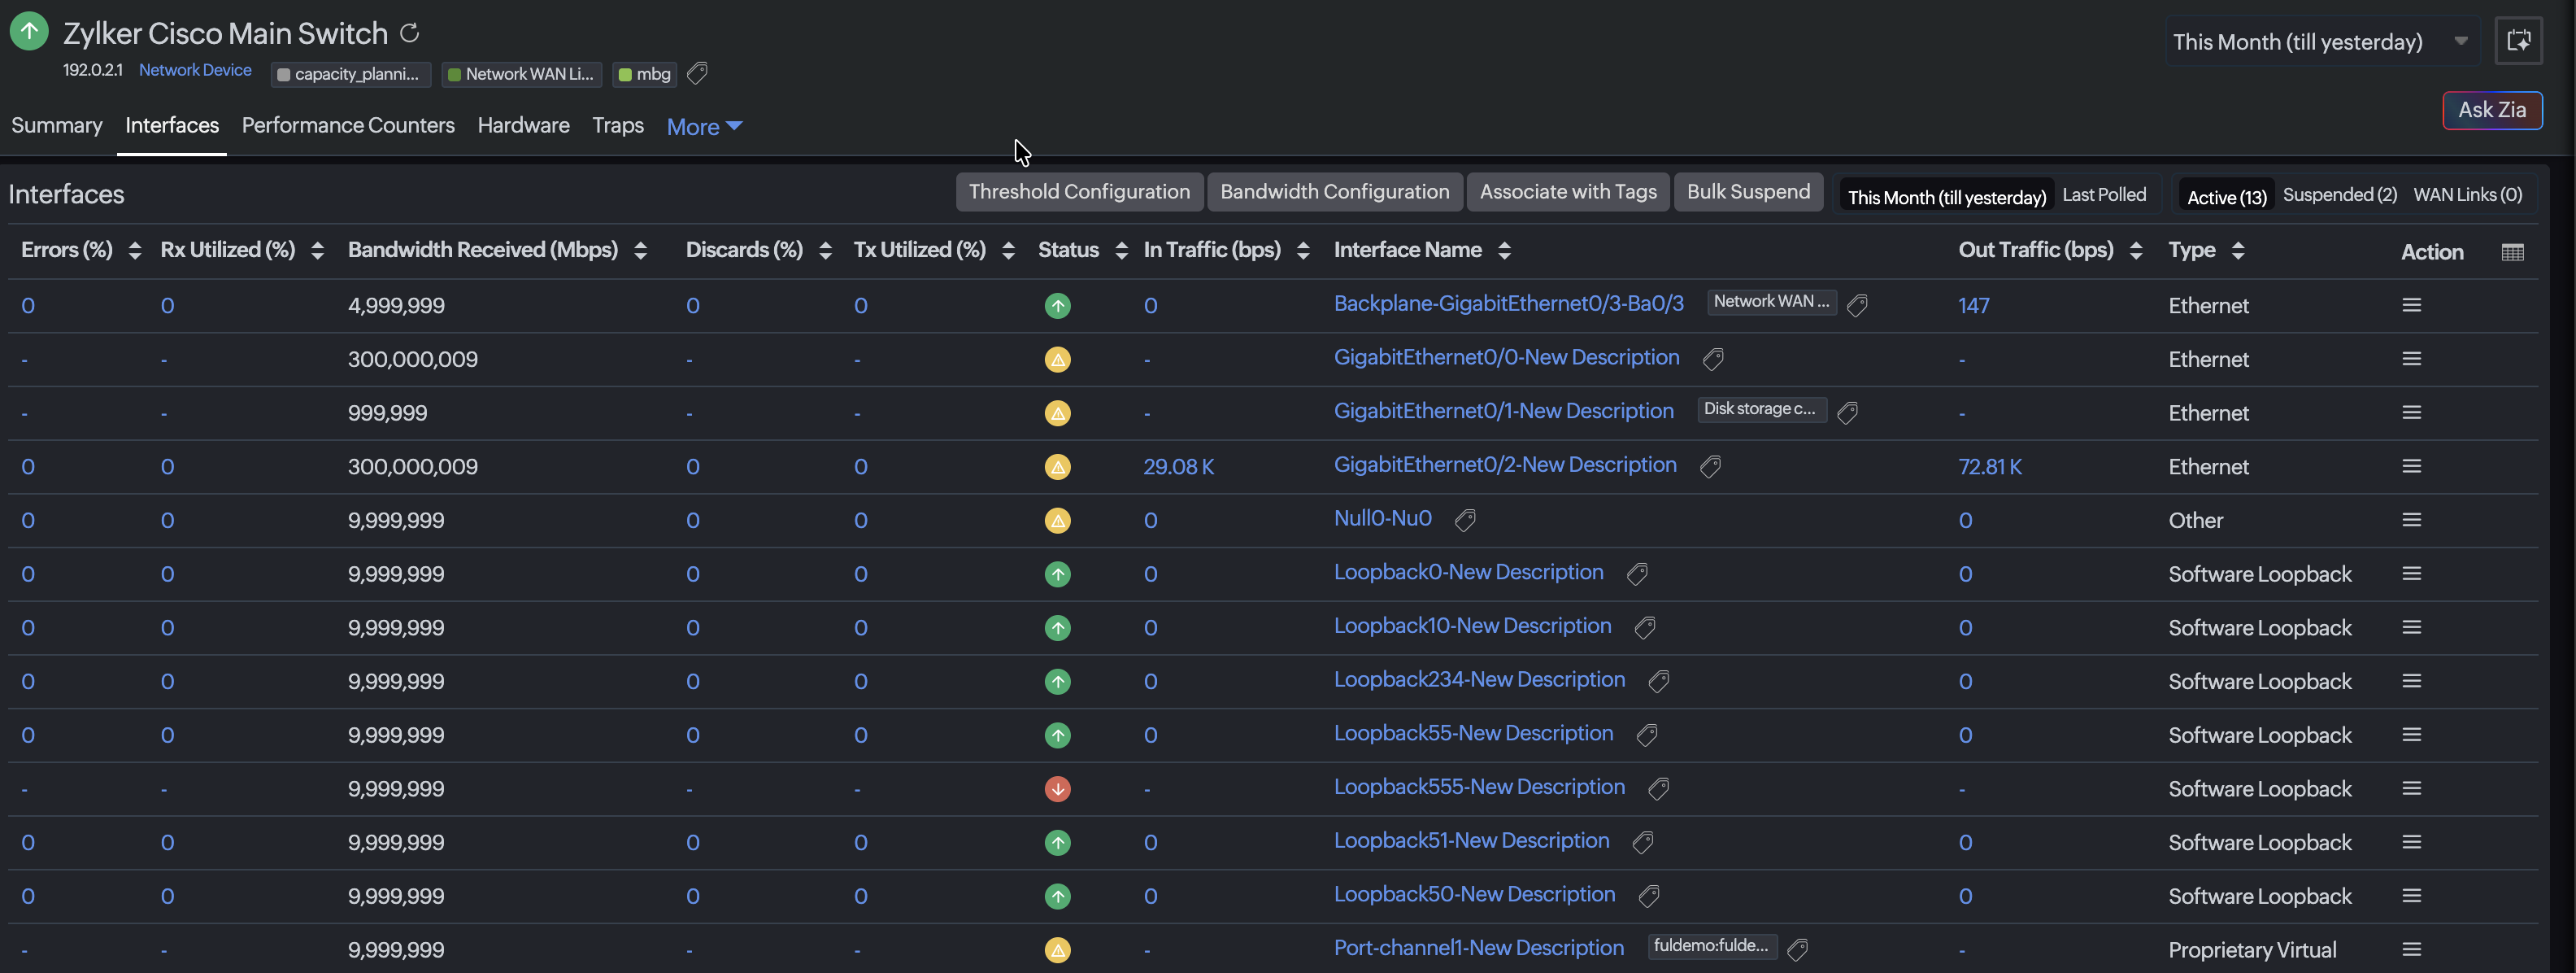
Figure 3. Adding tags.
What is the NOC view?
The NOC view for network interfaces displays all the network interfaces as color-coded tiles. Click the NOC view icon ![]() near Quick Help on the Network Interfacespage for the NOC view. Statuses are displayed as green for Up, red for Down, and yellow for Trouble, and you can filter the view based on these statuses. Every tile displays the interface name, the corresponding device name in brackets, and the reason behind the status.
near Quick Help on the Network Interfacespage for the NOC view. Statuses are displayed as green for Up, red for Down, and yellow for Trouble, and you can filter the view based on these statuses. Every tile displays the interface name, the corresponding device name in brackets, and the reason behind the status.
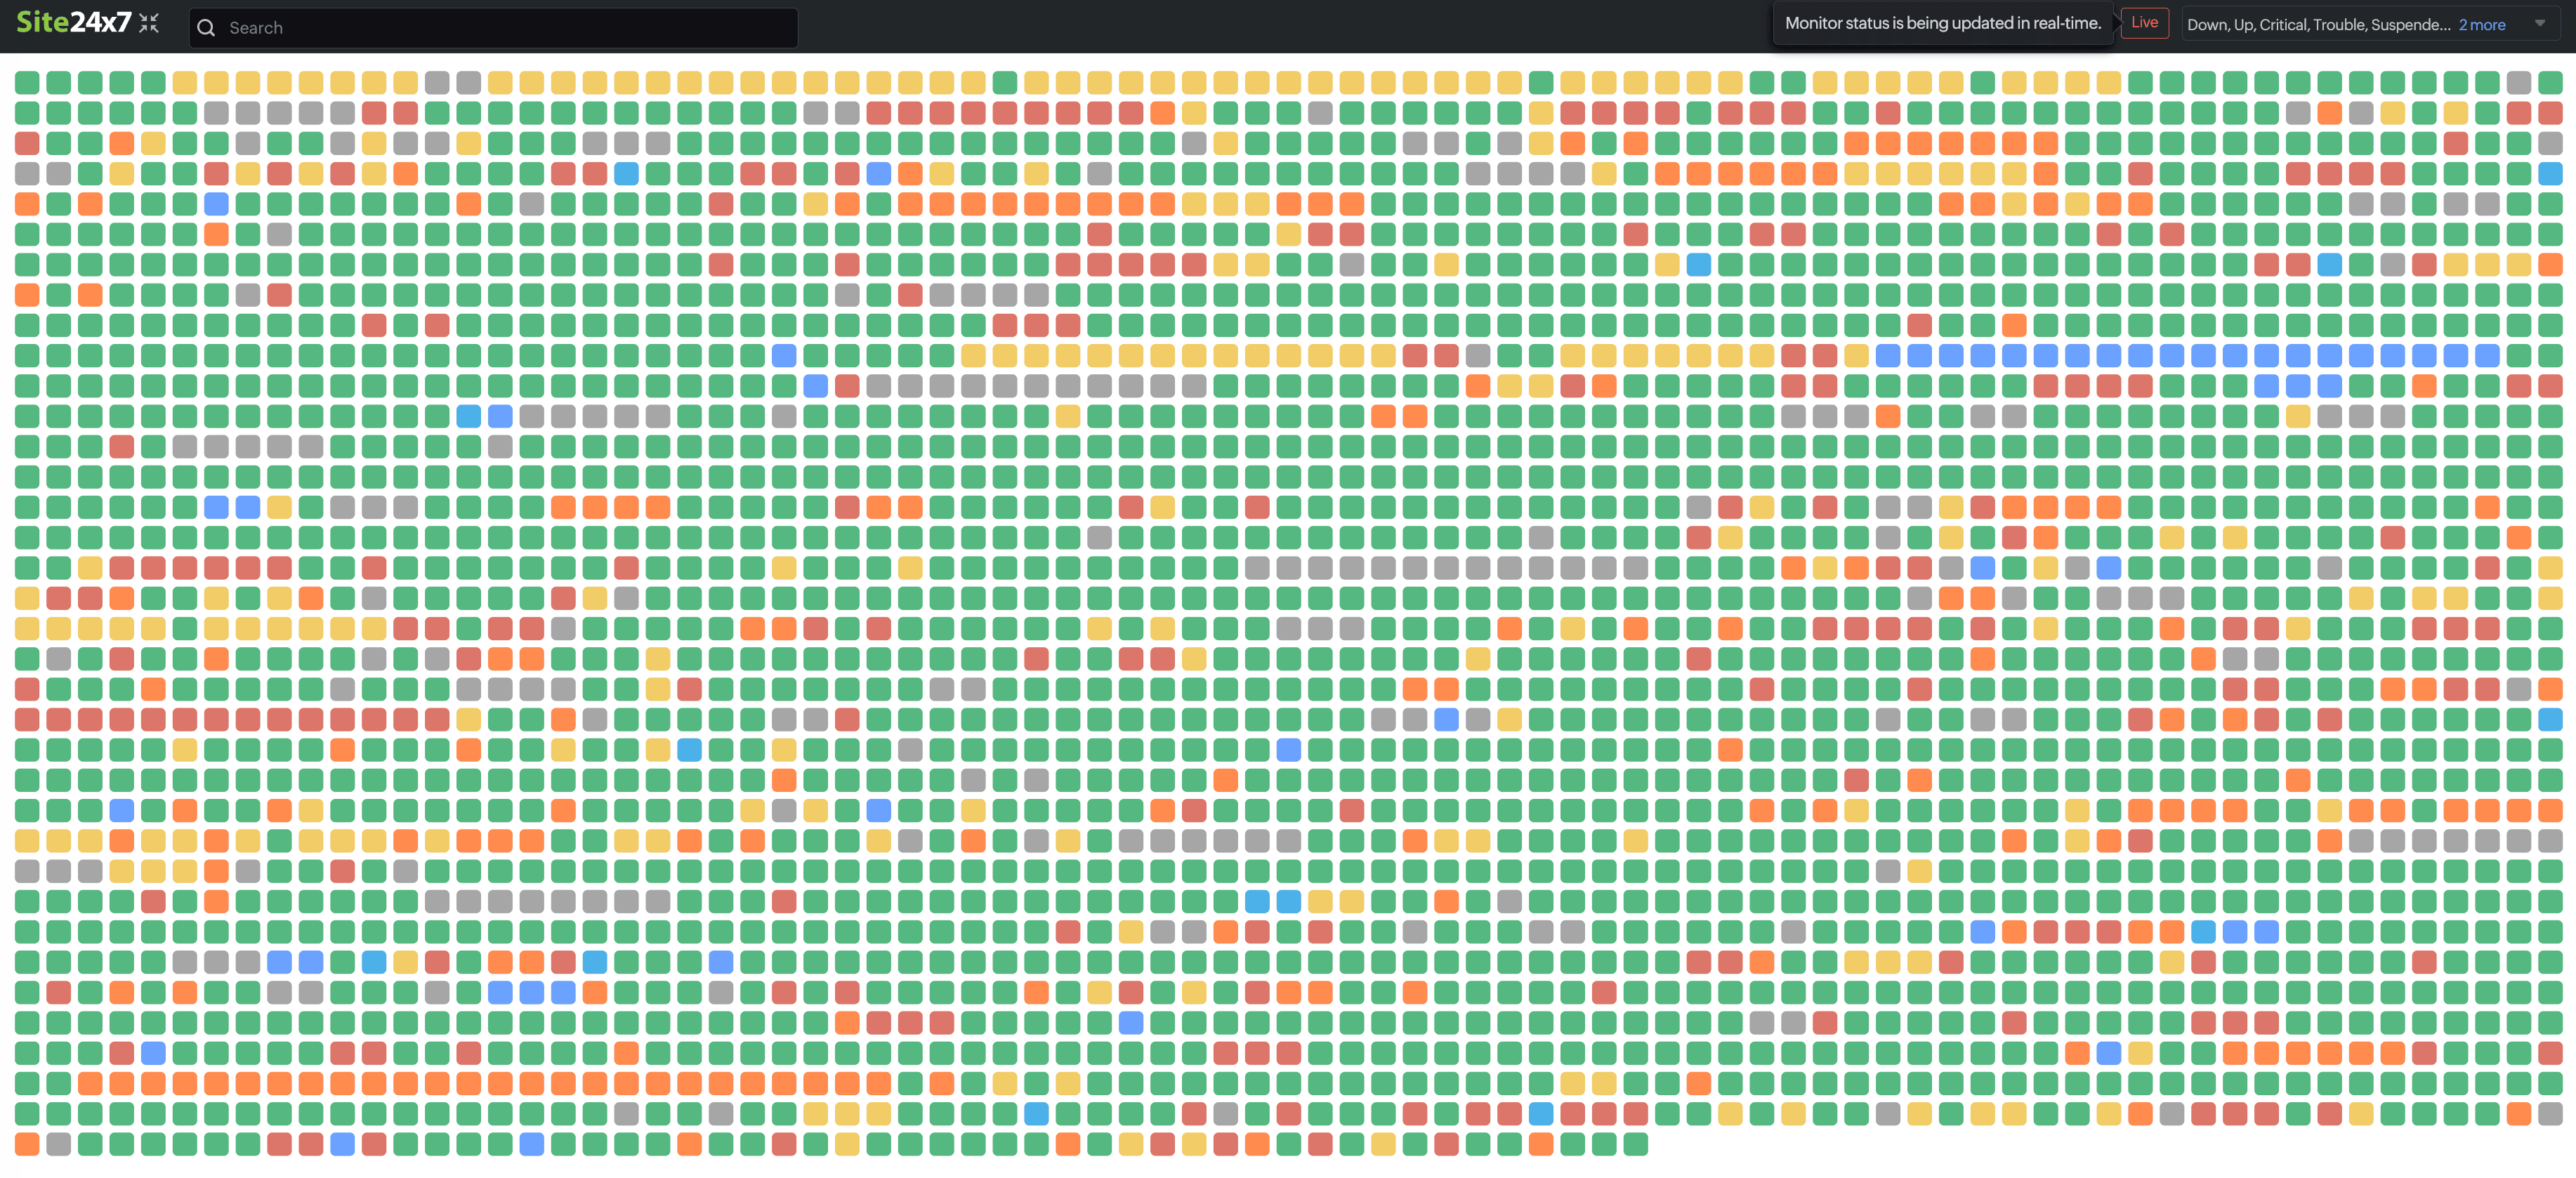
Figure 4. NOC View.
How can I configure thresholds?
You can configure thresholds for your network interfaces so that you receive alerts when any anomalies are detected. You can set thresholds for attributes like in and out traffic, Rx and Tx utilization, errors, and discards.
Interface availability alerts are generated based on the configured Administrative (Admin) State and Operational State of the interface:
-
Only Admin State is Down: An Admin State Down alert is generated at the device level.
-
Only Operational State is Down: An Operational State Down alert is generated only when the Admin State is Up, and the Operational State is Down.
-
Both Admin State and Operational State are Down: Only the Admin State Down alert is generated (if configured). A separate Operational State Down alert is not triggered because the interface is administratively disabled.
How do I activate or suspend interfaces in bulk?
You can activate or suspend interfaces in bulk from the Settings tab.
- Navigate to Network > Settings > Bulk Activate/Suspend Interfaces. In the Bulk Actions section, click Activate Interfaces or Suspend Interfaces.
- Select the required action, Activate or Suspend, from the drop-down menu.
- You can set multiple conditions. Select the required condition operators: AND or OR.
- Interfaces can be chosen in bulk based on their Device, Operational State, Status, Type, Name, etc.
- Alternatively, you can navigate to Network. Then select a device and go to Interfaces tab. Here, you can click Bulk Activate or Bulk Suspend according to the available options.
- Click Activate or Suspend.
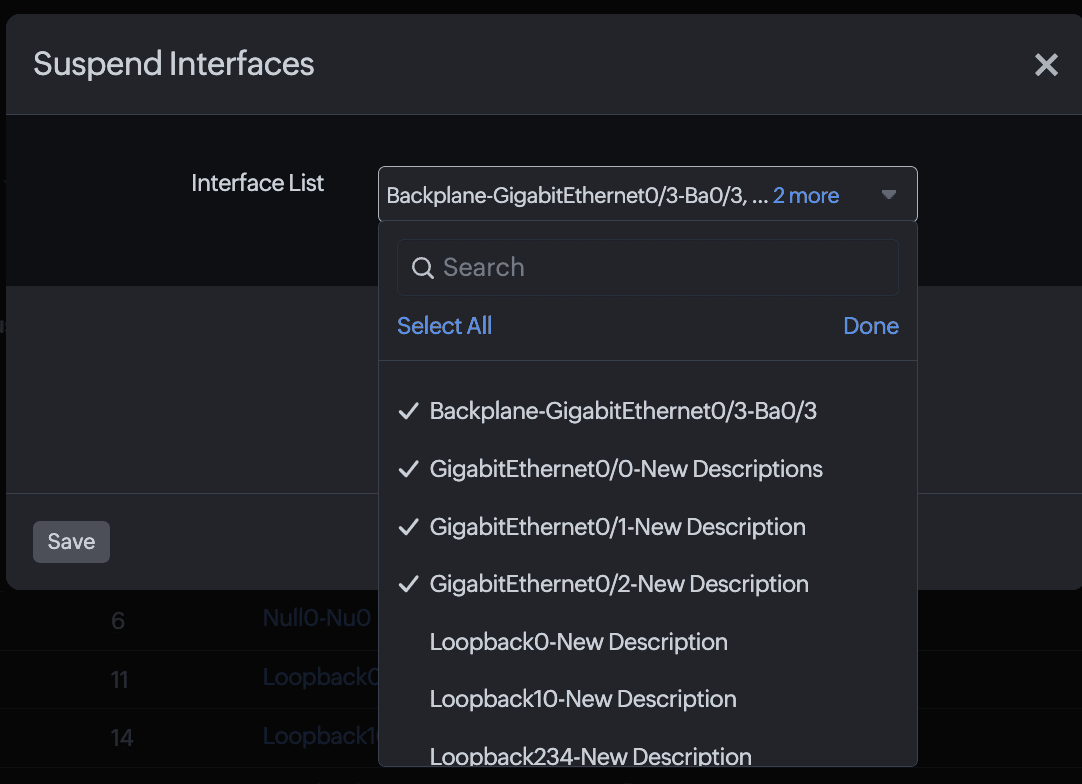
Figure 5. Bulk Activate/Suspend interfaces.
How do I identify the top performing network interfaces?
Keep yourself updated about your network's health using the Network Health Dashboard. This dashboard displays the top 10 network interfaces under each of the following categories: Out Traffic, In Traffic, Tx Utilized (transmitting bandwidth utilization), Rx Utilized (receiving bandwidth utilization), Out Errors, In Errors, Out Discards, and In Discards.
-
On this page
- Where are network interfaces listed in Site24x7?
- How can the Network Interfaces page help me?
- How do I change the interface settings?
- How are network interfaces organized?
- What is the NOC view?
- How can I configure thresholds?
- How do I activate or suspend interfaces in bulk?
- How do I identify the top performing network interfaces?