
IBM i application server monitoring
IBM i Monitor enables end-to-end performance monitoring of IBM i (formerly AS/400 or iSeries) servers. It collects system-wide health metrics, including CPU utilization, memory pools, disk/ASP usage, jobs, subsystems, queues, printers, spool files, and system problems—all from a single unified view.
Prerequisites
Before adding an IBM i monitor, ensure the following:
- An On-Premise Poller must be installed in a network that has direct connectivity to the IBM i server.
The poller uses the JT400 (JTOpen) library to communicate with IBM i host server services—no SSH or SNMP is required.
- IBM i host servers must be running. If they are not started, the monitor will fail with a connection error.
To start all host servers on the IBM i, run:
STRHOSTSVR SERVER(*ALL)
Supported IBM i OS versions
The IBM i monitor uses JDBC (via JT400) to collect metrics. The minimum supported JDBC driver version is 7.3.
| IBM i OS version | Monitoring support |
|---|---|
| IBM i 7.3 and above | Full monitoring—all metrics, subsystems, queues, jobs, disk, pools, printers, problems, and message queues are supported. |
| Below IBM i 7.3 | Limited monitoring—some QSYS2 catalog views (for example, ACTIVE_JOB_INFO, SUBSYSTEM_POOL_INFO) used for job and subsystem metrics may not be available. Only base system status metrics (CPU, ASP, jobs, users, pools) will be collected. |
IBM i user profile
A valid IBM i user profile is required to authenticate the monitor. The following are recommended minimum requirements:
- The profile must be active (not *DISABLED) and the password must not be expired.
- Read access to QSYS2 catalog views is required for job and subsystem metric collection.
- *JOBCTL special authority is recommended for full job monitoring.
- The profile must have read access to the configured message queue (default: /QSYS.LIB/QSYSOPR.MSGQ).
Site24x7 tracks Password Days to Expire as a metric and will alert when the monitoring user profile’s password is about to expire (default: Warning at 14 days, Critical at 7 days).
SSL/TLS
SSL is optional. When enabled, the poller connects to the IBM i host servers over an encrypted channel. Ensure the IBM i SIGNON service is configured with a valid digital certificate before enabling SSL in the monitor. If SSL is enabled but the IBM i server is not configured for it, the monitor will report an SSL error.
Network ports
The JT400 library communicates with IBM i host server services over the following ports. Ensure these are open from the On-Premise Poller to the IBM i server:
| Port (Non-SSL) | Port (SSL) | Service |
|---|---|---|
| 449 | 449 | IBM i Port Mapper (initial negotiation) |
| 8476 | 9476 | SIGNON server (authentication) |
| 8471 | 9471 | Database server (JDBC / SQL data collection) |
| 8472 | 9472 | Data Queue server |
| 8473 | 9473 | File server |
| 8475 | 9475 | Remote command server |
Add a monitor
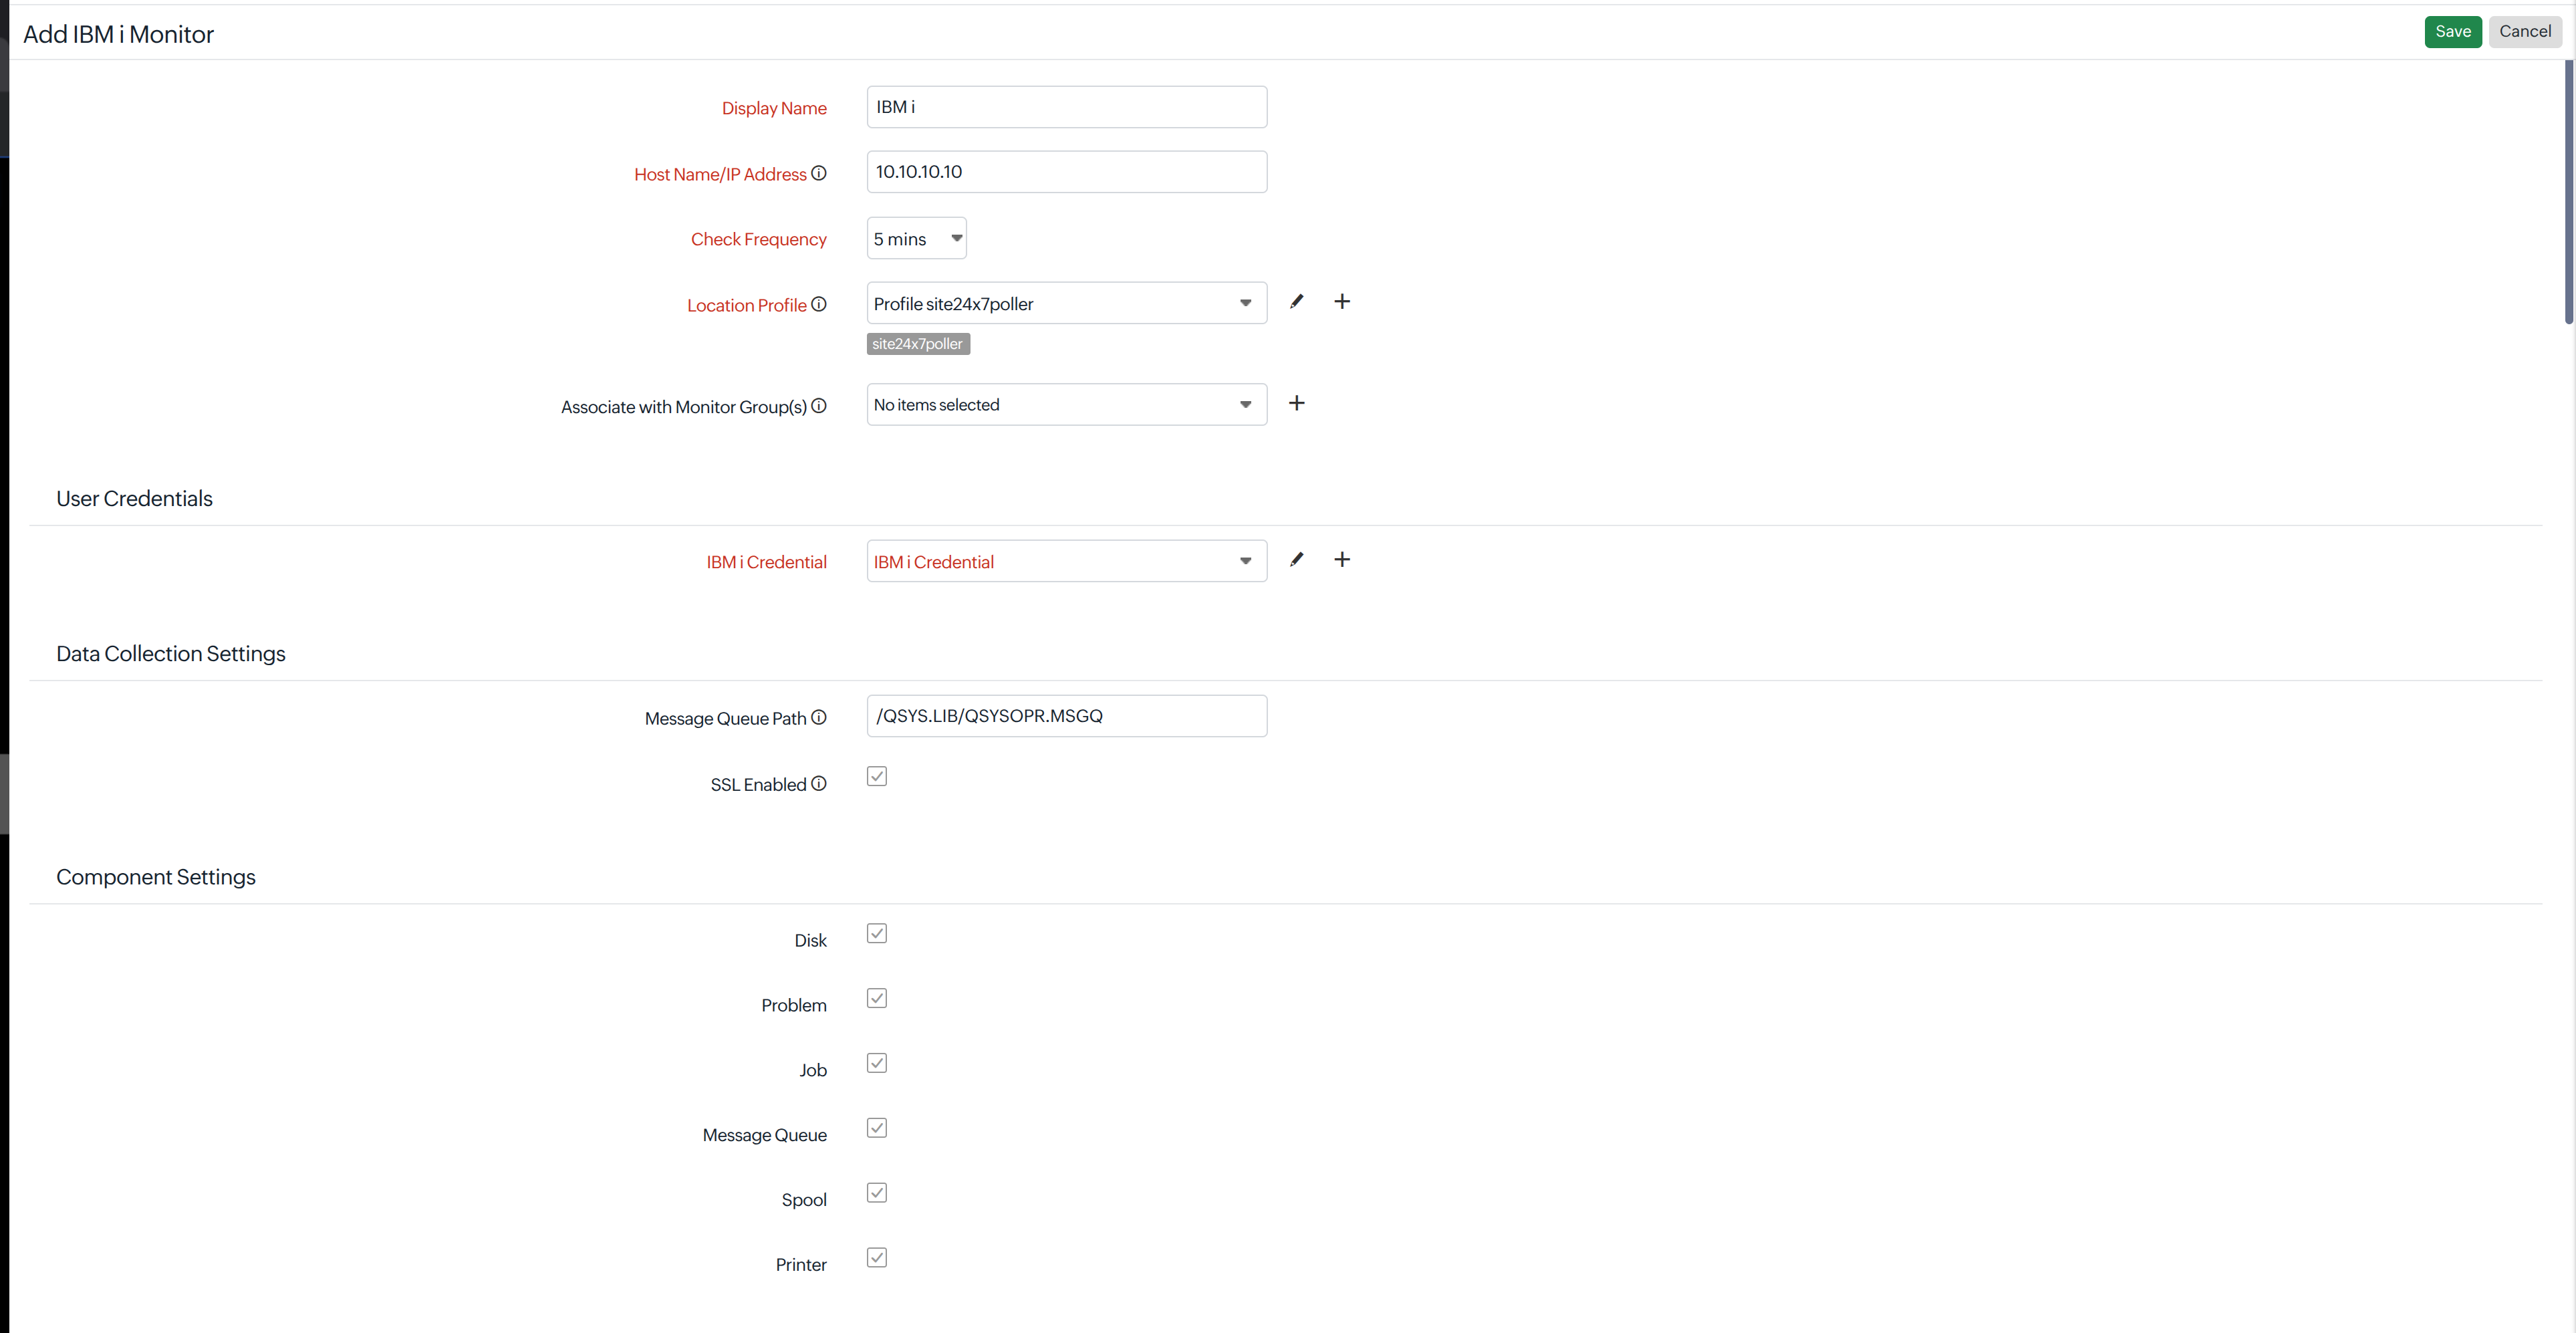
- Navigate to Apps > Enterprise Applications > IBM i and click the + icon.
- On the Add IBM i Monitor page, add an On-Premise Poller or choose from an existing On-Premise Poller that has network access to the IBM i system.
Note: IBM i monitoring is supported from Poller version 6.9.3 and above.
- On the Add IBM i Monitor page, fill in the following details to add the IBM i application server monitor:
- Display Name: Specify a name to identify the IBM i monitor.
- Host Name/IP Address: Provide the hostname or IP address of the server where the IBM i application server is running.
- Check Frequency: Choose a polling frequency from the drop-down list.
- Location Profile: Select the location profile from where the IBM i application server can be monitored from the drop-down list. To learn more, refer to the location profile help page.
- Associate with Monitor Group(s): Select a monitor group from the drop-down list to logically group your monitors. To learn how to create a group for your monitors, refer to the monitor groups help page.
- In the User Credentials section, choose the appropriate credentials stored in the Site24x7 credential profile or add new ones.
To add a new credential:
- Click the + icon next to the IBM i Credential field.
- In the resulting Add Credential pop-up, provide a Credential Name to identify the credential. IBM i will be auto-selected as the Credential Type.
- Provide the Username and Password of the associated IBM i Application Server account.
- Click Save.
- Data Collection Settings
Configure the following settings to collect monitoring data from your IBM i application server:
- Message Queue Path: Specify the path of the IBM i message queue that Site24x7 should monitor. By default, /QSYS.LIB/QSYSOPR.MSGQ is used to monitor messages from the system operator message queue.
- SSL Enabled: Select this option to enable a secure SSL connection between the On-Premise Poller and the IBM i application server.
- Component Settings
Select the IBM i components that you want Site24x7 to monitor. You can enable or disable individual components based on your monitoring requirements.
- Disk: Monitor disk utilization and related storage metrics for the IBM i server.
- Problem: Monitor problems reported on the IBM i system to help identify issues that require attention.
- Job: Monitor jobs running on the IBM i server and collect information about their status and performance.
- Message Queue: Monitor messages available in the configured IBM i message queue to identify system events, warnings, and other messages that may require attention.
- Specify the following details for Configuration Profiles, Alert Settings, and Third-Party Integrations:
- Tags: Associate your monitor with predefined tags to organize and manage your monitors creatively. Learn how to add tags.
- IT Automation Templates: Select an automation to be executed when the IBM i application server's status is down, trouble, or up; when there's any status change; or when there's any attribute change. The defined action gets executed when there is a state change, and the selected user groups get alerted. To automate corrective actions upon a failure, refer to the IT automation help document.
- User Alert Group: Select the user group that needs to be alerted during an outage. To add multiple users to a group, see the user alert group help document.
- Notification Profile: Choose a notification profile from the drop-down list or select the default profile available. A notification profile helps you configure who gets notified and when in the event of downtime. Refer to the notification profile help document to create a customized notification profile.
- Third-Party Integrations: Associate your monitor with preconfigured third-party services. This lets you push your monitor alarms to selected services and facilitate improved incident management.
- Click Save.
Performance metrics
Summary tab
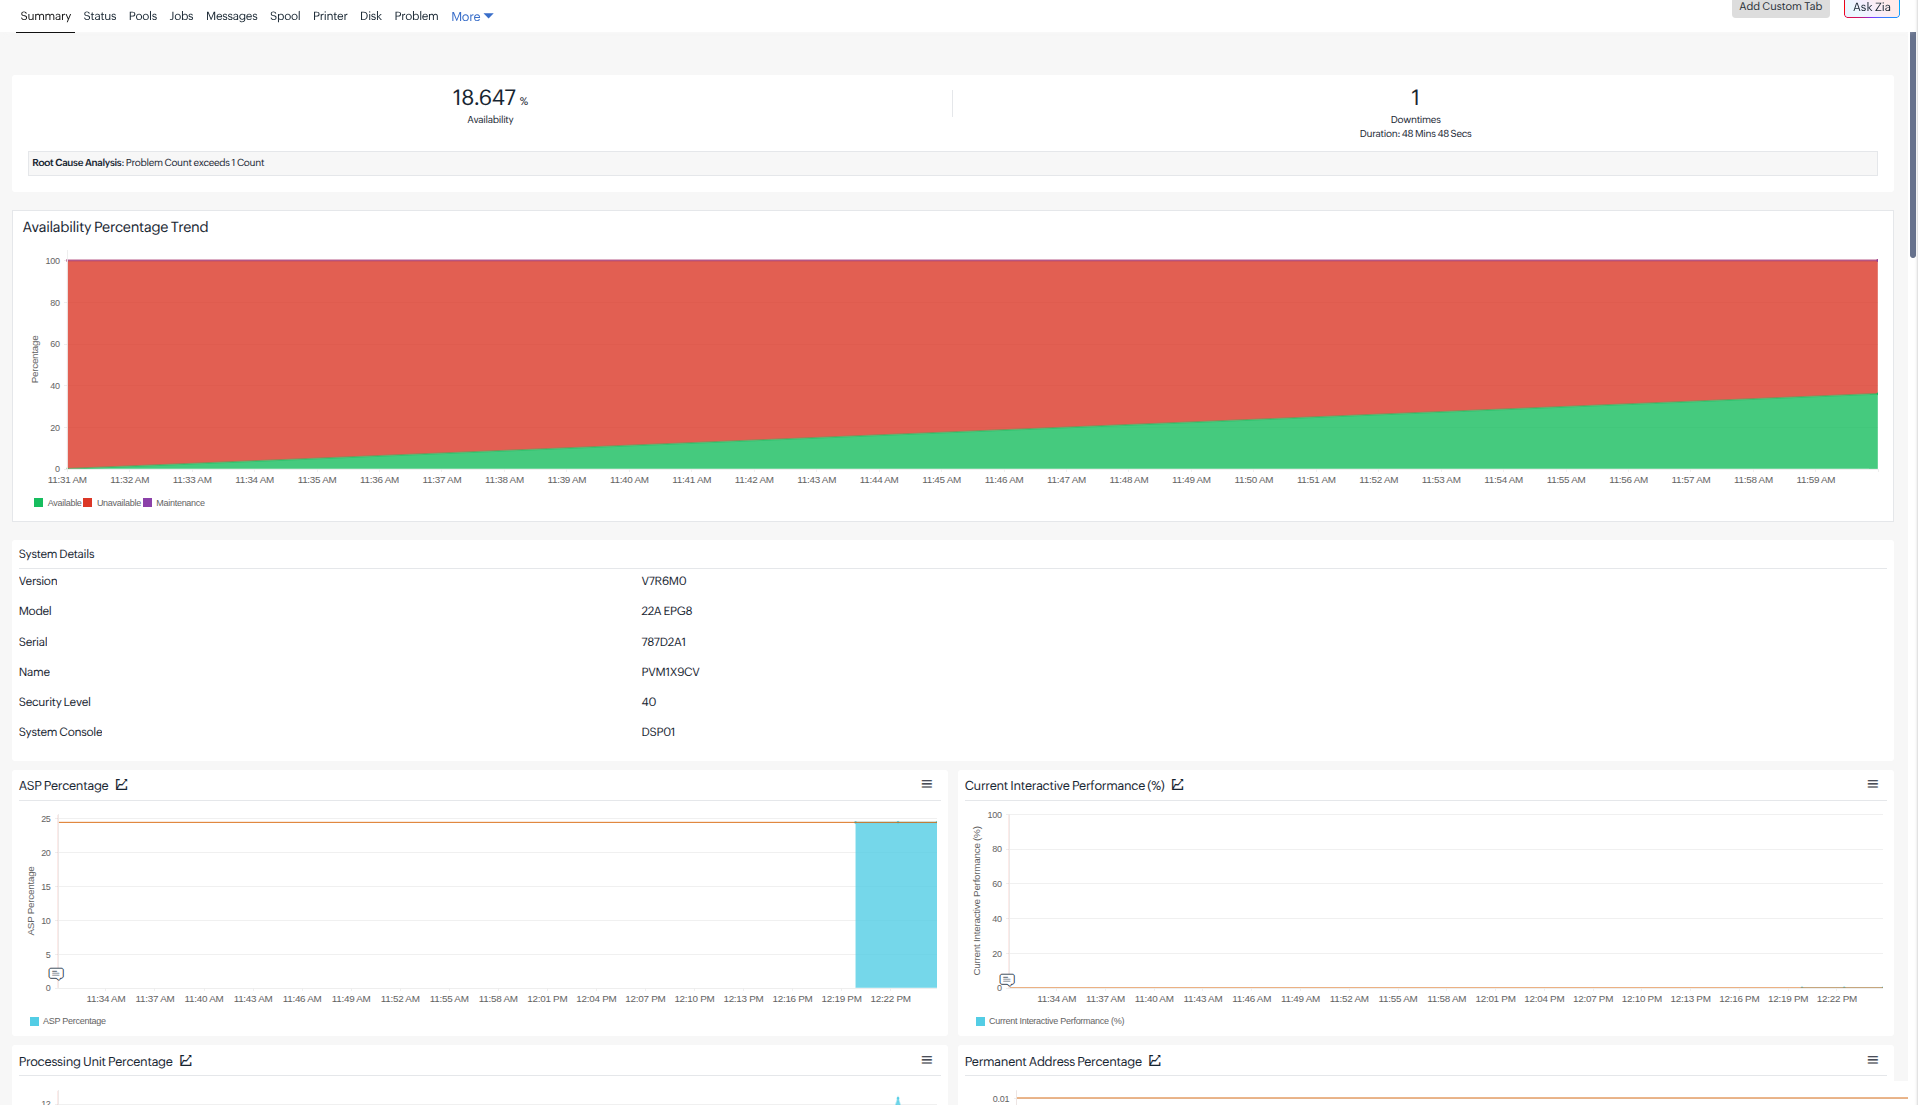
This tab provides a high-level snapshot of the IBM i server’s health. The following are displayed:
| Attribute / Metric | Unit | Description |
|---|---|---|
| Version | — | IBM i OS version. |
| Model | — | IBM i hardware model number. |
| Serial | — | System serial number. |
| Name | — | System name (QSYSNAME). |
| Security Level | — | System security level (QSECURITY). |
| System Console | — | Configured system console device (QCONSOLE). |
| ASP Percentage | % | Percentage of the system Auxiliary Storage Pool (ASP) currently used. |
| Current Interactive Performance (%) | % | Percentage of interactive performance available to users. A lower value means the system is favoring batch work. |
| Processing Unit Percentage | % | Percentage of processing unit capacity currently in use—the primary CPU utilization metric. |
| Permanent Address Percentage | % | Percentage of permanent address space used. |
| Temporary Address Percentage | % | Percentage of temporary address space used. |
| DB Percentage | % | Percentage of the database portion of ASP that is used. |
| Shared Processing Pool (%) | % | Utilization of the shared processor pool (relevant in LPAR environments). |
| Uncapped CPU Capacity (%) | % | For uncapped LPAR partitions, additional CPU capacity available above the partition’s minimum entitlement. |
| Current Processing Capacity | CPUs | Number of processing units currently allocated to the partition. |
| Disk Total Size | MB | Total disk size across all disk arms. |
| Total Auxiliary Storage | MB | Total auxiliary (disk) storage configured on the system. |
| Number of Pools | Count | Total number of memory pools on the system. |
| Total Jobs | Count | Total number of jobs currently on the system. |
| Response Time | ms | Time taken to complete a data collection cycle from the IBM i server. |
| Problem Count | Count | Total number of open hardware/software problems on the system. |
| CPU Overview | — | Chart showing CPU utilization trend. |
| Address Space Overview | — | Chart showing permanent and temporary address space usage. |
| Storage Overview | — | Chart showing ASP and DB storage utilization. |
| Batch Jobs Overview | — | Summary chart of batch job states. |
| User Sessions Overview | — | Summary chart of user session states. |
Status tab
This tab displays detailed information about the IBM i server’s system status, storage, processing capacity, jobs, users, and password expiry.
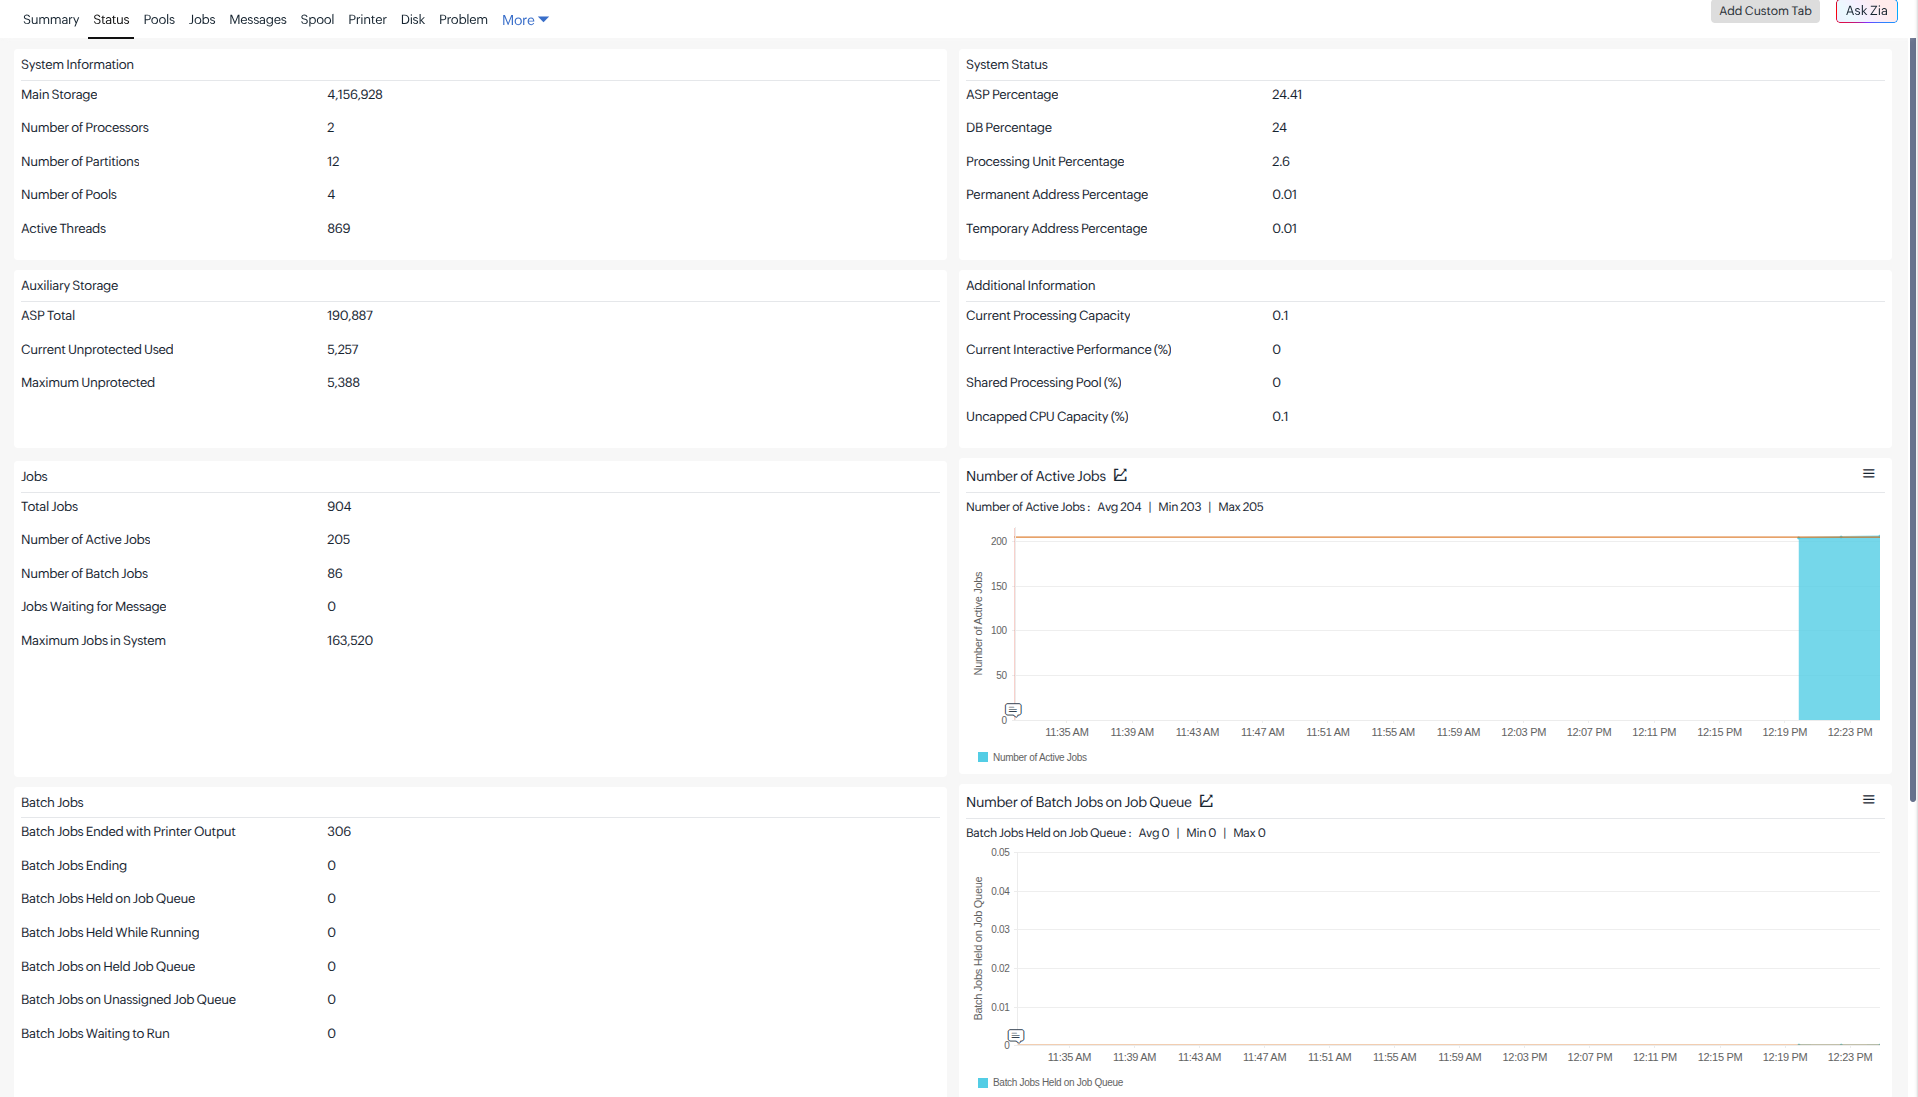
System Information:
| Metric | Unit | Description |
|---|---|---|
| Main Storage | MB | Total main storage (RAM) installed. |
| Number of Processors | Count | Total number of processors available to the partition. |
| Number of Partitions | Count | Number of logical partitions on the system. |
| Number of Pools | Count | Total number of memory pools. |
| Active Threads | Count | Total number of active threads across all jobs. |
System status:
| Metric | Unit | Description |
|---|---|---|
| ASP Percentage | % | Percentage of the system ASP used. |
| DB Percentage | % | Percentage of the database portion of ASP used. |
| Processing Unit Percentage | % | Percentage of processing unit capacity in use. |
| Permanent Address Percentage | % | Percentage of permanent address space used. |
| Temporary Address Percentage | % | Percentage of temporary address space used. |
| ASP Total | MB | Total capacity of the system ASP. |
| Current Unprotected Used | MB | Amount of unprotected storage currently in use. |
| Maximum Unprotected | MB | Maximum unprotected storage used since the last IPL. |
Auxiliary Storage
System status:
| Metric | Unit | Description |
|---|---|---|
| ASP Total | MB | Total capacity of the system ASP. |
| Current Unprotected Used | MB | Amount of unprotected storage currently in use. |
| Maximum Unprotected | MB | Maximum unprotected storage used since the last IPL. |
Additional information:
| Metric | Unit | Description |
|---|---|---|
| Current Processing Capacity | CPUs | Processing units currently allocated to the partition. |
| Current Interactive Performance (%) | % | Interactive performance available to users. |
| Shared Processing Pool (%) | % | Shared processor pool utilization. |
| Uncapped CPU Capacity (%) | % | Additional CPU capacity available above minimum entitlement (uncapped partitions). |
Jobs:
| Metric | Unit | Description |
|---|---|---|
| Total Jobs | Count | Total number of jobs on the system. |
| Number of Active Jobs | Count | Number of currently active jobs. |
| Number of Batch Jobs | Count | Number of batch jobs currently active. |
| Jobs Waiting for Message | Count | Number of jobs in MSGW state, waiting for a message reply. |
| Maximum Jobs in System | Count | System-configured maximum number of jobs allowed (QMAXJOB). |
Batch jobs:
| Metric | Unit | Description |
|---|---|---|
| Batch Jobs Ended with Printer Output | Count | Batch jobs that ended with spooled printer output still waiting. |
| Batch Jobs Ending | Count | Batch jobs currently in the process of ending. |
| Batch Jobs Held on Job Queue | Count | Batch jobs held on their job queue before starting. |
| Batch Jobs Held While Running | Count | Batch jobs held after they started running. |
| Batch Jobs on Held Job Queue | Count | Batch jobs on a job queue that is itself held. |
| Batch Jobs on Unassigned Job Queue | Count | Batch jobs on a job queue not assigned to any subsystem. |
| Batch Jobs Waiting to Run | Count | Batch jobs waiting in a job queue to be dispatched. |
| Number of Batch Jobs on Job Queue | Count | Total count of batch jobs waiting across all job queues. |
Users:
| Metric | Unit | Description |
|---|---|---|
| Users Signed On | Count | Number of users currently signed on to the system. |
| User Sign Off Printer Output Without Print | Count | Users signed off with unprinted spooled output remaining. |
| Users Suspended by Group Job | Count | Users whose interactive jobs are suspended because a group job is active. |
| Users Suspended by System Request | Count | Users who have pressed the System Request key and are suspended. |
| Users Temporarily Signed Off | Count | Users in a disconnected session state. |
| Number of Users Signed On | Count | Total count of currently active signed-on users. |
Password Expiry Information:
| Metric | Unit | Description |
|---|---|---|
| Password Days to Expire | Days | Number of days remaining before the monitoring user profile’s password expires. |
Pools tab
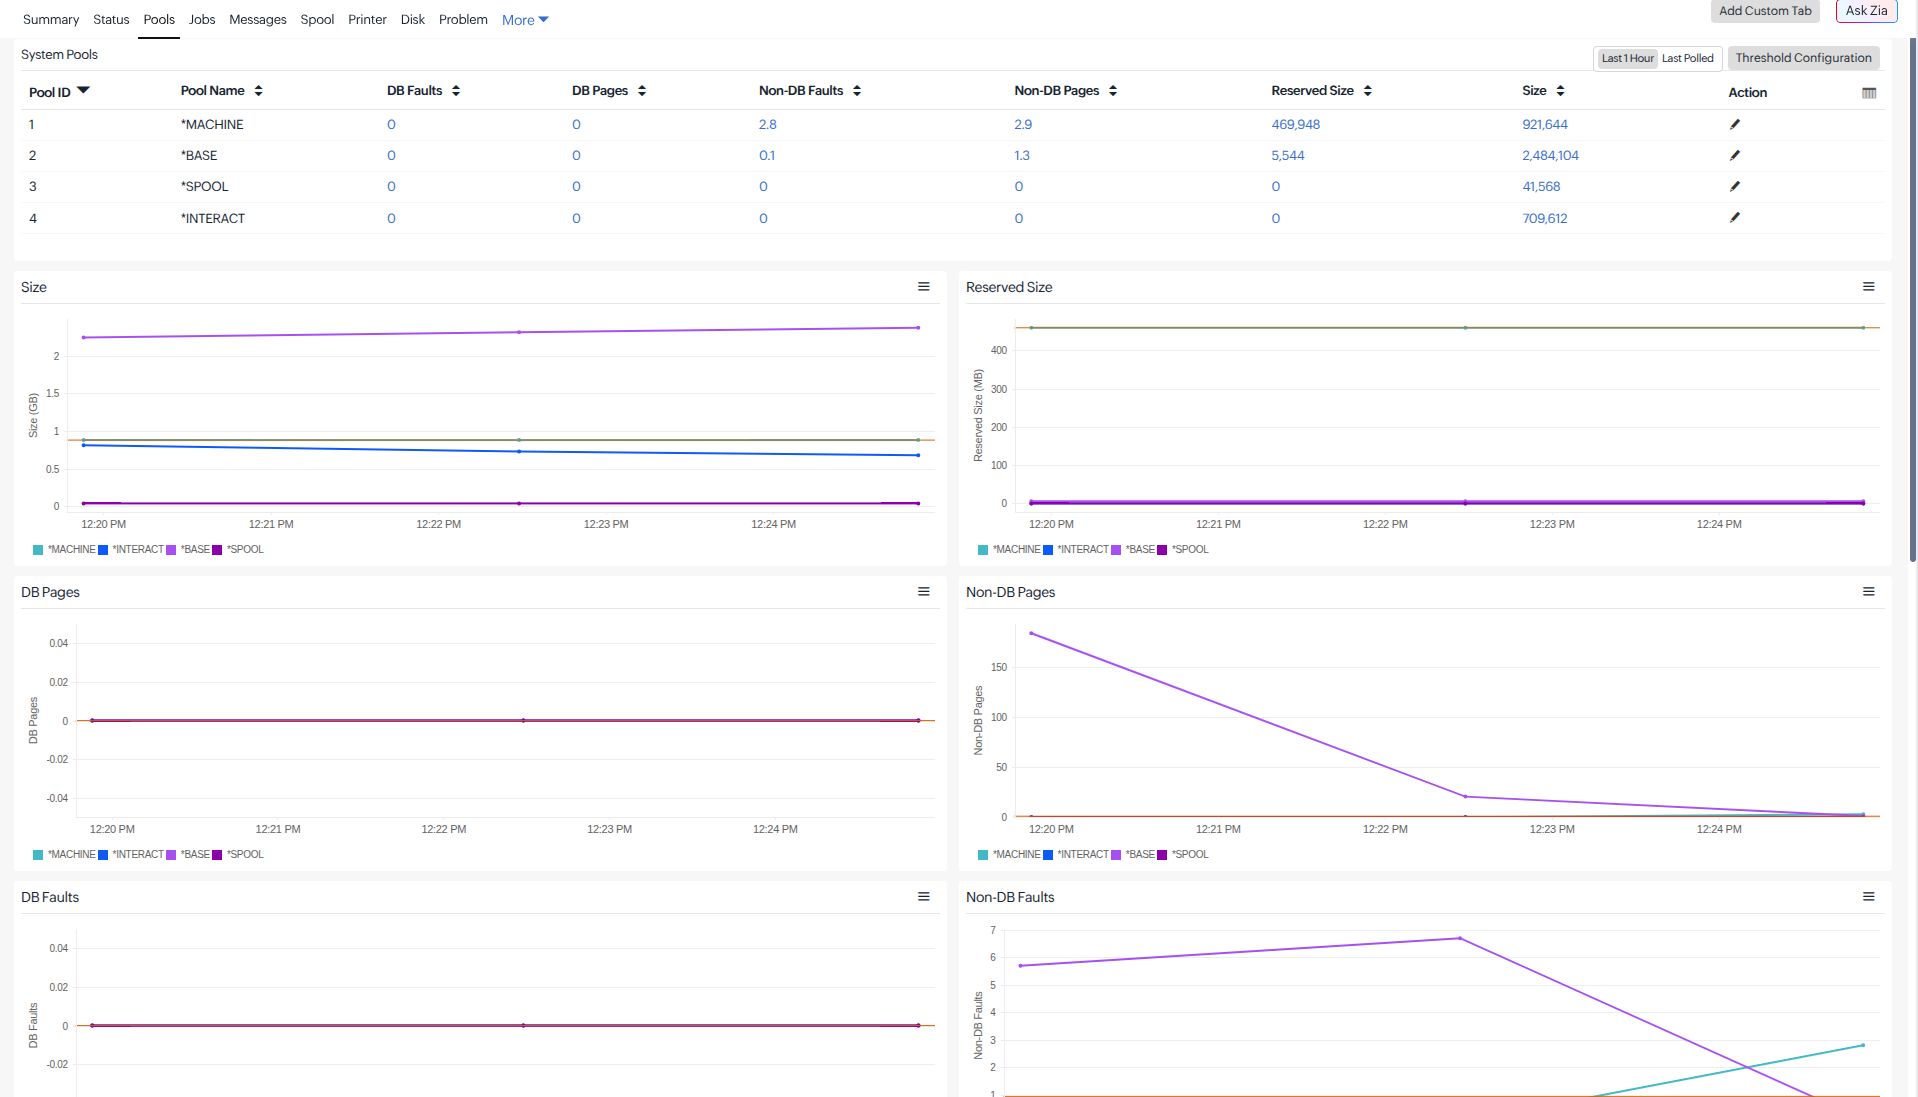
Metrics are displayed per memory pool (for example, *BASE, *INTERACT).
| Metric | Unit | Description |
|---|---|---|
| Size | KB | Total size of the memory pool. |
| Reserved Size | KB | Amount of the pool reserved and unavailable for paging. |
| DB Pages | /sec | Database pages brought into memory per second. |
| Non-DB Pages | /sec | Non-database pages brought into memory per second. |
| DB Faults | /sec | Database page faults per second—pages needed that were not in memory. A high fault rate may indicate the pool size needs to be increased. |
| Non-DB Faults | /sec | Non-database page faults per second. |
| DB Faults vs Non-DB Faults | — | Comparative chart of DB and non-DB fault rates. |
| DB Pages vs Non-DB Pages | — | Comparative chart of DB and non-DB page activity. |
| Pool Size vs Reserved Size | — | Chart comparing total pool size against reserved portion. |
| Pool Size | — | Chart showing memory pool size over time. |
Jobs tab
This tab displays the status and performance of active and monitored jobs on the IBM i server, including job details, CPU usage, threads, and uptime.
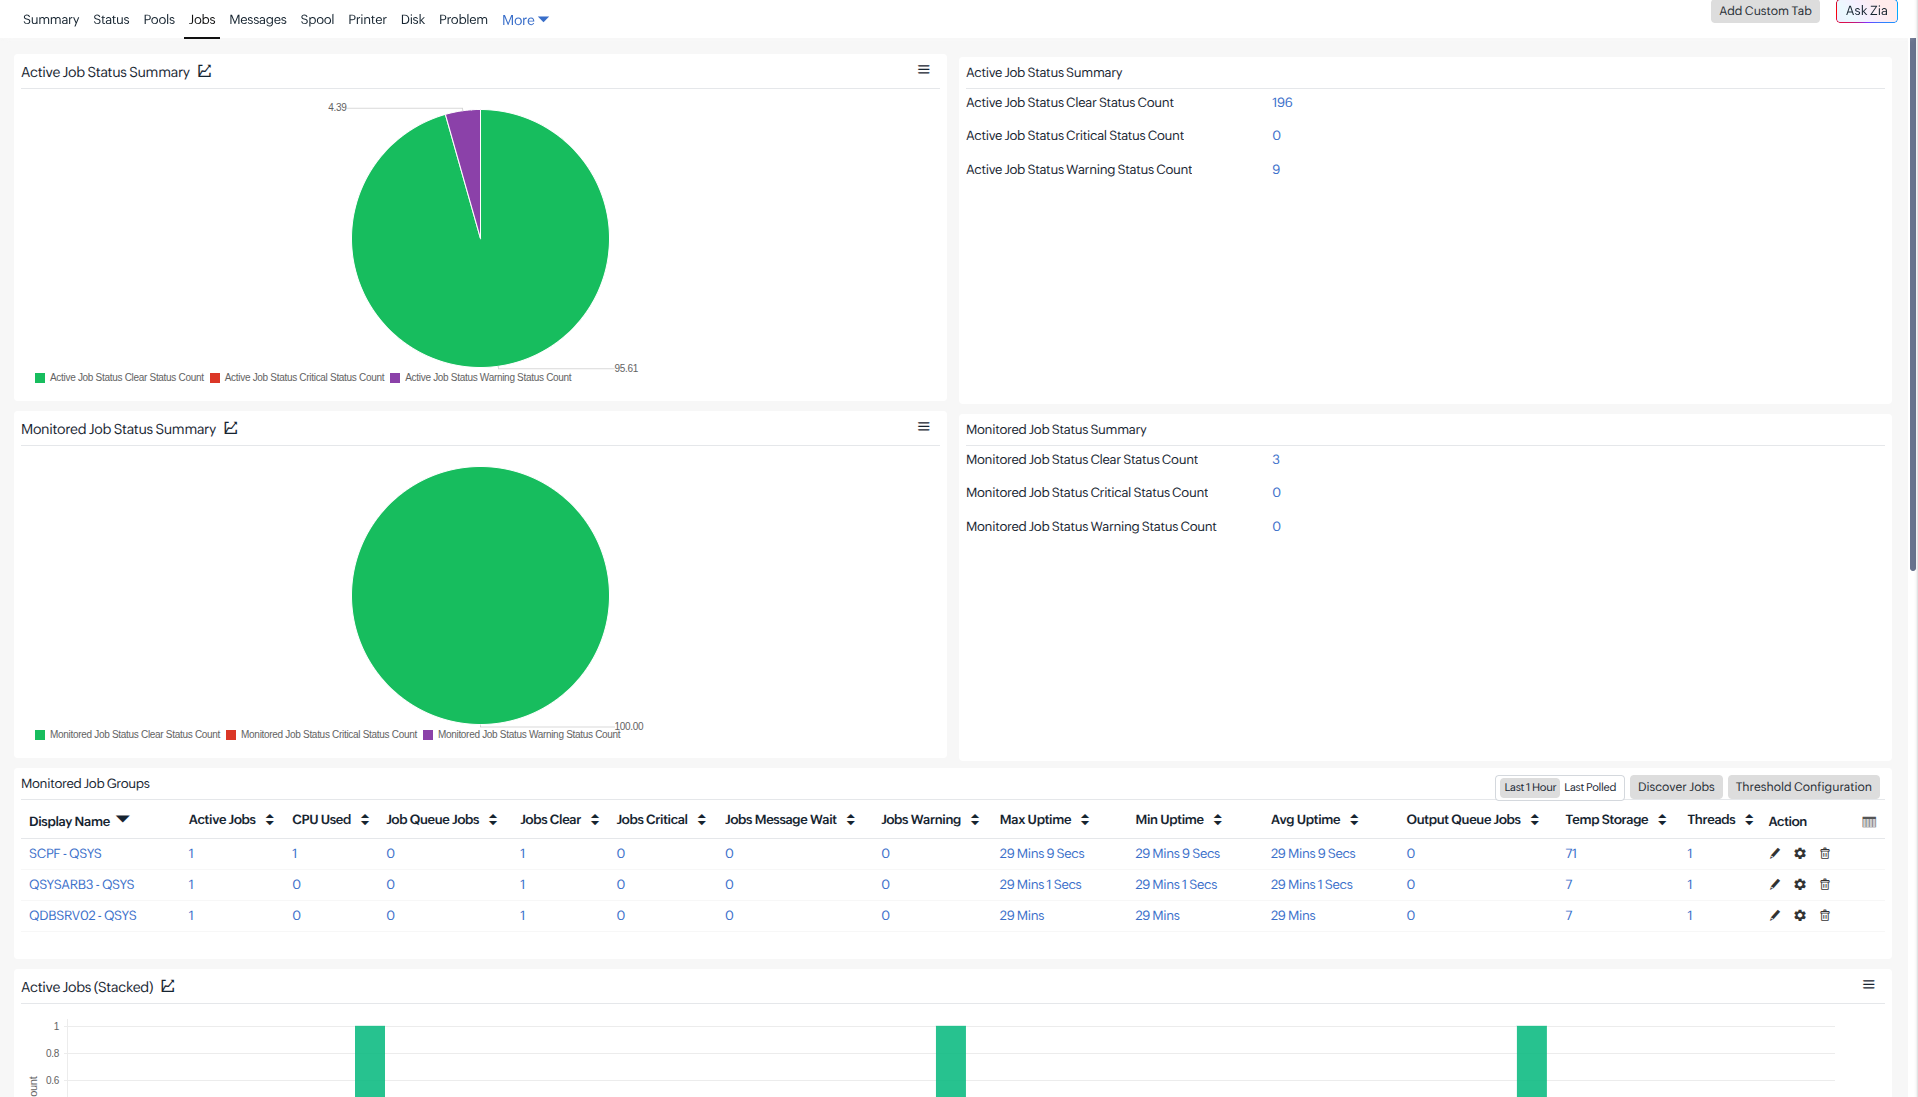
Active Job Status Summary:
| Metric | Unit | Description |
|---|---|---|
| Active Job Status — Clear Count | Count | Number of active jobs in a healthy state. |
| Active Job Status — Warning Count | Count | Number of active jobs in a warning state. |
| Active Job Status — Critical Count | Count | Number of active jobs in a critical state. |
Monitored Job Status Summary:
| Metric | Unit | Description |
|---|---|---|
| Monitored Job Status — Clear Count | Count | Number of monitored jobs in a healthy state. |
| Monitored Job Status — Warning Count | Count | Number of monitored jobs in a warning state. |
| Monitored Job Status — Critical Count | Count | Number of monitored jobs in a critical state. |
Monitored Job Groups:
Custom job groups track a specific set of jobs matching defined criteria. Per group, the following are collected:
| Metric | Unit | Description |
|---|---|---|
| Active Jobs | Count | Number of jobs in this group currently active. |
| CPU Used | Seconds | Total CPU time consumed by jobs in this group. |
| Job Queue Jobs (JOBQ) | Count | Jobs in this group waiting in a job queue. |
| Output Queue Jobs (OUTQ) | Count | Jobs in this group with output queue entries. |
| Jobs Clear | Count | Jobs in this group in a healthy state. |
| Jobs Warning | Count | Jobs in this group in a warning state. |
| Jobs Critical | Count | Jobs in this group in a critical state. |
| Jobs Message Wait | Count | Jobs in this group waiting for a message reply. |
| Temp Storage | MB | Temporary storage used by jobs in this group. |
| Threads | Count | Total threads across jobs in this group. |
| Max Uptime | ms | Uptime of the longest-running job in this group. |
| Min Uptime | ms | Uptime of the shortest-running job in this group. |
| Avg Uptime | ms | Average uptime across jobs in this group. |
Job Details:
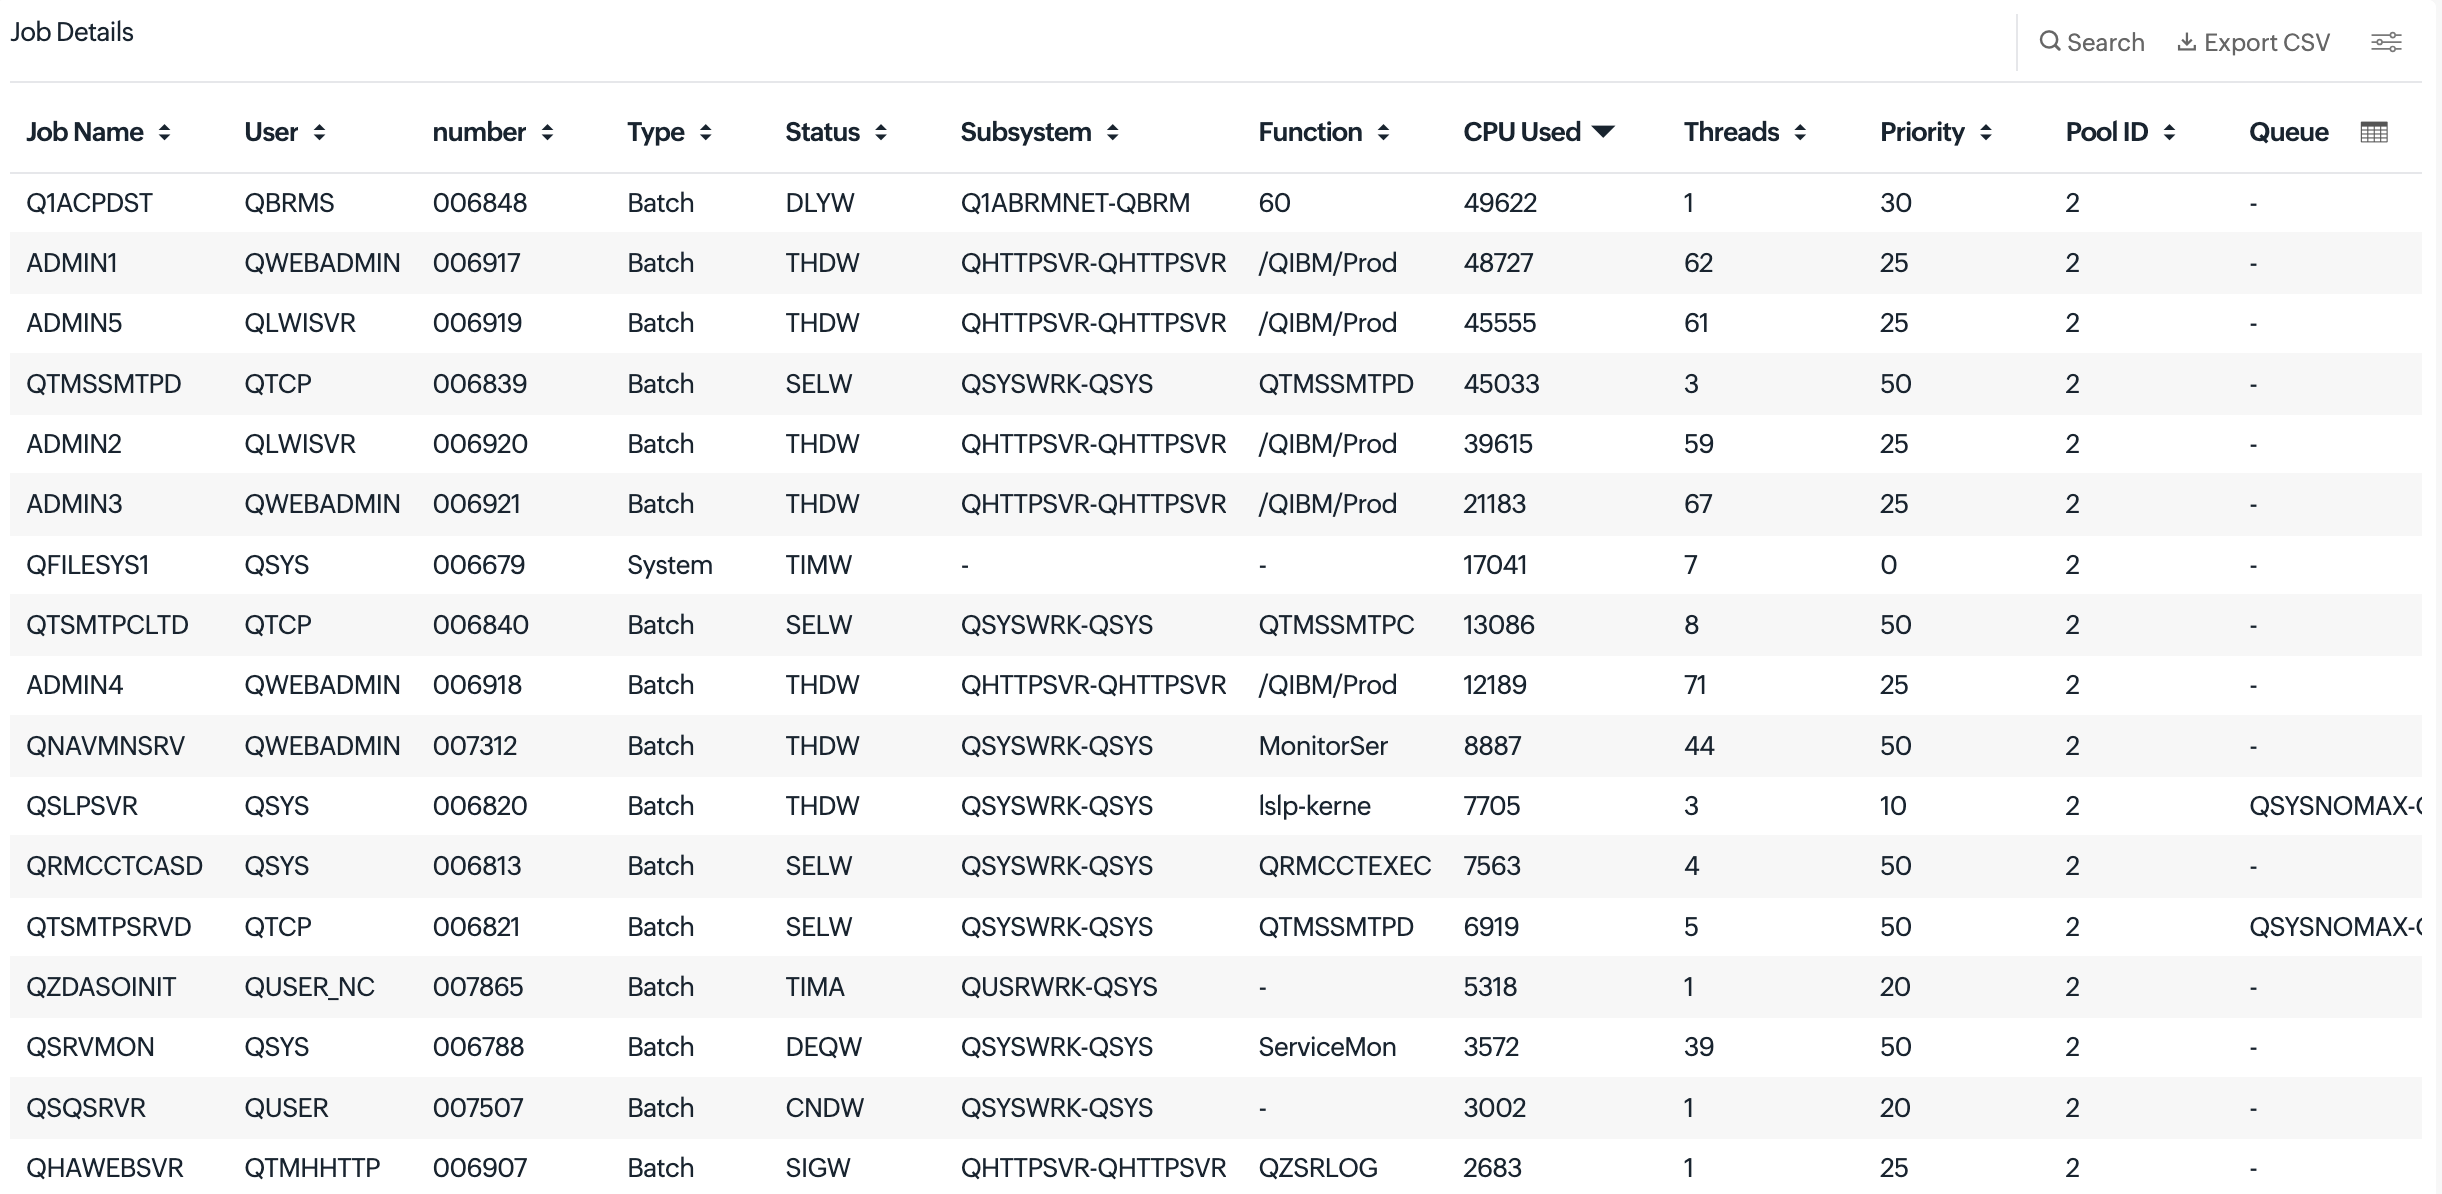
A tabular list of the top 100 active jobs. Each row includes:
| Column | Unit | Description |
|---|---|---|
| Job Name | — | Job name on the IBM i system. |
| User | — | User profile that submitted or is running the job. |
| Number | — | IBM i job number (unique identifier per job). |
| Type | — | Job type (for example, Batch, Interactive, Autostart, System). |
| Status | — | Current job status (for example, ACTIVE, MSGW, HLD, LCKW, OUTQ). |
| Function | — | Current function being performed by the job (for example, PGM-MYPGM). |
| Subsystem | — | Name of the subsystem the job is running under. |
| CPU Used | ms | Total CPU time consumed by this job (milliseconds). |
| Threads | Count | Number of threads in this job. |
| Priority | — | Run priority of the job (1–99, lower = higher priority). |
| Pool ID | — | System pool ID the job is running in. |
| Queue | — | Job queue the job was submitted to (Name-Library format). |
| Uptime | ms | Time since the job started (milliseconds). |
Messages tab
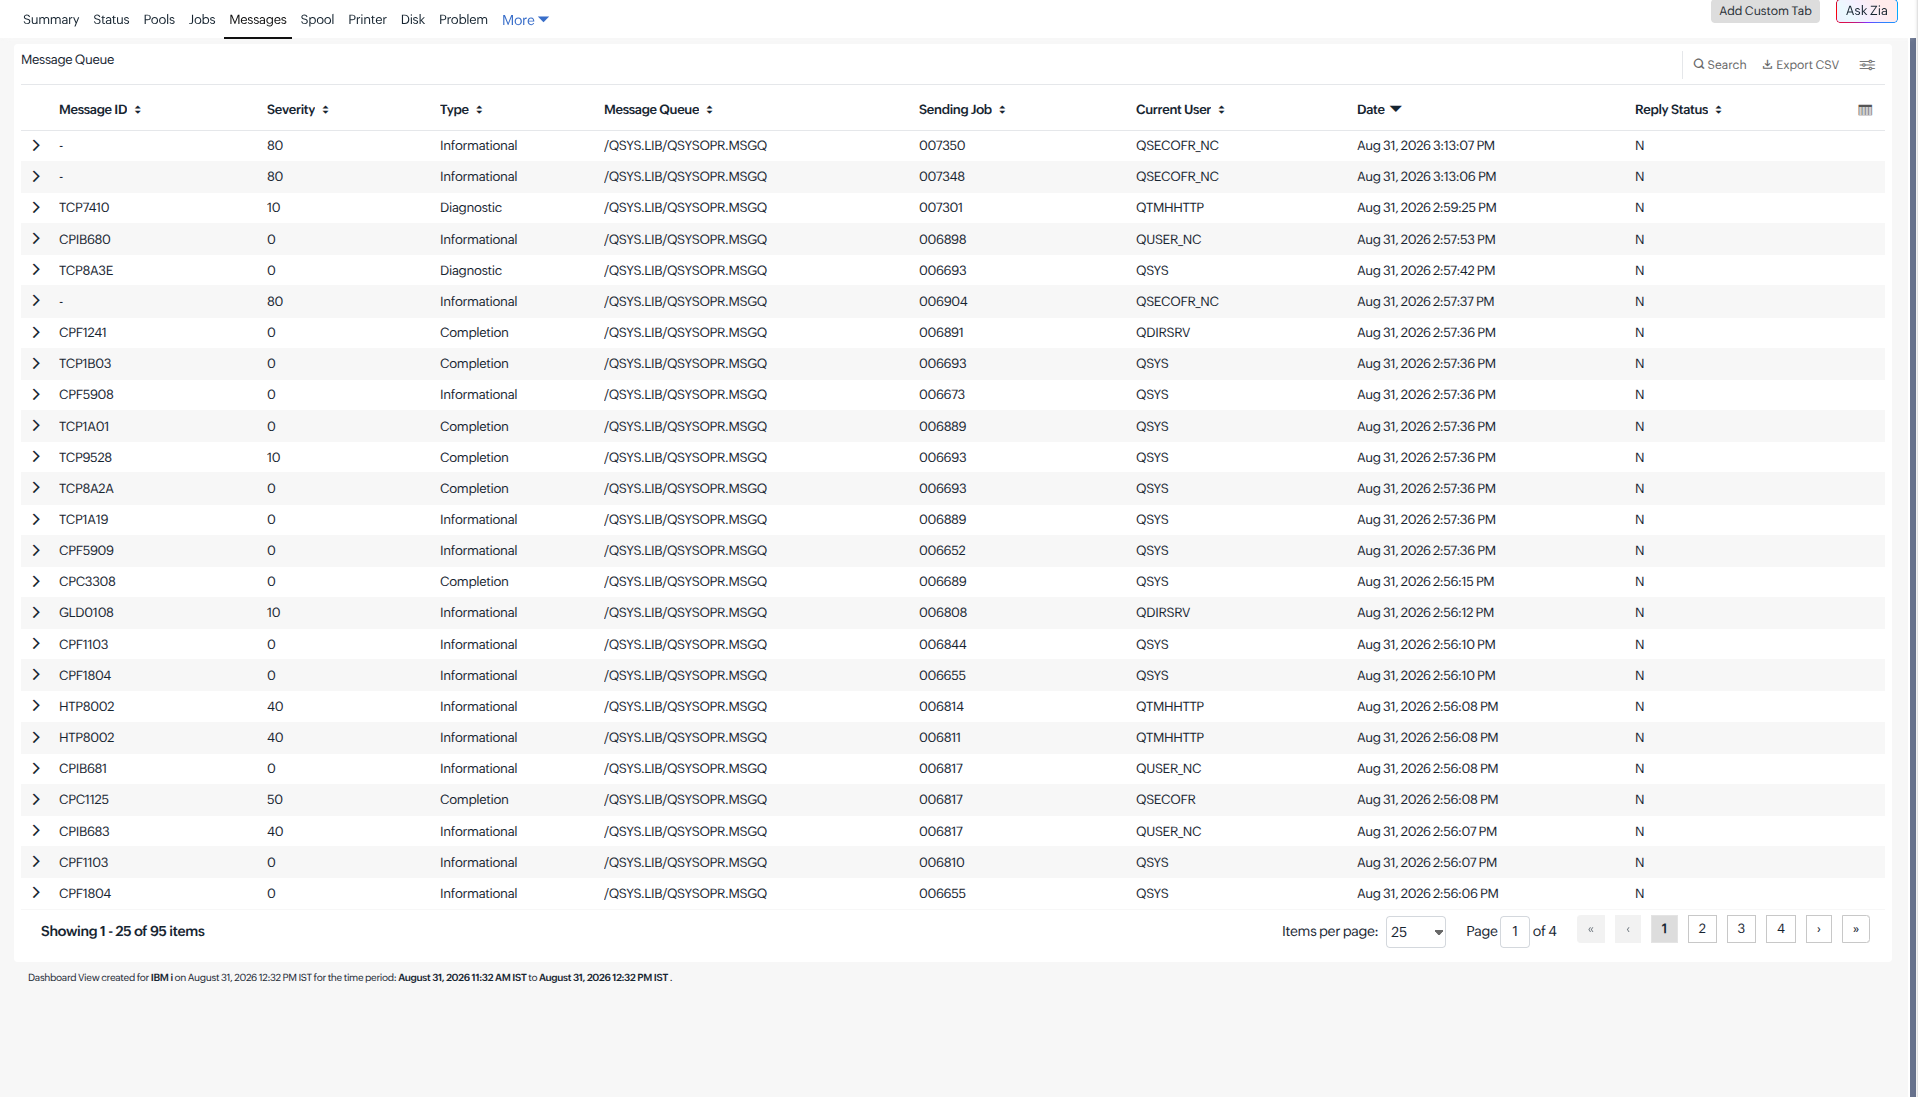
Messages collected from the configured message queue (default: /QSYS.LIB/QSYSOPR.MSGQ). Each row includes:
| Column | Unit | Description |
|---|---|---|
| Message ID | — | IBM i message identifier (for example, CPF1234). |
| Severity | 0–99 | Message severity level (0 = informational, 99 = most severe). |
| Type | — | Message type (for example, Informational, Inquiry, Completion, Diagnostic, Escape, Reply, Notify, Status, Request). |
| Message Queue | — | IFS path of the message queue this message was collected from. |
| Current User | — | User profile associated with the job that sent the message. |
| Date | Timestamp | Date and time the message was sent (Unix epoch ms). |
| From Program | — | Program name that sent the message. |
| Message | — | Full message text. |
| Message Help | — | Extended message help text (cause and recovery information). |
| Default Reply | — | Default reply for inquiry messages. |
| Alert Option | — | Alert option set on the message (*IMMED, *UNATTEND, *NO, etc.). |
| Sending Job | — | Job number of the sending job. |
| Reply Status | — | Whether the message has been replied to. |
| File Name | — | Message file from which the message was retrieved. |
Spool tab
This tab displays a summary and detailed information about the spooled files on the IBM i server, including their status, associated jobs, printers, and page count.
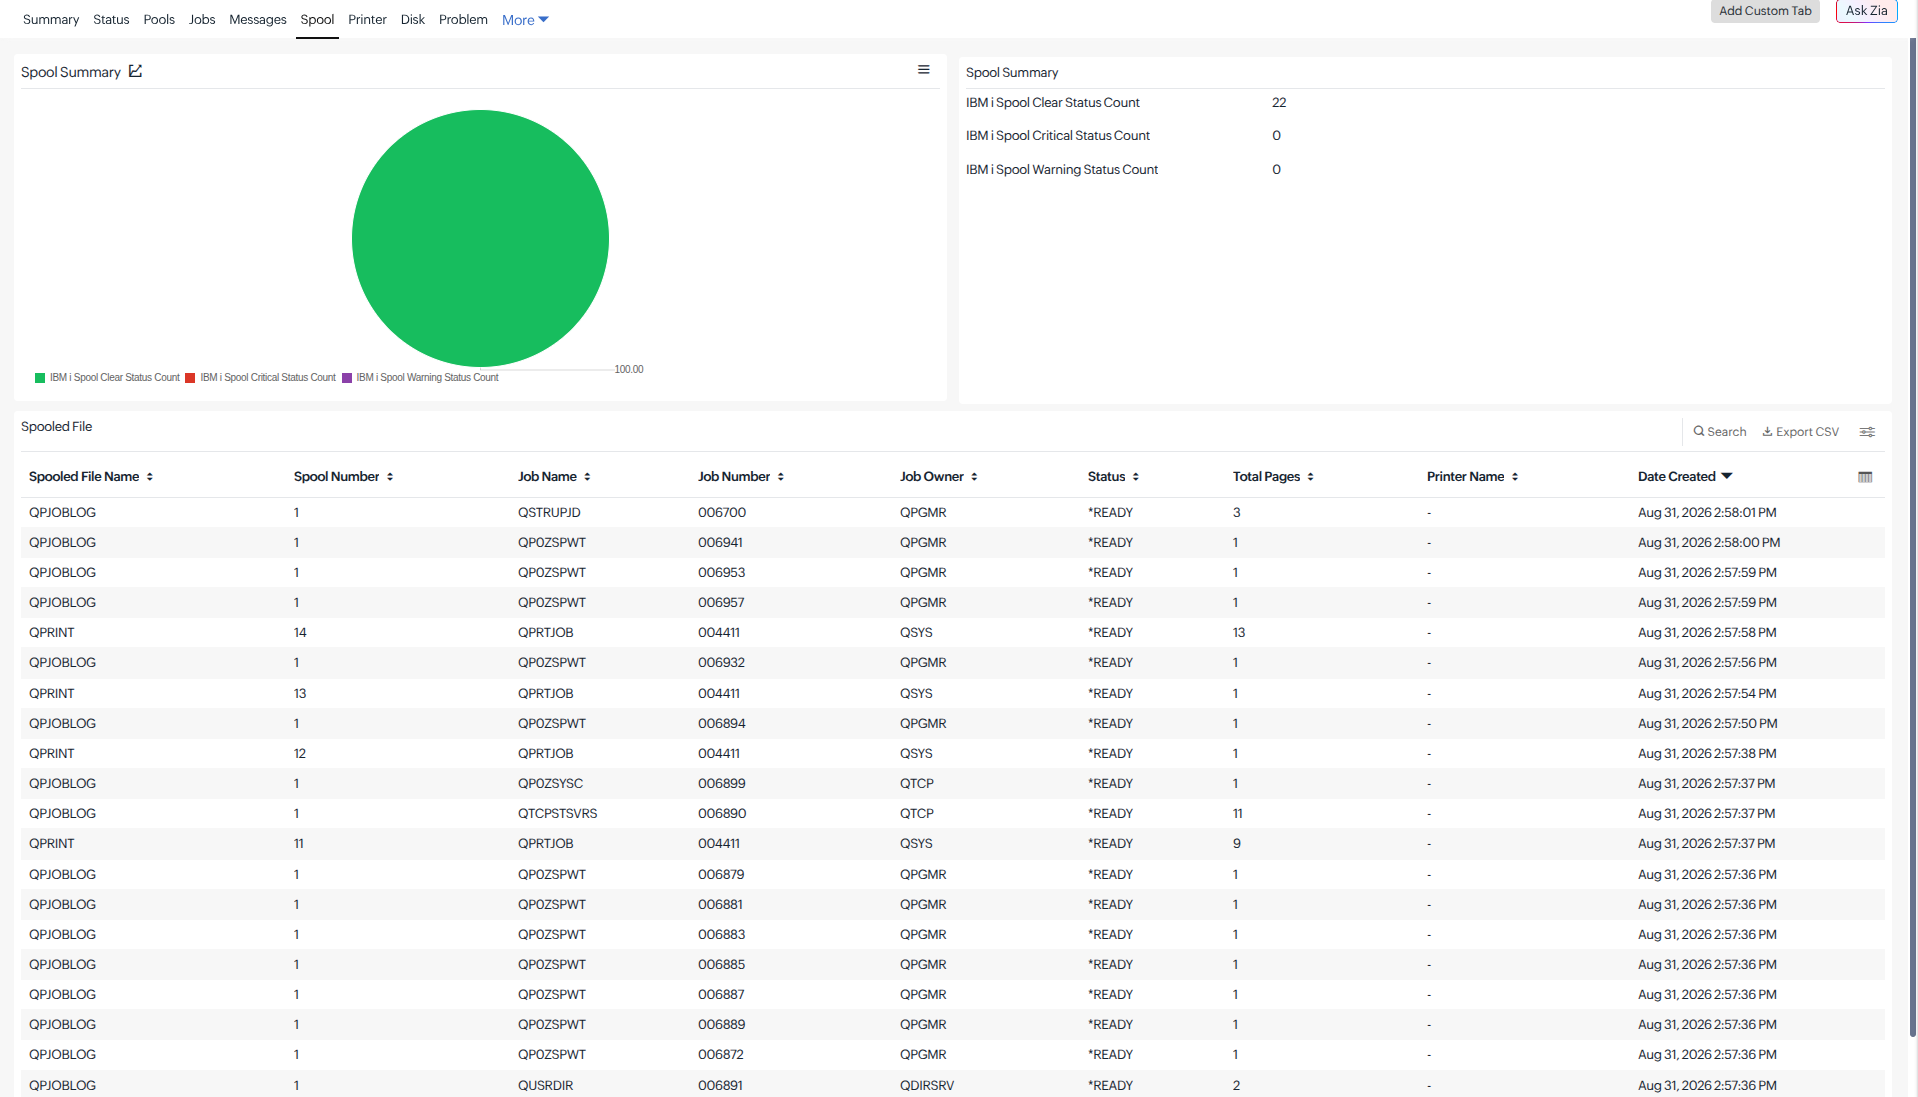
Spool summary:
| Metric | Unit | Description |
|---|---|---|
| IBM i Spool — Clear Count | Count | Number of spooled files in a healthy status. |
| IBM i Spool — Warning Count | Count | Number of spooled files in a warning status. |
| IBM i Spool — Critical Count | Count | Number of spooled files in a critical status. |
Spooled files:
A tabular list of current spooled files on the system. Each row includes:
| Column | Unit | Description |
|---|---|---|
| Spooled File Name | — | Spooled file name. |
| Spool Number | — | Spooled file number (IBM i assigns a unique number per file per job). |
| Job Name | — | Name of the job that created this spooled file. |
| Job Number | — | Job number of the creating job. |
| Job Owner | — | User profile of the job owner. |
| Status | — | Current spooled file status (for example, RDY – Ready to print, OPN – Open/being written, HLD – Held, SAV – Saved, WTR – Being written to printer, PND – Pending, PRT – Currently printing, FIN – Finished, DFR – Deferred). |
| Total Pages | Count | Total number of pages in the spooled file. |
| Printer Name | — | Name of the printer device this spooled file is assigned to. |
| Date Created | Timestamp | Date and time the spooled file was created (Unix epoch ms). |
Printer tab
Metrics are collected per printer device connected to the IBM i server.
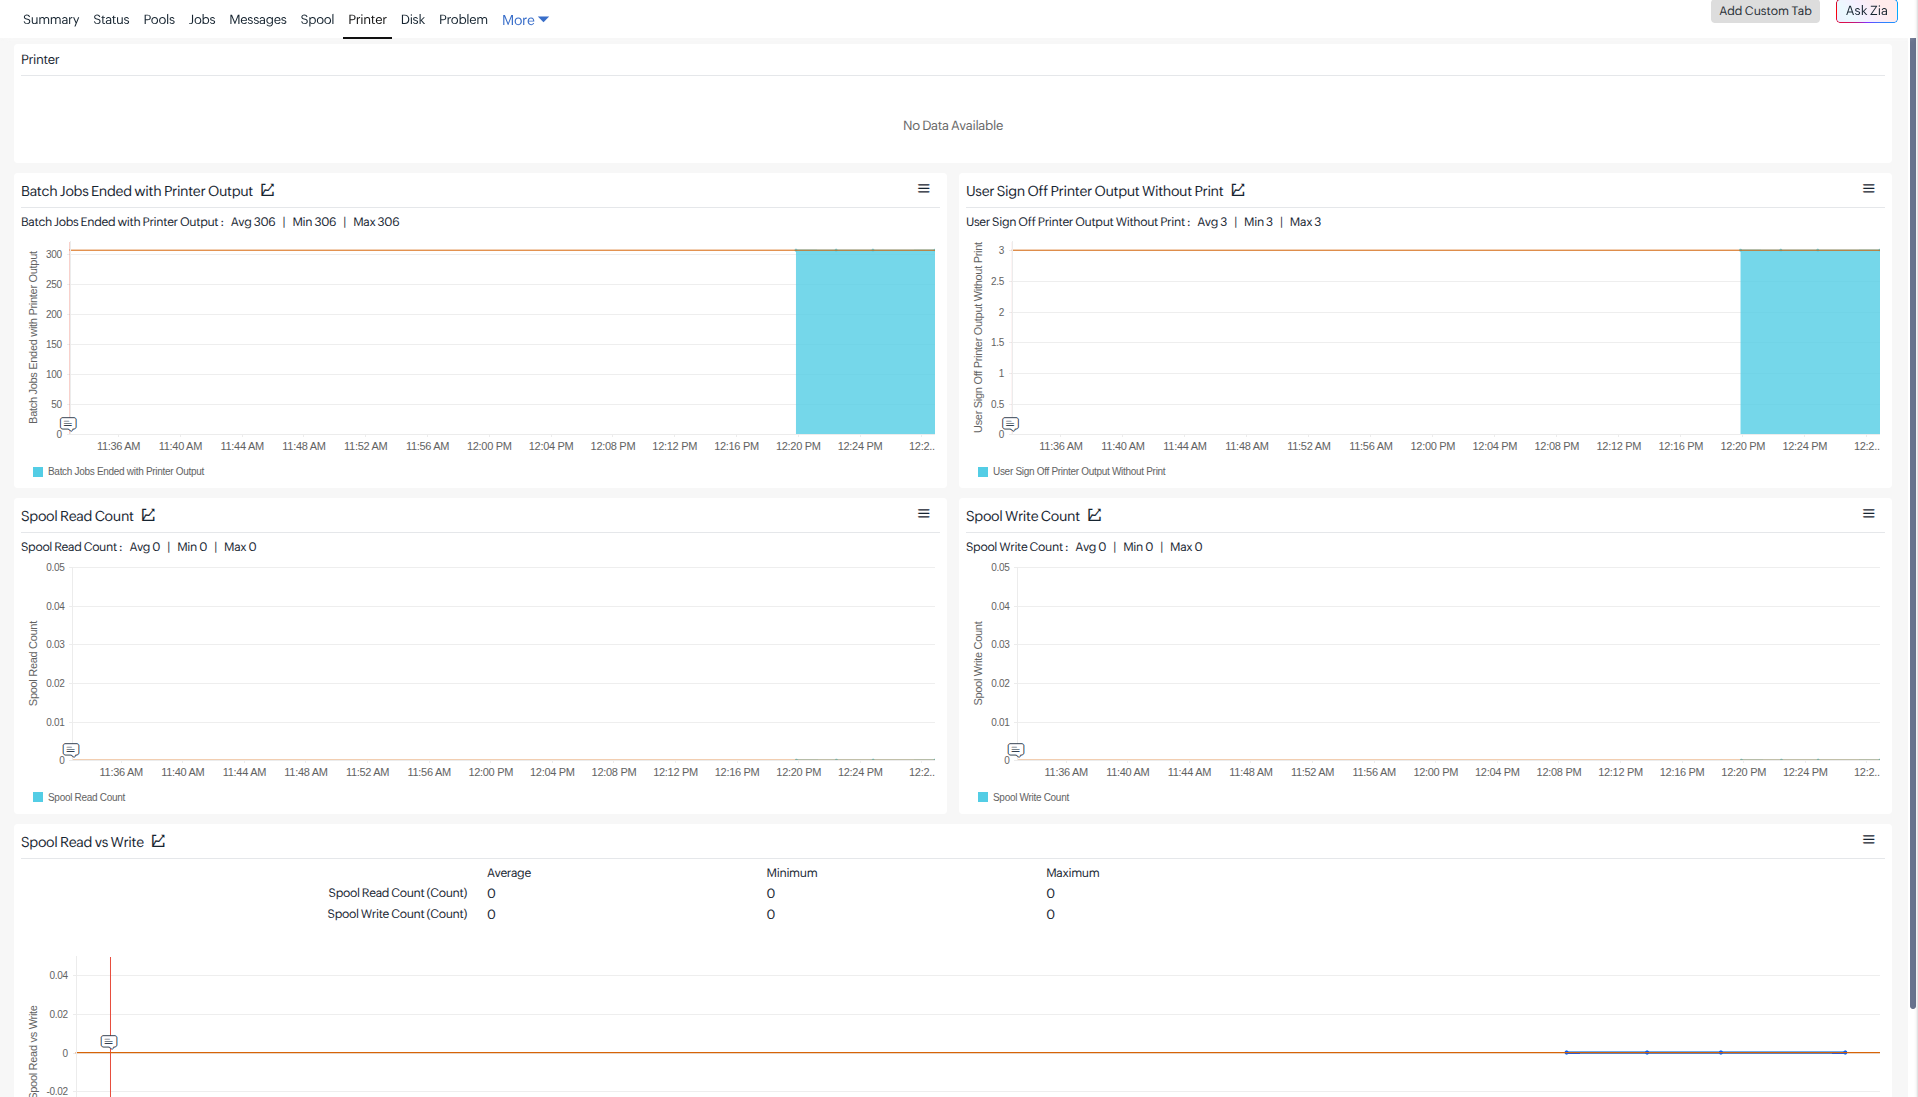
Printer:
Each printer row includes:
| Column | Unit | Description |
|---|---|---|
| Device Name | — | Name of the printer device. |
| Device Class | — | Hardware class of the printer device. |
| Device Type | — | Manufacturer type of the printer device. |
| Status | — | Current device status (for example, Active, Varied Off, Failed, Held). |
| Writer Job Name | — | Name of the writer job currently serving this printer. |
| Writer Job Number | — | Job number of the writer job. |
| Writer Job Status | — | Status of the writer job. |
| Started By | — | User who started the writer job. |
| Spooled File Name | — | Name of the spooled file currently printing. |
| Spooled File Number | Count | Number of the spooled file currently printing. |
| Total Pages | Count | Total pages in the current print job. |
| Spooled File Size | Bytes | Size of the spooled file currently printing. |
| Output Queue | — | Name of the output queue this printer is drawing from. |
| Output Queue Status | — | Current status of the output queue. |
Graphs:
| Metric | Unit | Description |
|---|---|---|
| Batch Jobs Ended with Printer Output | Count | Count of batch jobs that ended with printer output still in the output queue. |
| User Sign Off Printer Output Without Print | Count | Count of users who signed off with unprinted output. |
| Spool Read Count | Count | Number of active spooled reader jobs. |
| Spool Write Count | Count | Number of active spooled writer jobs. |
| Spool Read vs Write | — | Comparative chart of spool reader and writer job activity. |
Disk tab
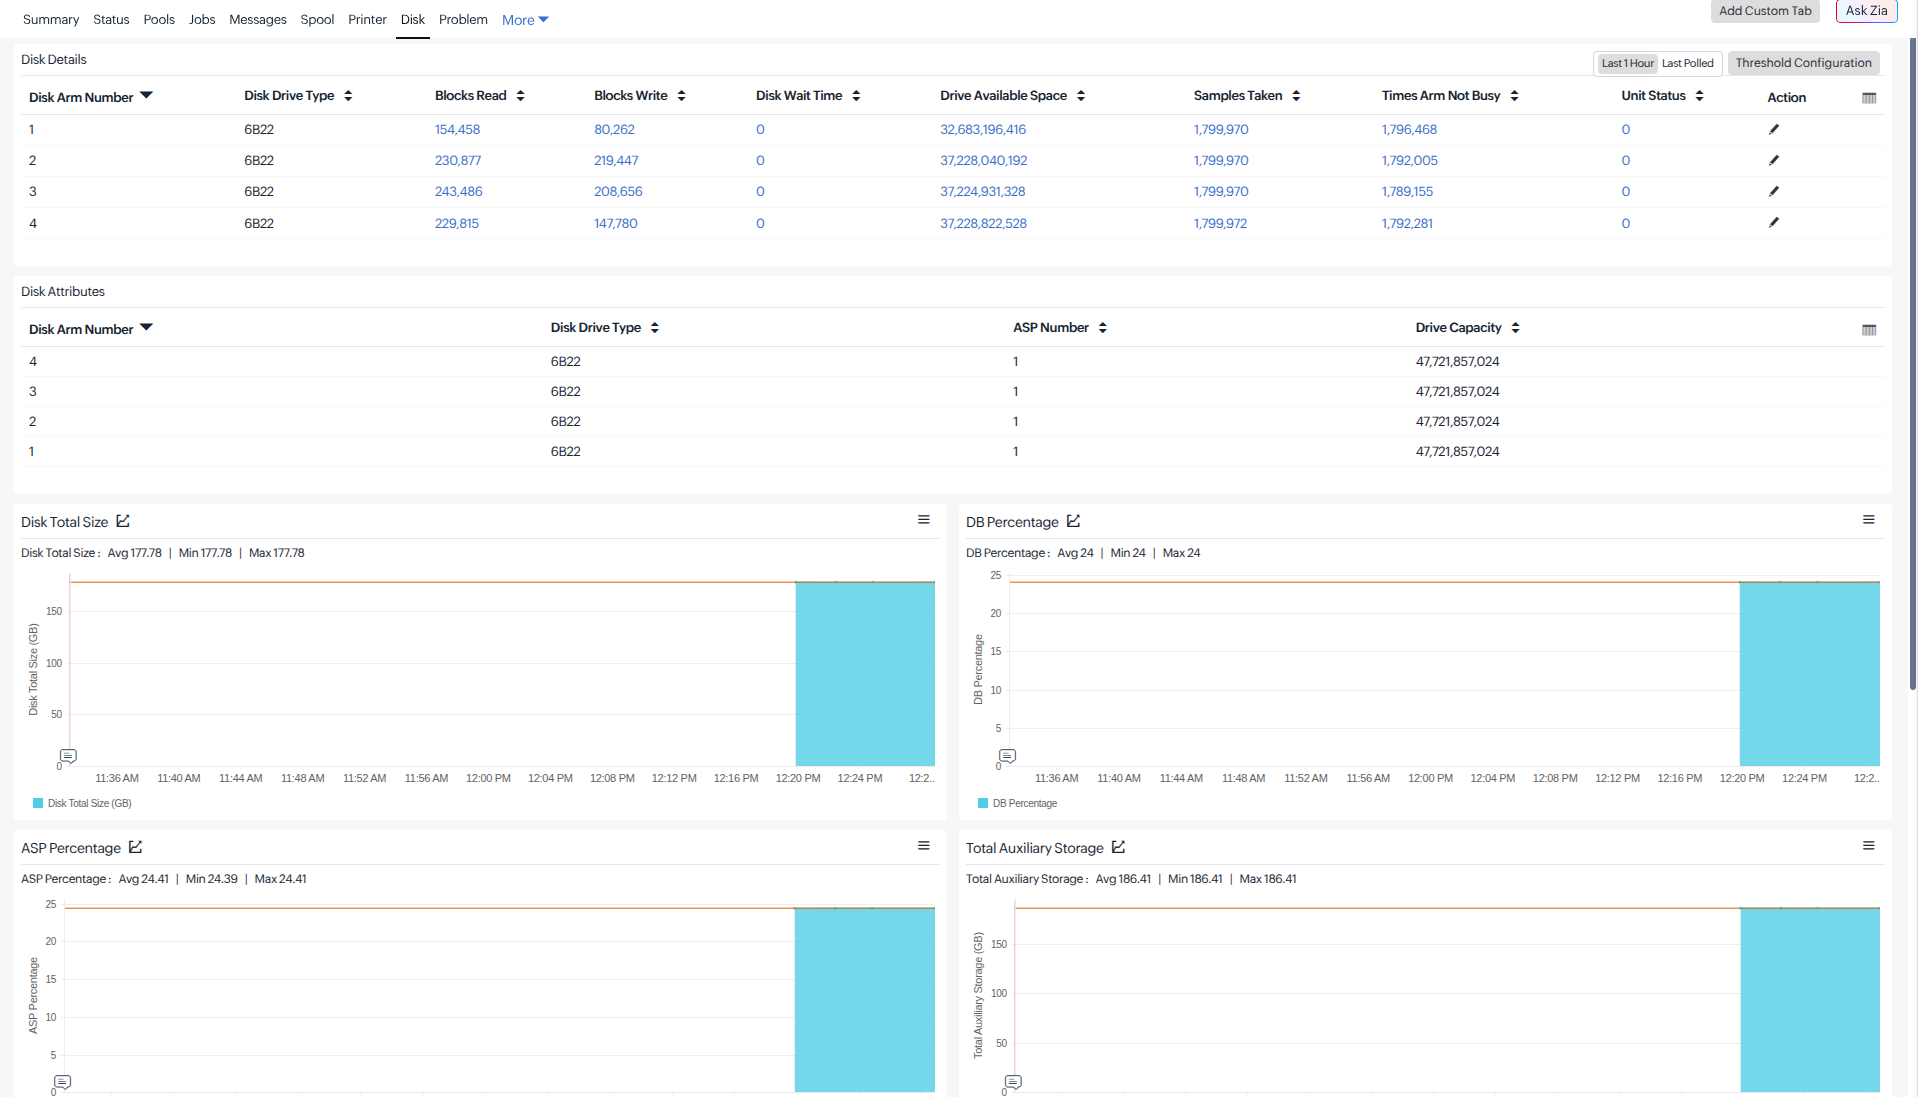
Disk Details:
Metrics are collected per physical disk arm.
| Metric | Unit | Description |
|---|---|---|
| Disk Arm Number | — | Identifier for the disk arm. |
| Disk Drive Type | — | Type of disk drive (for example, SSD, HDD). |
| Blocks Read | Count | Number of disk blocks read in the collection interval. |
| Blocks Write | Count | Number of disk blocks written in the collection interval. |
| Disk Wait Time | ms | Time spent waiting for disk I/O operations to complete. |
| Drive Available Space | Bytes | Free space available on the drive. |
| Samples Taken | Count | Number of performance samples collected for this disk arm. |
| Times Arm Not Busy | Count | Number of sample intervals where the disk arm was idle. |
| Unit Status | — | Operational status of the disk unit (for example, Active, Failed, Locked, Damaged). |
| Drive Capacity | Bytes | Total capacity of the drive. |
| ASP Number | — | The ASP this disk arm belongs to. |
Summary charts:
| Metric | Unit | Description |
|---|---|---|
| Disk Total Size | MB | Total disk size across all disk arms. |
| DB Percentage | % | Percentage of the database portion of ASP used. |
| ASP Percentage | % | Percentage of the system ASP used. |
| Total Auxiliary Storage | MB | Total auxiliary (disk) storage on the system. |
| Disk Blocks Read vs Write | — | Comparative chart of disk read and write block activity. |
| Disk Blocks Read (Stacked) | — | Stacked chart of disk read activity per disk arm. |
| Storage Capacity | — | Pie chart showing overall storage capacity and usage (DB Total, DB Free, Unprotected Used). |
Problem tab
This tab displays open hardware and software problems on the IBM i server, including their severity, status, age, and lifecycle details.
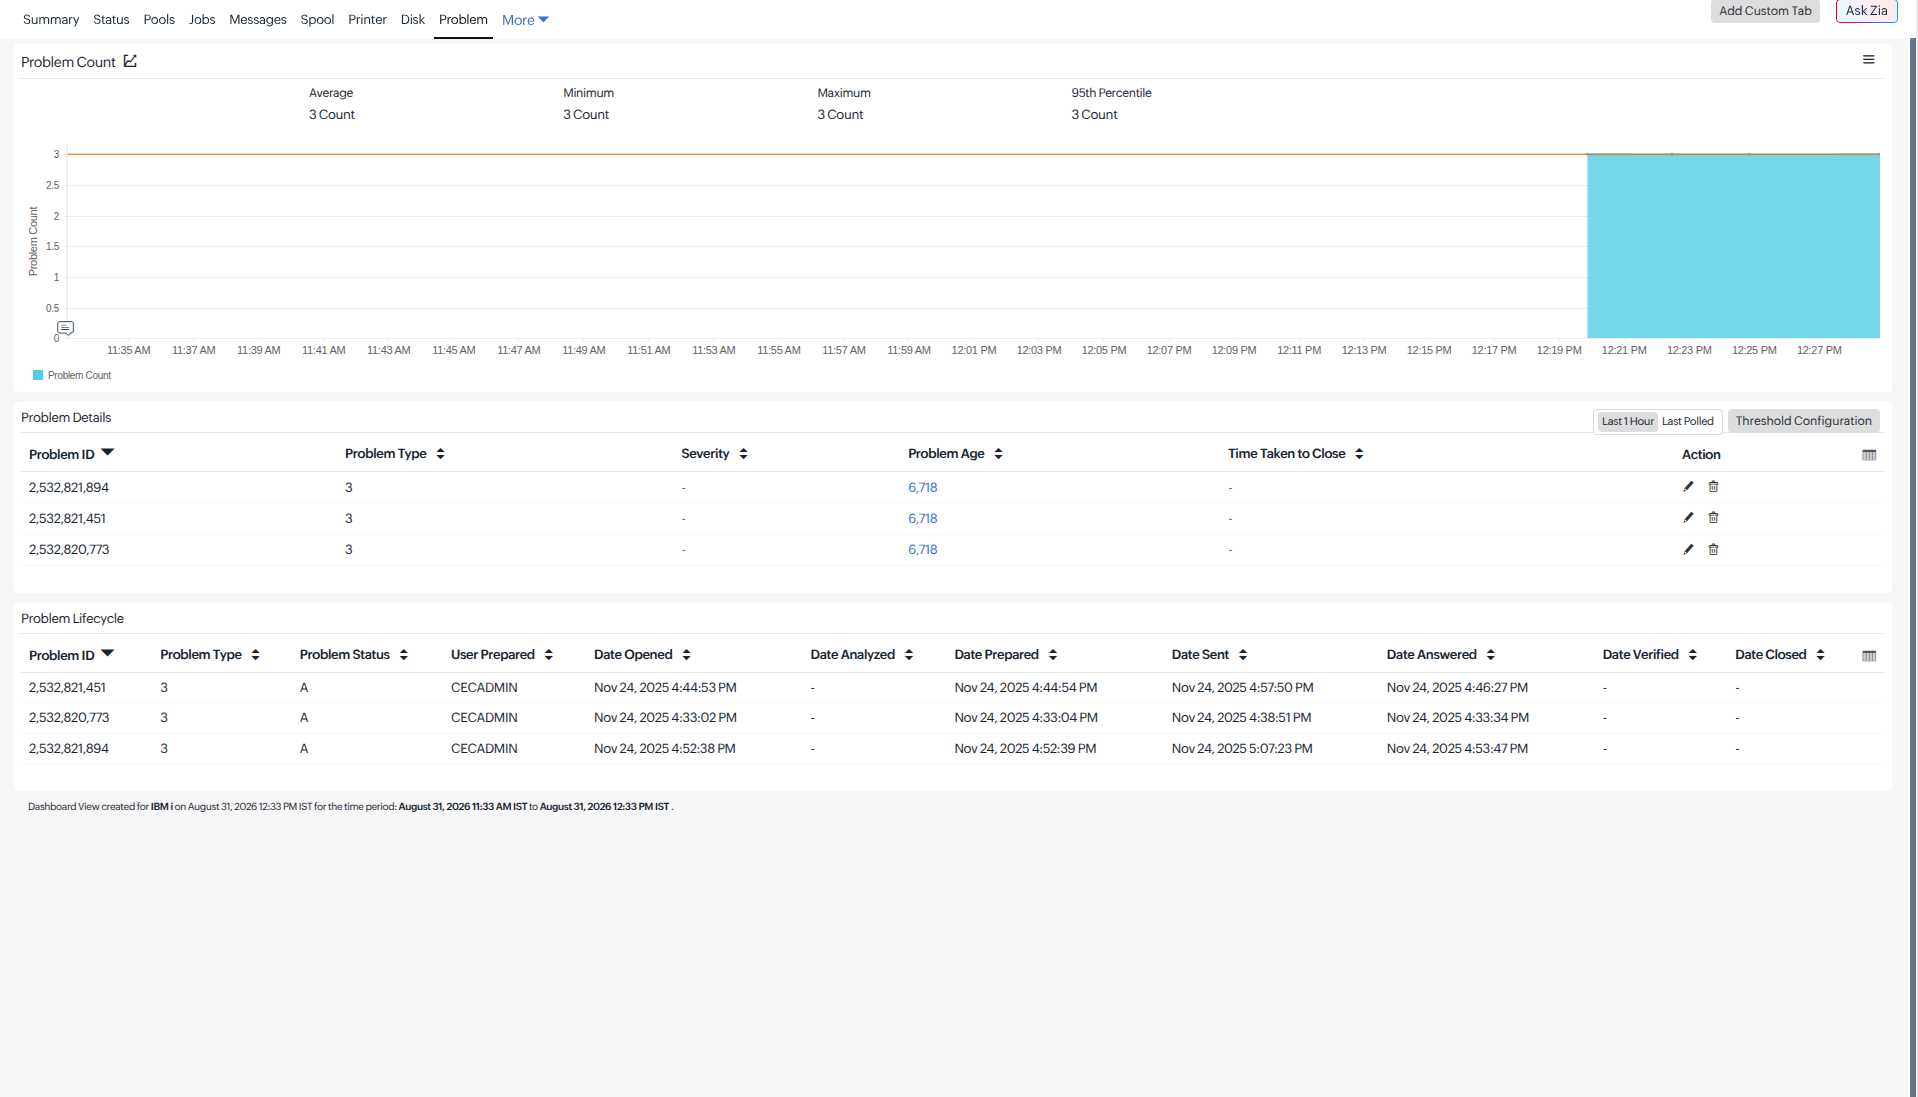
| Metric | Unit | Description |
|---|---|---|
| Problem Count | Count | Total number of open hardware/software problems on the system. |
Problem Details:
| Column | Unit | Description |
|---|---|---|
| Problem ID | — | Unique IBM i problem identifier. |
| Problem Type | — | Category of the problem (for example, hardware, software). |
| Severity | Count | Severity level of the problem. |
| Problem Age | Hours | How long the problem has been open. |
| Time Taken to Close | Hours | For closed problems, the time from open to close. |
| Problem Status | — | Current state (for example, Open, Analyzed, Prepared, Sent, Answered, Verified, Closed). |
| User Prepared | — | The user who prepared the problem for reporting. |
| Date Opened | Timestamp | When the problem was opened. |
| Date Analyzed | Timestamp | When the problem was analyzed. |
| Date Prepared | Timestamp | When the problem was prepared for reporting. |
| Date Sent | Timestamp | When the problem was sent to IBM. |
| Date Answered | Timestamp | When IBM provided an answer. |
| Date Verified | Timestamp | When the fix was verified. |
| Date Closed | Timestamp | When the problem was closed. |
Problem Life cycle:
| Column | Unit | Description |
|---|---|---|
| Problem ID | — | Unique IBM i problem identifier. |
| Problem Type | — | Category of the problem (for example, hardware, software). |
| Problem Status | — | Current state (for example, Open, Analyzed, Prepared, Sent, Answered, Verified, Closed). |
| User Prepared | — | The user who prepared the problem for reporting. |
| Date Opened | Timestamp | When the problem was opened. |
| Date Analyzed | Timestamp | When the problem was analyzed. |
| Date Prepared | Timestamp | When the problem was prepared for reporting. |
| Date Sent | Timestamp | When the problem was sent to IBM. |
| Date Answered | Timestamp | When IBM provided an answer. |
| Date Verified | Timestamp | When the fix was verified. |
| Date Closed | Timestamp | When the problem was closed. |
Subsystem tab
This tab displays the status and performance of monitored IBM i subsystems, including active jobs, CPU usage, threads, temporary storage, and job states.
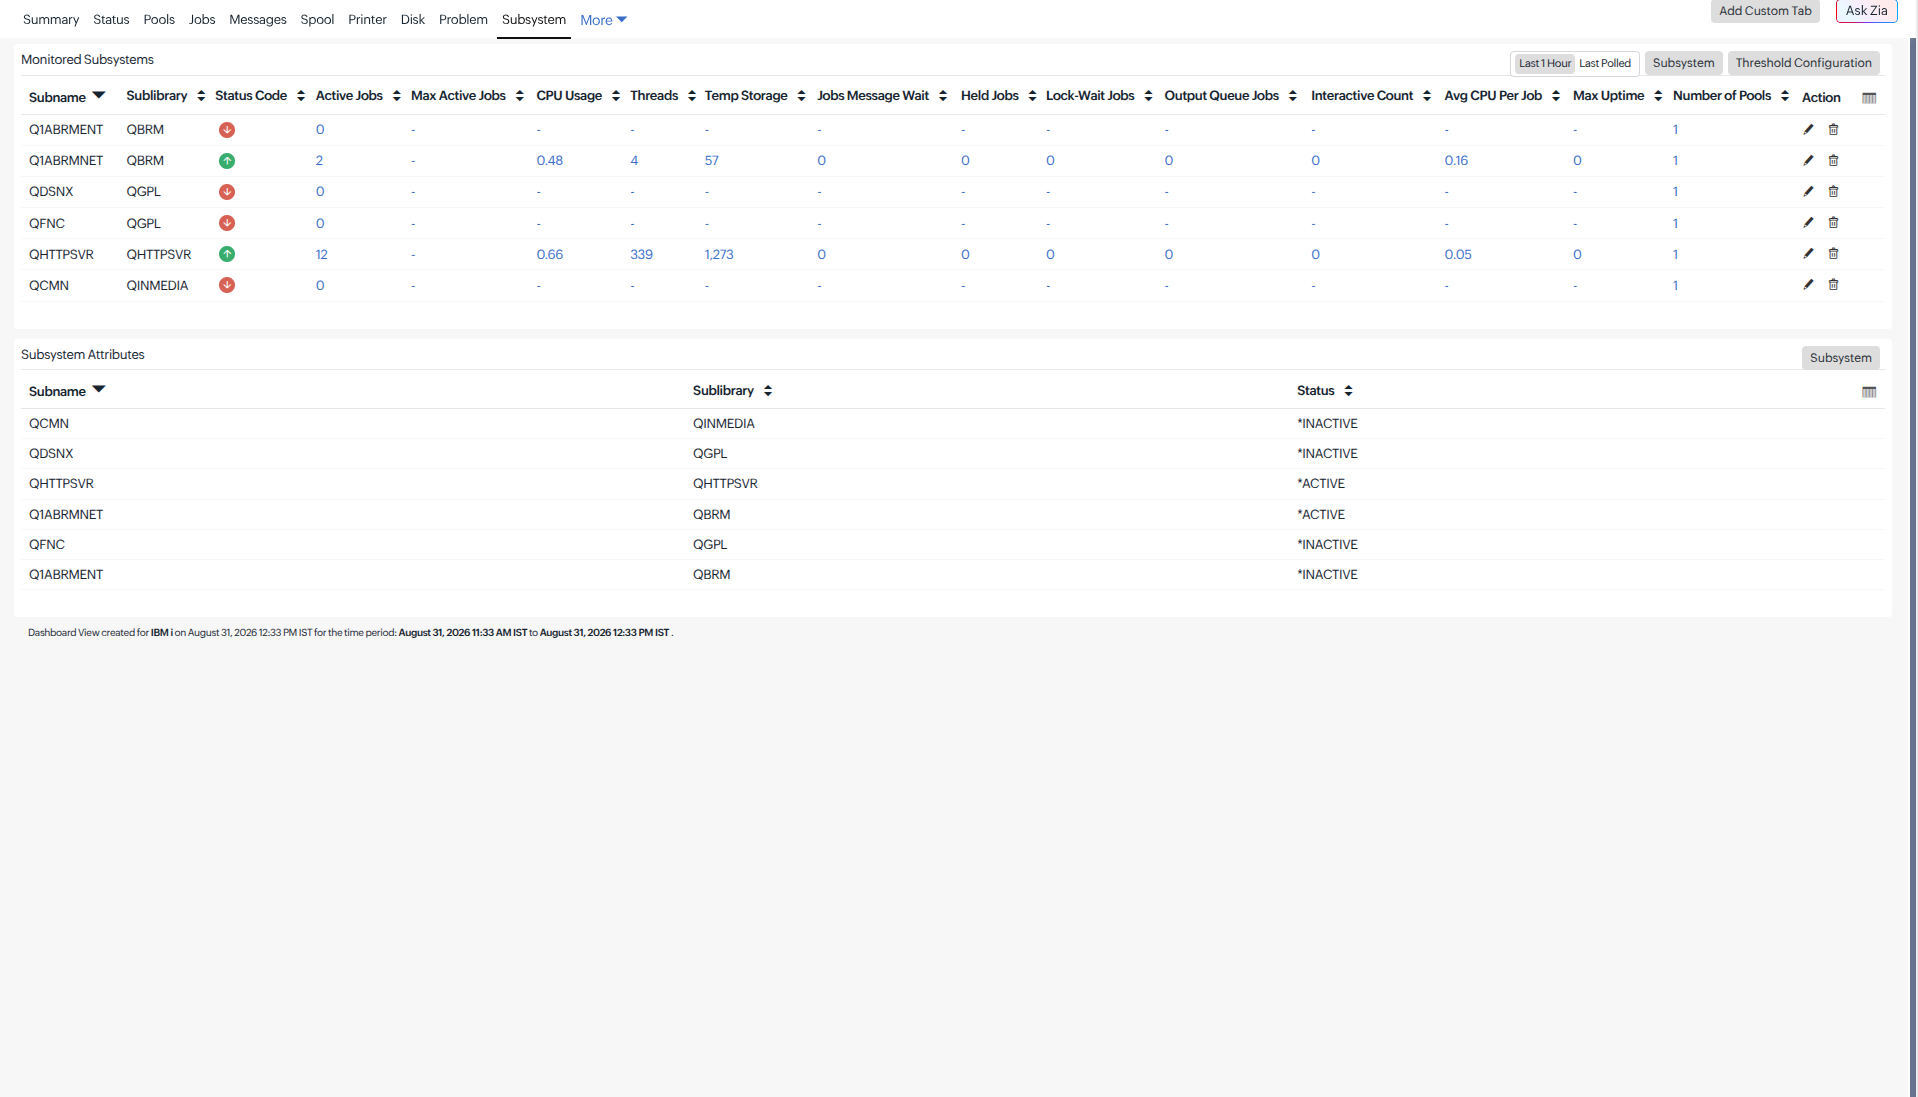
Subsystems (monitored):
Metrics are collected per configured monitored subsystem (for example, QINTER, QBATCH).
| Metric | Unit | Description |
|---|---|---|
| Status | — | Current operational status (Active / Inactive). |
| Active Jobs | Count | Number of active jobs running under this subsystem. |
| Max Active Jobs | Count | Maximum number of jobs allowed in this subsystem. |
| CPU (%) | % | Aggregate CPU usage across all jobs in this subsystem. |
| Threads | Count | Total threads across all jobs in this subsystem. |
| Temp Storage | MB | Total temporary storage used by jobs in this subsystem. |
| MSGW Jobs | Count | Jobs waiting for a message reply (MSGW). |
| Held Jobs | Count | Jobs that are held (HLD). |
| Lock Wait Jobs | Count | Jobs waiting for a lock (LCKW). |
| Output Queue Jobs | Count | Jobs with output queue activity (OUTQ). |
| Interactive Jobs | Count | Number of interactive jobs in this subsystem. |
| Avg CPU per Job (%) | % | Average CPU utilization per job. |
| Max Job Uptime | Seconds | Uptime of the longest-running job in this subsystem. |
| Number of Pools | Count | Number of memory pools associated with this subsystem. |
Queues tab
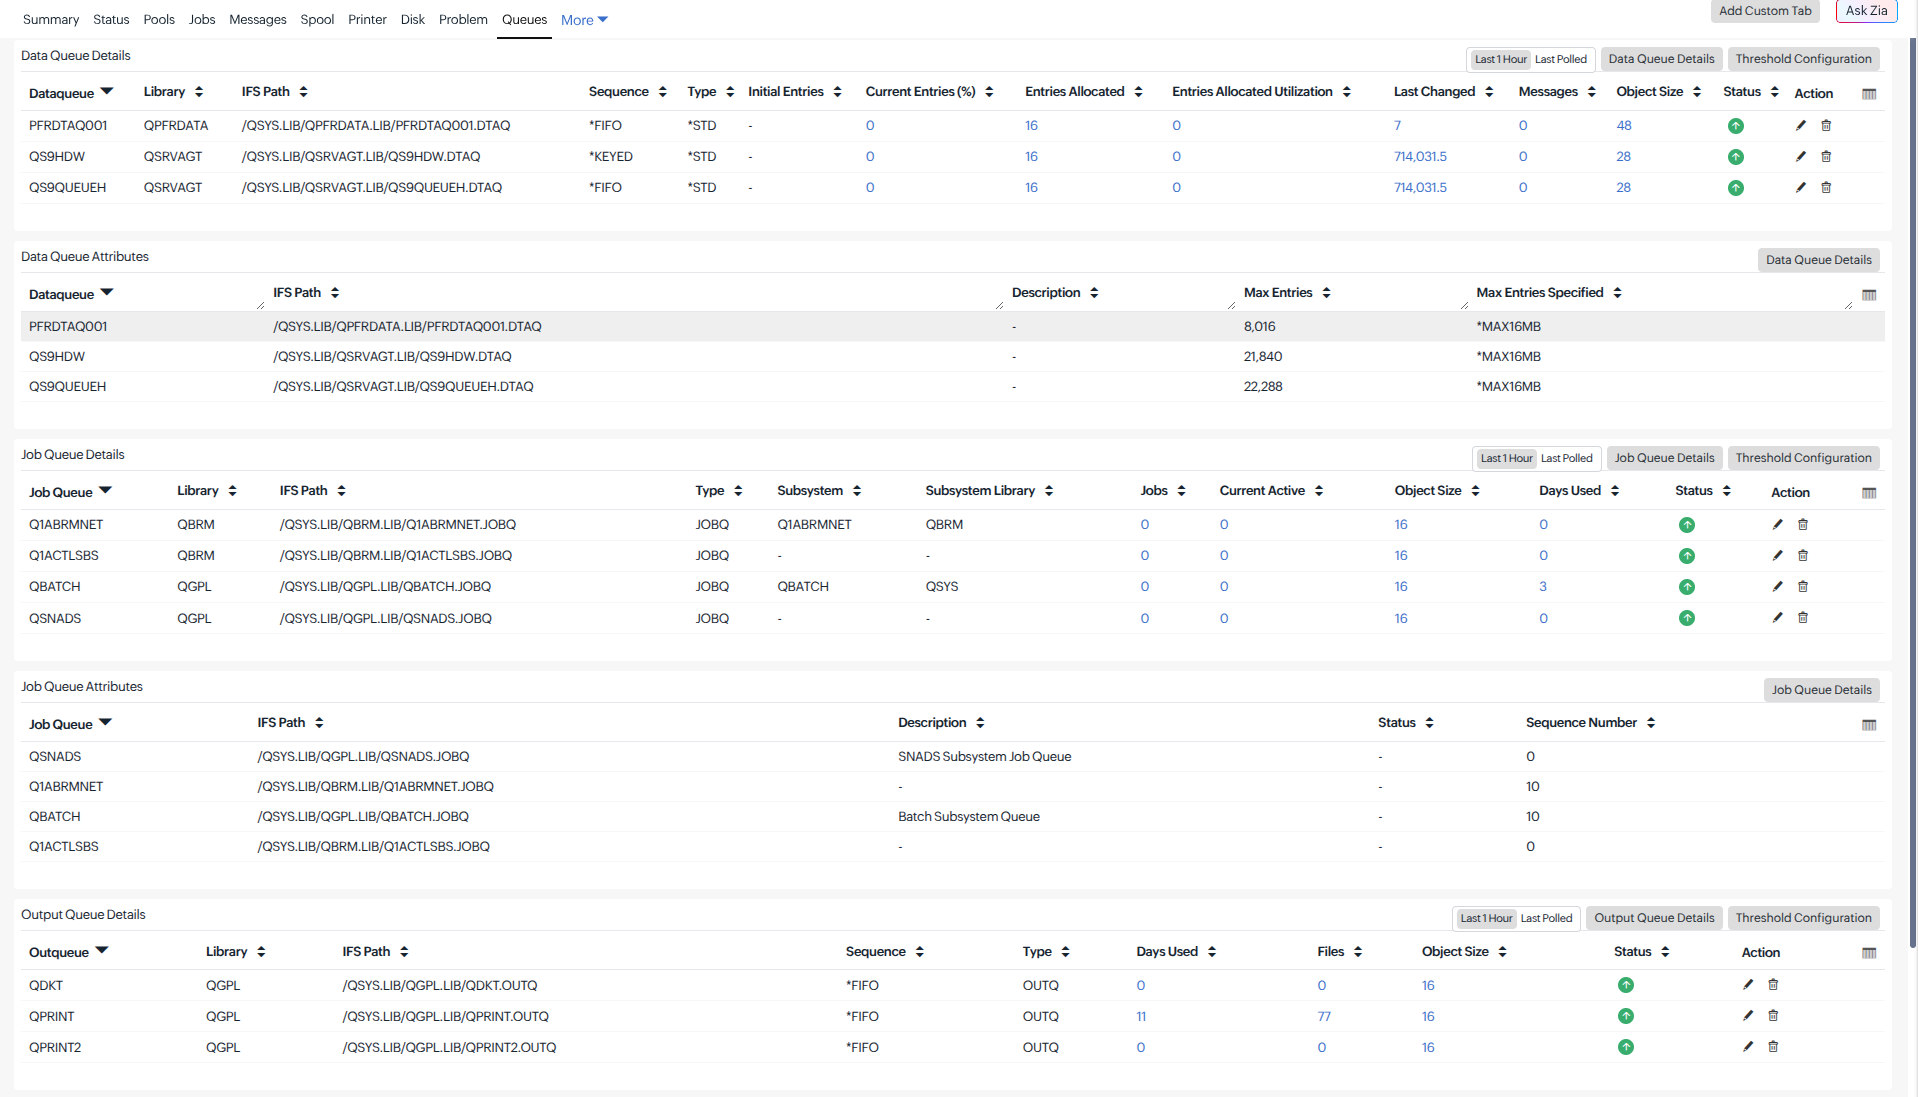
Metrics per configured monitored data queue:
| Metric | Unit | Description |
|---|---|---|
| Data Queue | — | Name of the data queue. |
| Library | — | Library the data queue resides in. |
| IFS Path | — | Full IFS path of the data queue object. |
| Type | — | Type of data queue (for example, DTAQ, DDMQ). |
| Sequence | — | Keyed or FIFO sequence type. |
| Initial Entries | Count | Initial number of entries configured at creation. |
| Current Entries (%) | % | Current entries as a percentage of the maximum configured entries. |
| Entries Allocated | Count | Number of entries currently allocated. |
| Entries Allocated Utilization (%) | % | Percentage of allocated capacity in use. |
| Last Changed | Minutes | Time since the data queue was last modified. |
| Status | — | Current operational status of the data queue. |
| Messages | Count | Current number of messages (entries) in the data queue. |
| Object Size | KB | On-disk size of the data queue object. |
| Status | — | Current operational status of the data queue. |
| Max Entries | Count | Maximum number of entries the queue can hold. |
| Max Entries Specified | — | Whether a maximum entry count was explicitly configured. |
| Description | — | Text description of the data queue object. |
Job queues (monitored):
Metrics per configured monitored job queue:
| Metric | Unit | Description |
|---|---|---|
| Job Queue | — | Name of the job queue. |
| Library | — | Library the job queue resides in. |
| IFS Path | — | Full IFS path of the job queue object. |
| Type | — | Type of the job queue object. |
| Subsystem | — | Subsystem the job queue is assigned to. |
| Subsystem Library | — | Library of the assigned subsystem. |
| Status | — | Current operational status (for example, Released, Held). |
| Jobs | Count | Total number of jobs currently in this job queue. |
| Current Active | Count | Number of jobs from this queue that are currently active. |
| Object Size | KB | On-disk size of the job queue object. |
| Days Used | Days | Number of days this job queue has been in use. |
| Sequence Number | — | Priority sequence number of this queue within its subsystem. |
| Description | — | Text description of the job queue object. |
Output queues (monitored):
Metrics per configured monitored output queue:
| Metric | Unit | Description |
|---|---|---|
| Output Queue | — | Name of the output queue. |
| Library | — | Library the output queue resides in. |
| IFS Path | — | Full IFS path of the output queue object. |
| Type | — | Type of the output queue object. |
| Sequence | — | Sequence identifier for the output queue. |
| Status | — | Current operational status of the output queue. |
| Files | Count | Number of spooled files currently in this output queue. |
| Object Size | KB | On-disk size of the output queue object. |
| Days Used | Days | Number of days this output queue has been in use. |
| Writer | — | Name of the writer currently serving this output queue. |
| Writer Status | — | Status of the writer (for example, Started, Held, Ended). |
| Printer | — | Name of the printer device associated with this output queue. |
| Description | — | Text description of the output queue object. |
Other common tabs
- Outages tab: View the monitor’s Down, Trouble, and Critical history, including the outage period, duration, reason, and latest comment. You can also add an outage.
- Notes tab: Add and view notes for the monitor. This tab also displays key inventory and configuration details.
- Log Report tab: View data collection records for the selected period, including the collection time, polling location, monitor status, and captured IBM i metrics.
- Alert Logs tab: View and search alert logs associated with the IBM i monitor for the selected time range.
- Audit Logs tab: View and search audit activities associated with the monitor, with an option to include related audit activities.
Other enterprise application servers
Explore monitoring support for other enterprise application servers available in Site24x7:
IBM WebSphere | JBoss | GlassFish | SAP ABAP