Threshold Configuration for Network Attributes
After adding a network monitor, you can track the performance metrics of critical network devices, such as routers, switches, and firewalls, using SNMP, and visualize, monitor, optimize, and manage the network devices and interfaces.
A Threshold and Availability Profile for a network device helps the alarms engine send alerts when the resource is in a Critical, Down, or Trouble state. The alert occurs on any breach of predefined conditions that you set. Additionally, you can also configure thresholds for the following:
Threshold configuration for network interfaces
- Log in to your Site24x7 account.
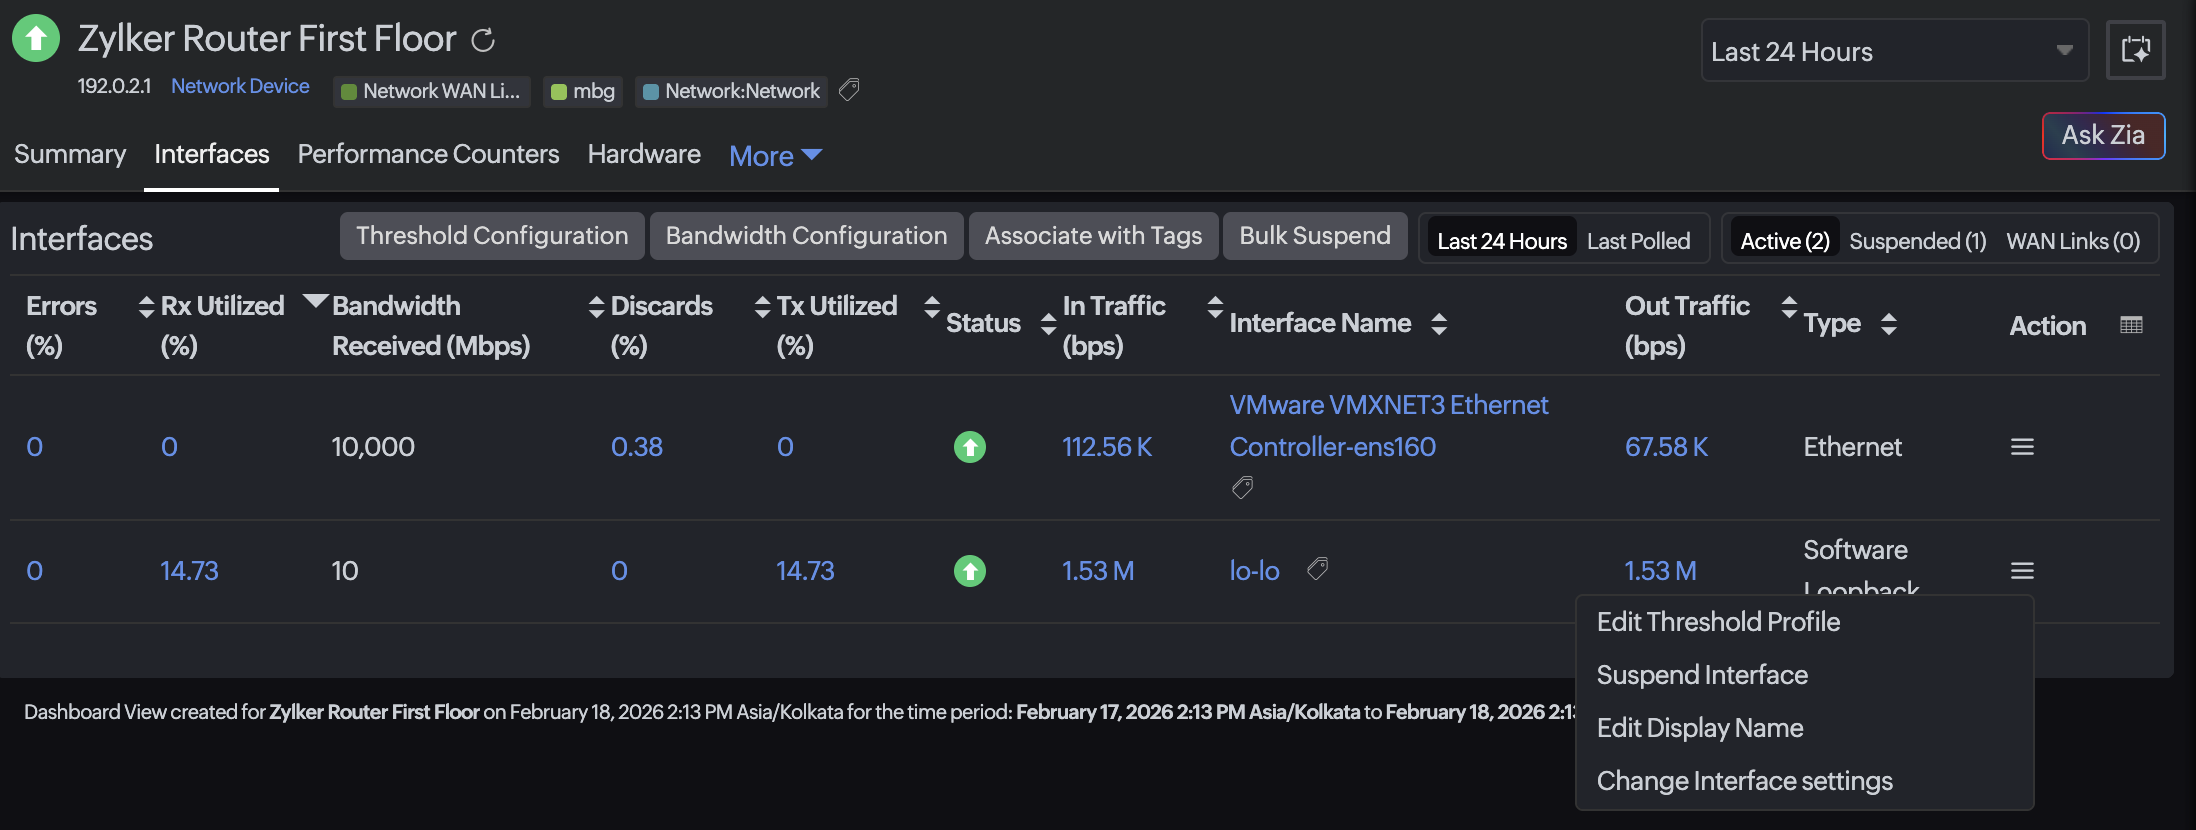
- Navigate to Network > Network Devices > select a network device > click the Interfaces tab.
- Click the hamburger
 icon corresponding to the interface that requires threshold configuration updates.
 - Click Edit Threshold Profile.

Figure 1. Select Edit Threshold Profile. - Fill in the following fields in the Edit Threshold Profile pop-up. You can set the condition as Critical or Trouble, based on which you'll receive alerts for the configured thresholds.
- Skip Alert: The default selection is No, so you will receive alerts when the threshold value is breached. Toggle to Yes if you wish to skip the alerts.
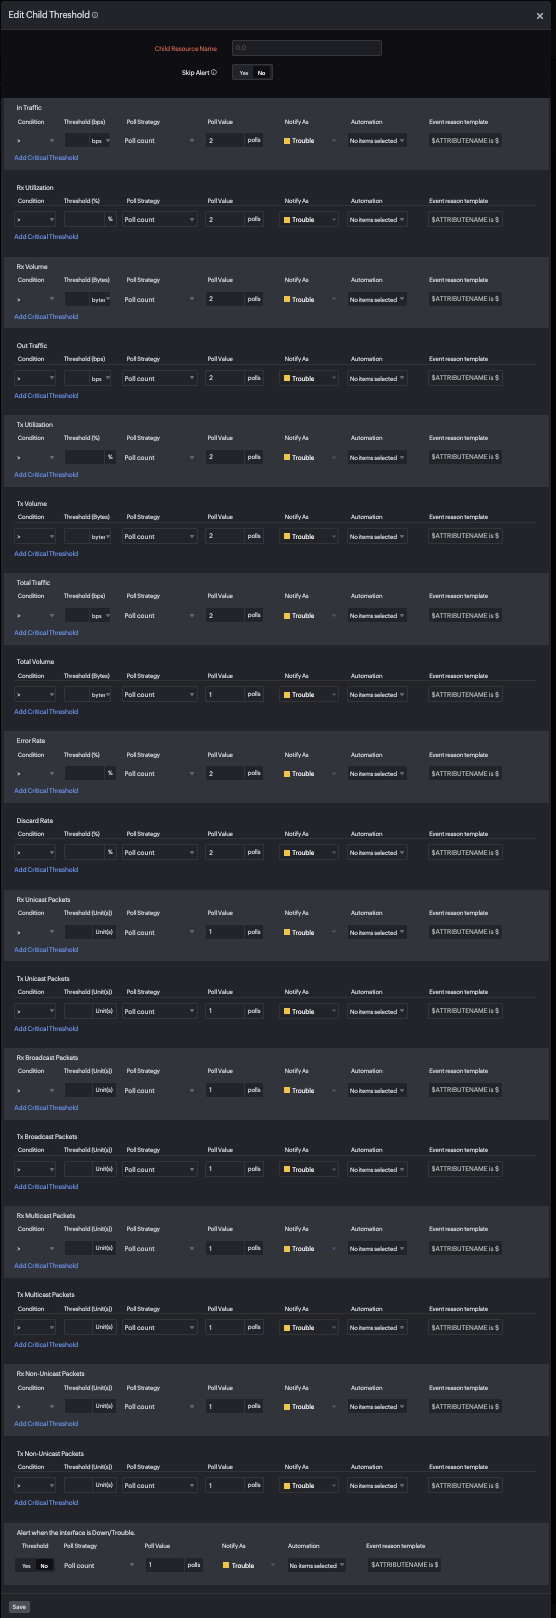
- Configure thresholds for the following attributes based on conditions (>,<,=, ≠,>= or <= the value), and be notified when they're breached.
- In Traffic: Value in bps, Kbps, Mbps, Gbps, or Tbps
- Rx Utilization: Value in %
- Rx Volume: Value in bytes, KB, MB, GB, or TB
- Out Traffic: Value in bps, Kbps, Mbps, Gbps, or Tbps
- Tx Utilization: Value in %
- Tx Volume: Value in bytes, KB, MB, GB, or TB
- Total Traffic: Value in bps, Kbps, Mbps, Gbps, or Tbps
- Total Volume: Value in bytes, KB, MB, GB, or TB
- Error Rate: Value in %
- Discard Rate: Value in %
- Rx Unicast Packets: Value in Unit(s)
- Tx Unicast Packets: Value in Unit(s)
- Rx Broadcast Packets: Value in Unit(s)
- Tx Broadcast Packets: Value in Unit(s)
- Rx Multicast Packets: Value in Unit(s)
- Tx Multicast Packets: Value in Unit(s)
- Rx Non-Unicast Packets: Value in Unit(s)
- Tx Non-Unicast Packets: Value in Unit(s)
NoteYou can set two threshold conditions for each of the above parameters: one for a Trouble alert and another for a Critical alert.- Alert when the interface is Down/Trouble: The default selection is No. Select Yes if you wish to change the device status to Trouble or Critical when the interface status changes to Down/Trouble.
NoteYou'll only receive alerts if you select Yes. Alternatively, you can set this value in the Threshold Profile of the device. For this, navigate to Network > Network Devices > select a device. Navigate to the Inventory tab. Click the pencil
 icon beside Threshold and Availability and toggle to Yes for the Mark the device as Trouble when an interface is Down/Trouble field. You can also select this option in Admin > Configuration Profiles > Threshold and Availability. Click the profile you'd like to edit on this page, and then toggle to Yes in the Mark the device as Trouble when an interface is Down/Trouble field.
Figure 2. Setting threshold parameters
for interfaces
- Click Save.
Bulk updating threshold configurations for network interfaces
- Navigate to Network > Network Devices > select a network device > click the Interfaces tab.
- Click the Threshold Configuration button.
- Click the drop-down menu corresponding to Child Monitors in the Bulk Edit Threshold pop-up.
- Select the desired interfaces for which you wish to update the thresholds in bulk.
- Follow step 5 (as above) to fill in the required fields.

Figure 3. Bulk update of threshold
parameters for interfaces. - Click Save.
Threshold configuration for performance counters
- Navigate to Network > Network Devices.
- Click the respective device name.
- Navigate to the Performance Counters tab on the device dashboard.
- Hover over the performance counter that requires threshold configuration updates.
- Click the Edit Threshold Button below the value of the performance counter.

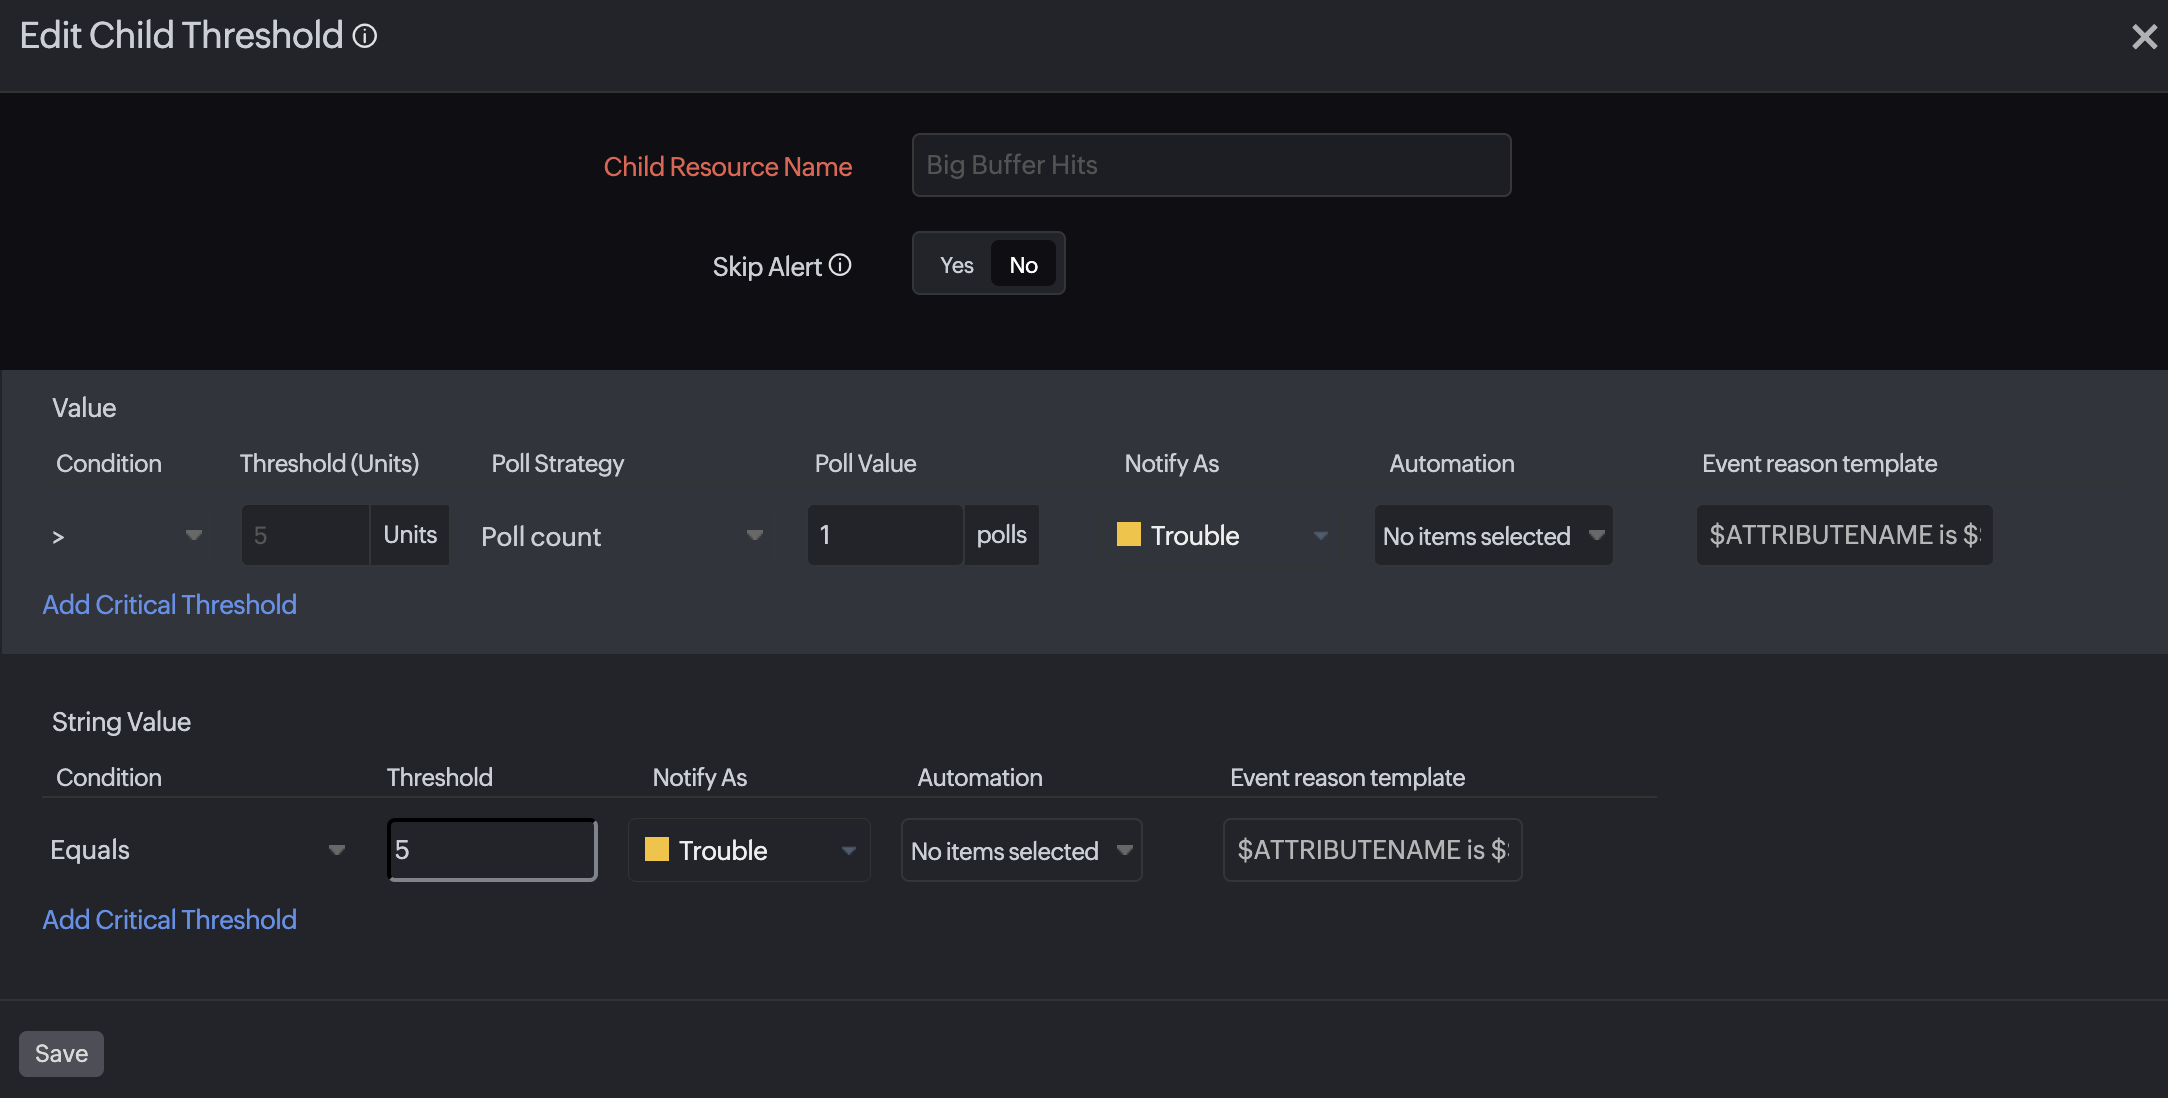
Figure 4. Edit thresholds for performance counters. - Fill in the following fields in the Edit Threshold pop-up. You can set the condition as Critical or Trouble based on which you'll receive alerts for the configured thresholds.
- Skip Alert: The default selection is No, so you will receive alerts when the threshold value is breached. Select Yes if you wish to skip the alerts.
- Value: Configure thresholds based on conditions (>,<,=, ≠,>= or <= the value), and be notified when they're breached

Figure 5. The Edit Threshold pop-up for performance counters.
- Click Save.
Bulk updating threshold configurations for performance counters
- Navigate to Network > Network Devices.
- Click the respective device name.
- Navigate to the Performance Counters tab on the device dashboard.
- Click the Threshold Configuration button.
- Click the drop-down menu corresponding to Child Monitors in the Bulk Edit Threshold pop-up,
- Select the desired performance counters for which you wish to update the threshold conditions in bulk.
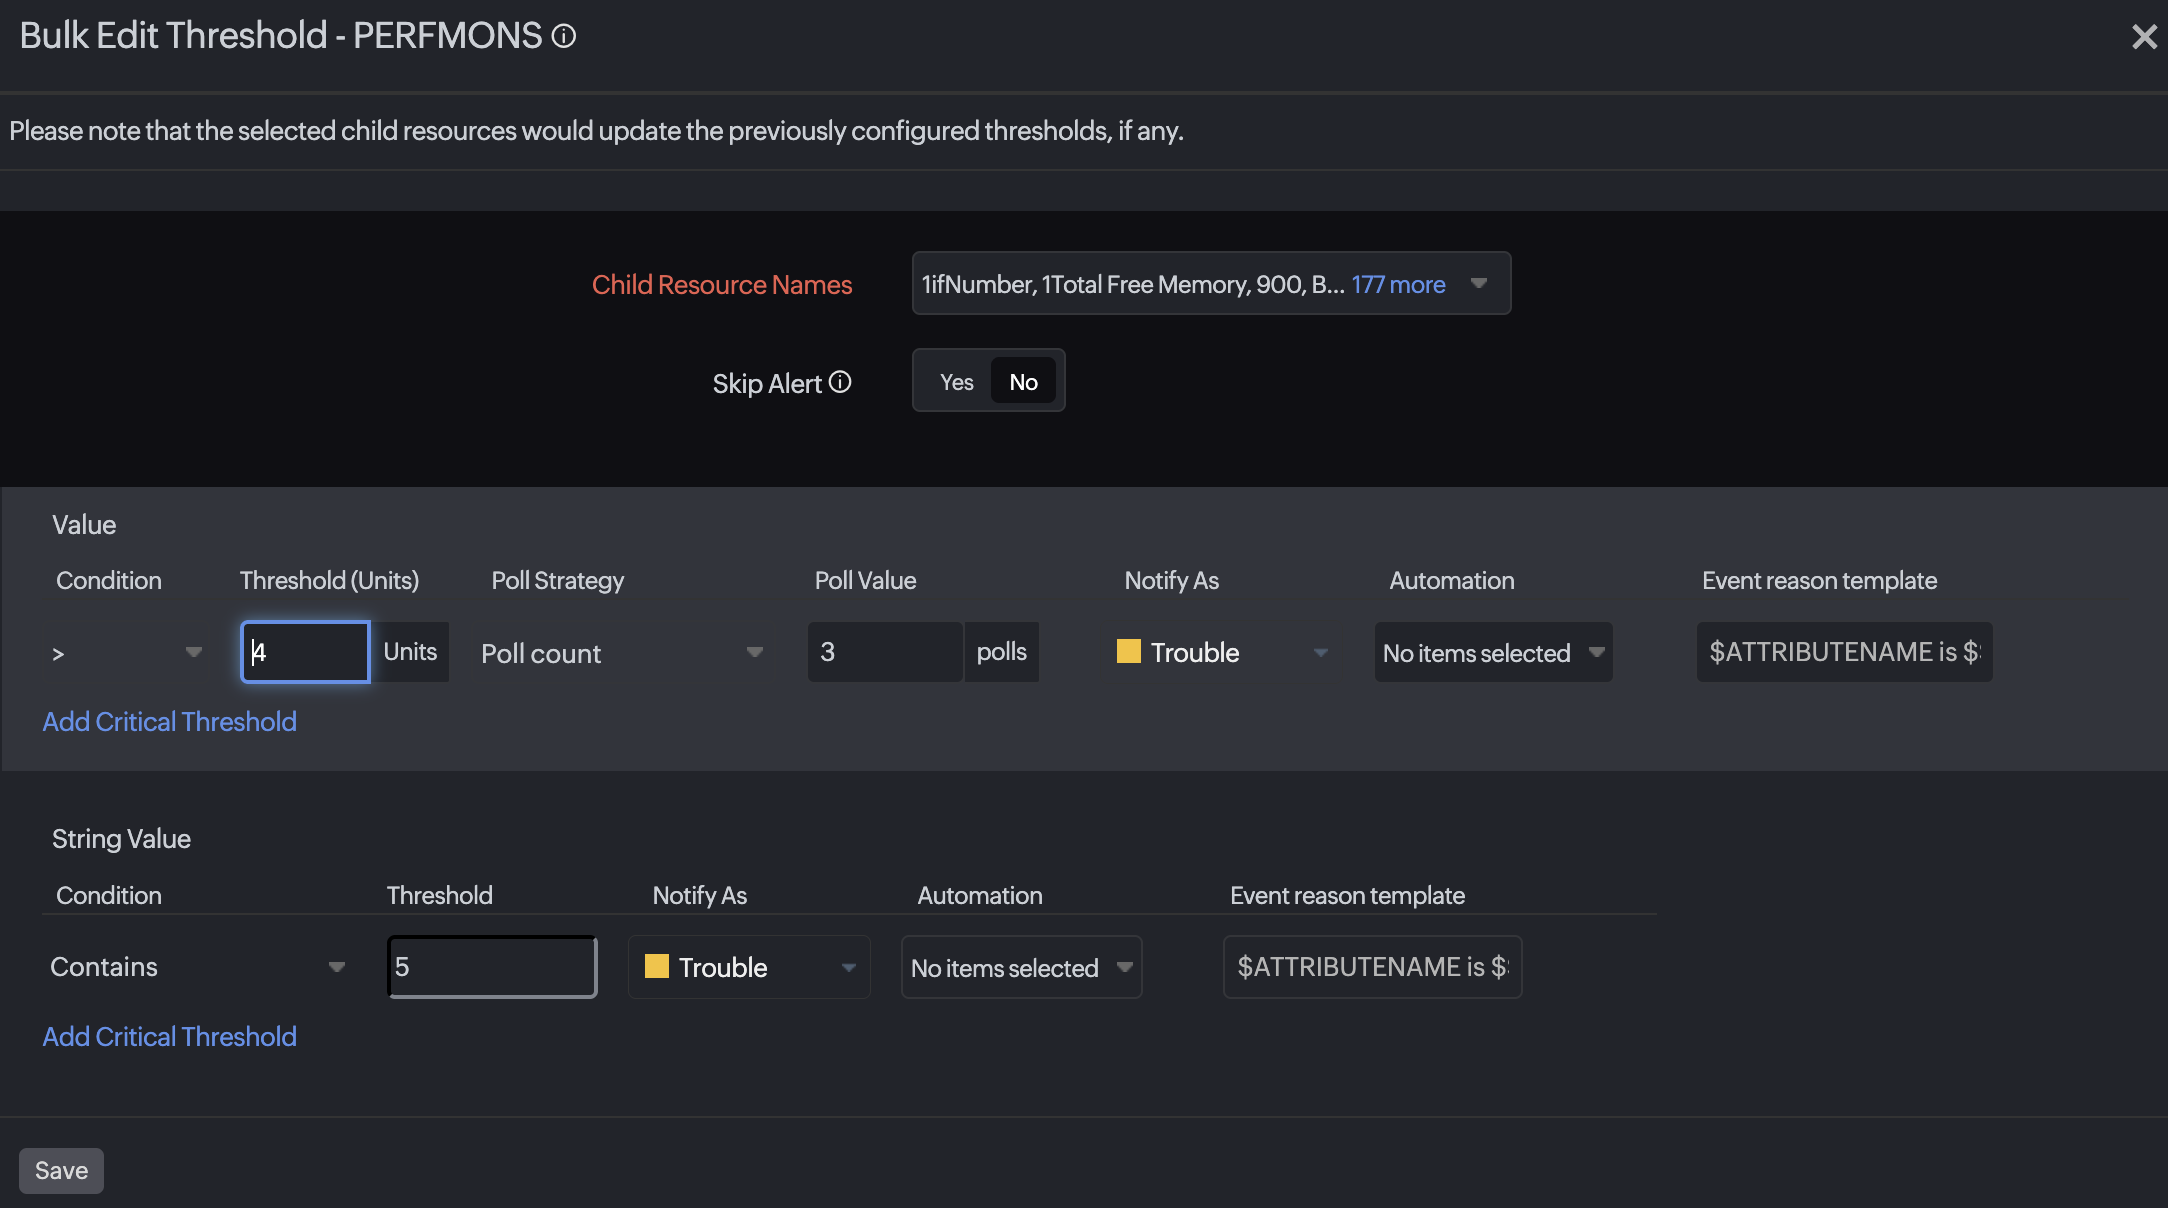
- Fill in the following fields in the Bulk Edit Threshold pop-up. You can set the condition as Critical or Trouble, based on which you'll receive alerts for the configured thresholds.
- Skip Alert: The default selection is No, so you will receive alerts when the threshold value is breached. Select Yes if you wish to skip the alerts.
- Value: Configure thresholds based on conditions (>,<,=, ≠,>= or <= the value), and be notified when they're breached.
- String Value: Configure thresholds for performance counters with string values based on conditions (Equals, Not Equals, Contains, or Doesn't Contain the value you specify).
- Click Save.

Figure 6. The Bulk Edit Threshold pop-up for performance counters.
Related Articles
