Health Check for Monitor Groups and Subgroups
Site24x7's Health Check feature assess the availability and health of the Monitor Group or Subgroup and is used to identify any issues or potential problems that could affect the particular operation or workload of the Monitor Group. You can also choose to receive alerts and stay updated on your monitor group's health status.

Use case
The Health Check feature monitors and tracks the overall health and availability of your Monitor Groups and Subgroups.
When you group multiple resources performing one business application in a Monitor Group, monitoring each resource separately and compiling availability data is demanding. Site24x7's Health Check helps you view and analyze the status of each monitor along with its availability, so that you can keep your monitors managed.
Benefits of Health Check
You can leverage these benefits by configuring Health Check for your Monitor Groups or Subgroups:
- View, and track the status and outages of individual monitors in Monitor Groups.
- Gain insights on monitors that frequently experience status changes and analyze the issue.
- Configure thresholds and receive alerts whenever a monitor, or a set of monitors, has status changes.
- Easily identify the monitor in Trouble, Down, or Critical status, and rectify the issue with the help of a detailed root cause analysis (RCA).
- Track the availability of your resources and analyze the resource health.
- Customize the status of the Monitor Group or Subgroup, based on the health check threshold profile.
Supported Health Check metrics
| Metric name | Description | Unit |
|---|---|---|
| Number of Available Monitors | The number of available monitors. | Count |
| Total Number of Monitors | The total number of monitors. | Count |
| Number of Monitors Added | The number of monitors added. | Count |
| Number of Monitors Removed | The number of monitors removed. | Count |
| Availability Percentage | The monitor availability percentage. | Percentage |
| Percentage of Down Monitors | The percentage of monitors in Down status. | Percentage |
| Percentage of Critical Monitors | The percentage of monitors in Critical status. | Percentage |
| Percentage of Trouble Monitors | The percentage of monitors in Trouble status. | Percentage |
| Percentage of Monitors Under Maintenance | The percentage of monitors under maintenance. | Percentage |
| Percentage of Suspended Monitors | The percentage of monitors in Suspended status. | Percentage |
| Percentage of Available Monitors | The percentage of monitors in Available status. | Percentage |
| Total Downtime | The total downtime of the monitor. | Minutes |
| Minimum Downtime | The minimum downtime of the monitor. | Minutes |
| Maximum Downtime | The maximum downtime of the monitor. | Minutes |
| Average Downtime | The average downtime of the monitor. | Minutes |
| Down Events | The number of down events. | Events |
| Trouble Events | The number of trouble events. | Events |
| Critical Events | The number of critical events. | Events |
| Maintenance Events | The number of maintenance events. | Events |
| Suspended Events | The number of suspended events. | Events |
Supported Subgroups metrics
| Metric name | Description | Unit |
|---|---|---|
| Number of Down Subgroups | The number of subgroups in Down status. | Count |
| Number of Critical Subgroups | The number of subgroups in Critical status. | Count |
| Number of Trouble Subgroups | The number of subgroups in Down status. | Count |
| Number of Up Subgroups | The number of subgroups in Up status. | Count |
Threshold configuration
To configure thresholds for your Monitor Groups:
- Log in to your Site24x7 account and navigate to Monitor Groups.
- Select the Monitor Group.
- Click Edit.
- Under the Health Check Configuration section, click the + icon next to the Health Check Profile field to add a threshold profile.
 Note
Note- To edit the threshold profile, click the pencil icon next to the Health Check Profile field.
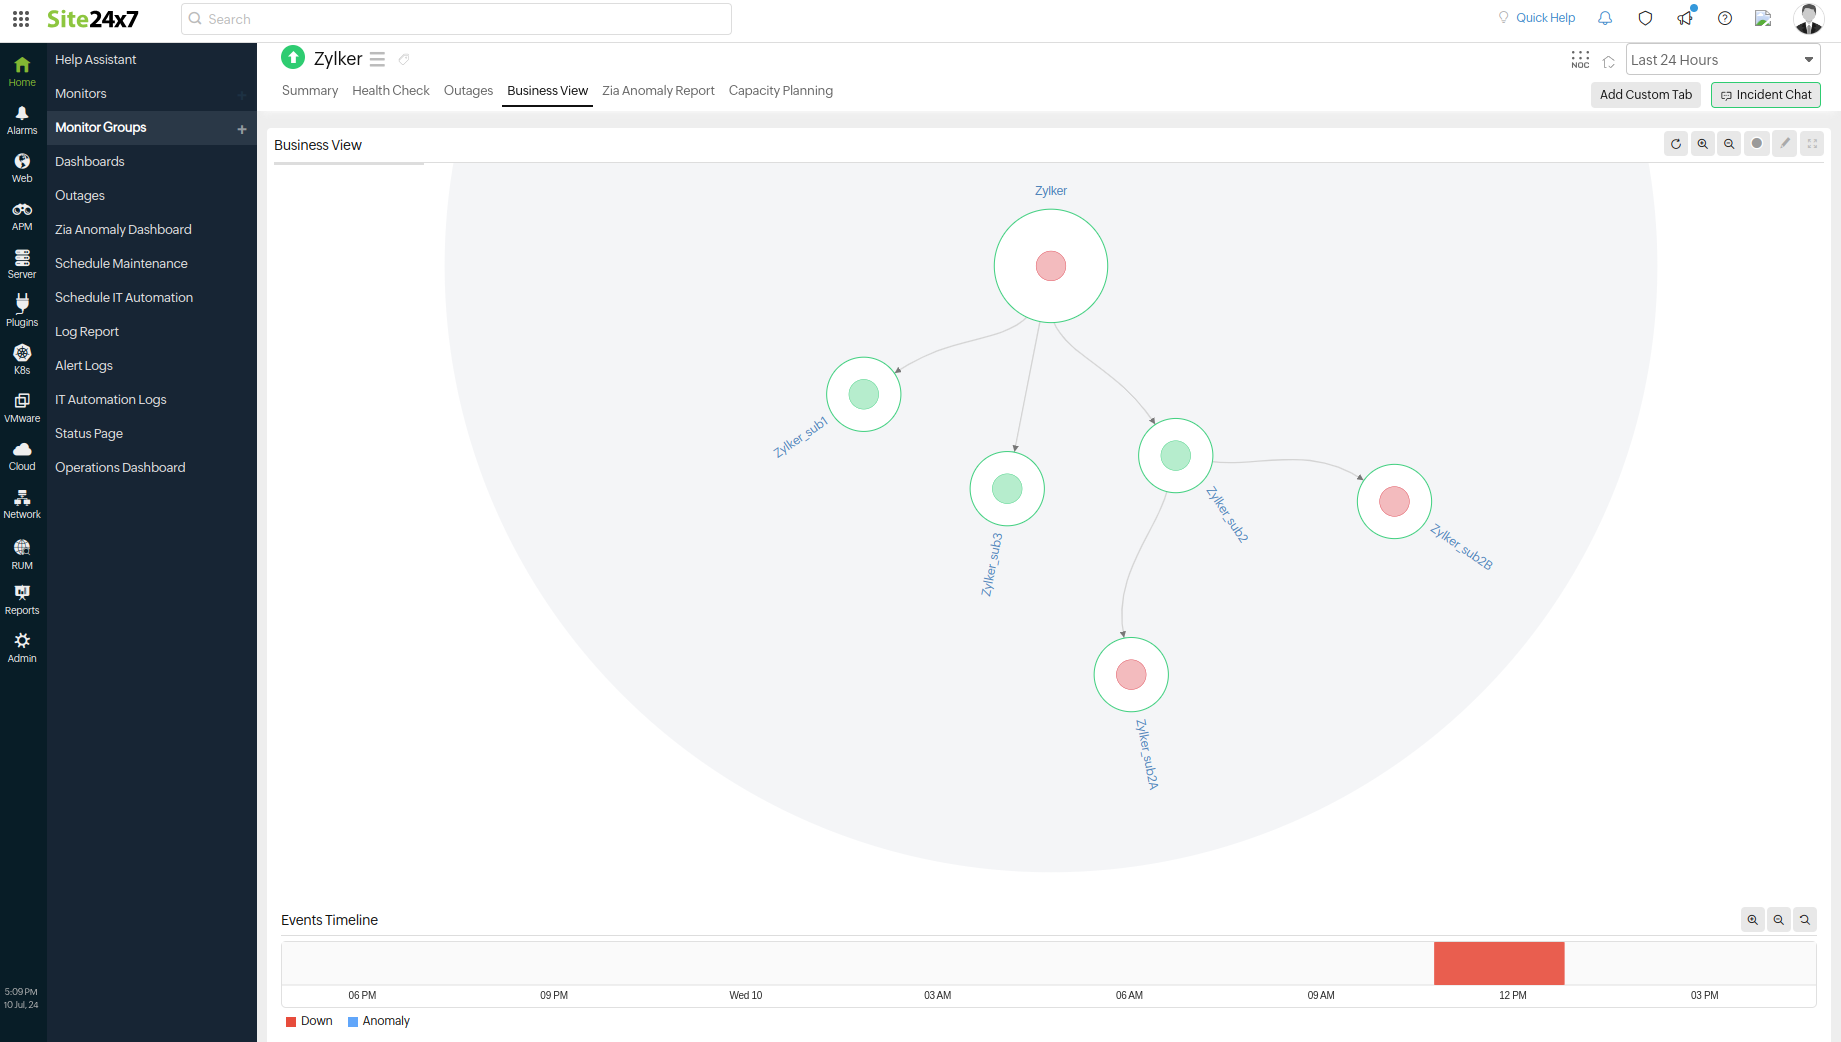
- Mute Alert for Subgroups: When you toggle this option to Yes in the Edit Health Check Profile or Add Health Check Profile page, alerts for subgroups directly under the selected monitor group will be suppressed. For example, consider the Zylker monitor group, which has three subgroups: Zylker_sub1, Zylker_sub2, and Zylker_sub3. Additionally, Zylker_sub2 has two subgroups: Zylker_sub2A and Zylker_sub2B.
If you mute alerts for the Zylker monitor group, alerts for Zylker_sub1, Zylker_sub2, and Zylker_sub3 subgroups will be suppressed because they fall directly under the Zylker monitor group. Zylker_sub2A and Zylker_sub2B will be unaffected because they don't fall directly under the Zylker monitor group.
If you mute alerts only for Zylker_sub2, alerts for Zylker_sub2A and Zylker_sub2B subgroups will be suppressed. The rest of the Zylker monitor group, including Zylker_sub1 and Zylker_sub3 subgroups, will be unaffected.
- Select Health Check from the Monitor Type drop-down menu.
- Enter an appropriate name in the Display Name field.
- The supported metrics are displayed in the Threshold Configuration section. You can set threshold values for all the metrics mentioned above.
- Click Save.
Mute Monitor Group Health Check Alerts
Enabling this option suppresses all alerts generated by the Monitor Group Health Check. When enabled, no notifications are triggered for any status change, including alerts within Site24x7 and those sent to third party integrations. This is useful during planned maintenance, deployments, or configuration testing where temporary state changes are expected and do not require attention. It can also be used for non production environments or known issues where alert noise needs to be minimized.
Mute Third Party Integration Alerts
Enabling this option suppresses only the alerts sent to external integrations such as ticketing or incident management tools, while retaining alerts within Site24x7. When enabled, status changes are still visible in the platform but are not forwarded to external systems. This is helpful when teams want to monitor issues internally without creating external tickets, avoid excessive ticket generation during frequent state changes, or validate integrations before enabling full alert routing. If Monitor Group Health Check alerts are muted, third party integration alerts are automatically suppressed.
Sync Monitor Group Status with Health Check Status
The Sync Monitor Group Status with Health Check Status option (in the Add Health Check Profile page or Edit Health Check Profile page) is set to Yes by default. When set to Yes, the Monitor Group status will display the same status as the Health Check status.
When the Sync Monitor Group Status with Health Check Status option is set to No then, the Monitor Group status will be updated based on the monitor count threshold set to decide the Monitor Group or Subgroup status. However, the Health Check status (Healthy, Critical, Down, or Trouble) is updated based on the Health Check configuration.
Notify for Count Based Thresholds
The Notify for Count Based Thresholds (in the Add Health Check Profile page or Edit Health Check Profile page) option is set to Yes by default to notify you about the Health Check and Monitor Group statuses. The functionality of this toggle option is also determined by the Sync Monitor Group Status with Health Check Status option.
- For existing Monitor Groups, both the Sync Monitor Group Status with Health Check Status and Notify for Count Based Thresholds options will be set to No by default. If required, you need to set it to Yes or create a new threshold profile.
- For new Monitor Groups, both the Sync Monitor Group Status with Health Check Status and Notify for Count Based Thresholds options will be set to Yes by default, only if a new threshold profile is associated with the Monitor Group.
Given below in the table are various scenarios and their corresponding expected outcomes based on the combination of Sync Monitor Group Status with Health Check Status and Notify for Count Based Thresholds option configuration settings.
| Scenario | When Sync Monitor Group Status with Health Check Status is toggled to | When Notify for Count Based Thresholds is toggled to | Result |
|---|---|---|---|
| 1 |
Yes |
Yes/No |
The Monitor Group status gets synced with the Health Check status. |
| 2 |
No |
Yes |
The Monitor Group status will not be synced with the Health Check status. However, the Health Check status will be updated based on the Monitor count threshold to decide the monitor group's status. |
| 3 |
No |
No |
Monitor Group status is updated based on the Monitor count threshold to decide the monitor group's status. The Health Check status is updated based on the Health Check threshold configuration. |
Licensing
Health Check is supported for all paid and evaluation accounts.
Polling frequency
Monitor Group
In a Monitor Group when there are monitors in Down, Trouble, or Critical status, the least available poll interval of the monitor out of all those problematic monitors is set as the default polling frequency for Health Check.
For instance, consider that you have a Monitor Group. Suppose there are four monitors in the Monitor Group namely, zylker 1, zylker 2, zylker 3 and zylker 4 which are in Up, Down, Trouble, Critical status respectively. Let's assume that the poll interval of the monitors are one minute, three minutes, five minutes, and ten minutes respectively. In this case, zylker 2 has a poll interval of three minutes which is the least out of all the problematic monitors. Therefore, the default poll frequency of the Monitor Group will be set as three minutes.
Subgroup
In the case of Subgroups, the least available poll interval of the monitor out of all the problematic monitors in a subgroup is set as the default polling frequency for Health Check.
For instance, consider that you have a Subgroup that consists of two monitors, zylker-subgroup 1, zylker-subgroup 2 which are in Down and Critical status respectively. Let's assume that the poll interval of the monitors are five minutes and three minutes. In this case, zylker-subgroup 2 has a polling frequency of three minutes which is the least among all. Therefore, the default poll frequency of the Subgroup will be set as three minutes.
Understanding maintenance periods in Health Check
The maintenance period allows administrators to perform necessary maintenance activities on monitors or monitor groups without triggering unnecessary alerts. Maintenance periods can be scheduled in advance or manually triggered, and both types ensure that the monitors are marked as being in maintenance mode.
When you mark a monitor in a monitor group for maintenance, the monitor status gets reflected instantly at the monitor level. However, in Health Check, the monitor maintenance status will be reflected only during the next polling cycle.
Let's consider a monitor group named Zylker Monitor Group with four monitors: zylker 1, zylker 2, zylker 3, and zylker 4. Say zylker 1 experiences an outage from 9:30am - 1pm.
At 10am, you mark monitor zylker 1 as under maintenance. This means that:
- At the zylker 1 level:
- The whole outage time from 9:30am - 1pm will be marked as maintenance.
- At the Health Check level:
- The outage time will be 9:30am - 10am.
- 10am - 1pm will be considered a maintenance period.
Thus, in Health Check, when you mark a monitor in a monitor group as under maintenance:
- The monitor status is updated in the next poll.
- The maintenance period will be displayed along with the outage details without altering the recorded outage duration (i.e., 9:30am - 10am in the above scenario).
Viewing Health Check data for Monitor Groups
To view the Health Check data for Monitor Groups:
- Select Home > Monitor Groups from the left pane.
- Select the monitor group of your preference and navigate to the Health Check tab.
The top banner in the Health Check tab gives an overview of the Monitor Group. It displays the Monitor Group status, Availability percentage, total number of monitors in the Monitor Group, and the number of monitors in Up, Down, Critical, and Trouble status.

Viewing Health Check data for Subgroups
To view the Health Check data for Subgroups:
- Select Home > Monitor Groups from the left pane.
- Select the Show Subgroups check box at the top right corner.
- Select the subgroup of your preference and navigate to the Health Check tab.
The top banner in the Health Check tab displays the Availability, total number of monitors in the Subgroup, and the number of monitors in Down, Critical, and Trouble, and Up status.

Health Check data
Health check will be automatically enabled when you create a Monitor Group or Subgroups. You can view the Health Check data in the following tabs:
Availability
The Availability tab displays the availability of the Health Check monitors, events based on status, and Availability Status in Percentage/Count of the monitors attached. The various statuses in the section include Up, Down, Critical, Trouble, and Maintenance.
Status
The Status tab shows a detailed status of the monitor such as Total Downtime, Downtime Details, Total Trouble Time, and Trouble Time Details. You can use the status filter option to view the monitors in the Down/Critical/Trouble status.
Monitored Resources
The Monitored Resources tab lists all the monitors mapped under the respective Health Check monitor along with their Status, Outage Start Time, and the Reason for the outage.
You can set the thresholds for the monitors by clicking Threshold Configuration. If the status of an individual monitor changes, then the Monitor Group status is also updated based on the threshold configuration.
Subgroups
All the monitors under the parent Monitor Group along with the associated monitors in the Subgroups are displayed in the Subgroups tab. The Subgroups tab will be displayed only if subgroups are available for the Monitor Group. You can view the subgroup status and identify the number of monitors in Up, Down, Critical, and Trouble status.

Events
You can view the outage details of your monitor such as Start Time to End Time of the outage, Duration, and the Reason of the outage in the Events tab.
Log Report
The Log Report tab shows the monitoring location, time, status, and the monitors in Available, Down, Trouble, or Critical status over a period of time.
RCA
View the downtime summary details along with other data like Status Events, Monitored Resources, and Outage History in the RCA tab.

-
On this page
- Use case
- Benefits of Health Check
- Supported Health Check metrics
- Supported Subgroups metrics
- Threshold configuration
- Licensing
- Polling frequency
- Monitor Group
- Subgroup
- Understanding maintenance periods in Health Check
- Viewing Health Check data for Monitor Groups
- Viewing Health Check data for Subgroups
- Health Check data