Performance metrics of an agentless server monitor
Site24x7's agentless server monitoring monitors all your servers using SNMP and WMI credentials for important metrics like response time, packet loss, services, processes, and disk-related metrics using performance counters and tabular performance counters. You can also configure to receive instant downtime alerts by configuring threshold profiles.
Navigate to the server tab and click on a agentless server monitor to view different tabs like:
Summary
Provides an overview of the device performance metrics.
| Metric | Description |
| Availability | Availability of the device in percentage. |
| Response Time | Shows the current response time of the device. Click the chart to display the response time history. |
| CPU Utilization | Displays the device CPU utilization as a graph. Click the chart to get the performance report for a custom period. |
| Memory Utilization | Displays the device Memory Utilization as a graph. Click the chart to get the performance report for a custom period. |
| Disk Utilization | Displays the device Disk utilization as a graph. Click the chart to get the performance report for a custom period. |
| Downtimes | Shows the number of downtimes in the selected time range. |
| Packet Loss | Shows the packet loss percentage for the device on that day. |
| Device Details | Shows general details of the device, including DNS, vendor name, IP address, and category of the device. |
| Hardware Details | Provides the manufacturer details, model name, and serial number. |
Network
Interface metrics are supported only via SNMP-based monitoring and are not available through WMI monitoring.
Displays the list of interfaces in the selected server along with their status and other details. Click an interface name to view its availability with graphs on traffic and bandwidth utilization.
| Parameter | Description |
| Interface name | Name of the interface. |
| Type | Type of interface. |
| In traffic | Amount of traffic received by the interface in bits per second. |
| Rx Utilizaed(%) | Amount of received traffic utilized by the interface in percentage. |
| Out traffic | Amount of traffic transmitted by the interface in bits per second. |
| Tx utilized(%) | Amount of transmitted traffic utilized by the interface in percentage. |
| Errors(%) | Percentage of error packets received by the interface. |
| Discards(%) | Percentage of packets discarded by the interface from the total number of packets. |
| Status | Shows whether the interface is up, down, or in trouble state. |

Figure 1. Network metrics of an agentless server monitor.
Click the Interface Name to view Interface Details page.
| Parameters | Description |
| Admin State | Tells whether the admin state of the interface is up or down. |
| Operational State | Tells whether the operational state of the interface is up, trouble, or down. |
| Rx Utilization | Amount of received traffic utilized by the interface. |
| Tx Utilization | Amount of transmitted traffic utilized by the interface. |
| Utilization | Average of the received and transmitted traffic utilized. |
| In Traffic | Amount of traffic received by the interface. |
| Out Traffic | Amount of traffic transmitted by the interface. |
| Traffic | Total traffic. |
| Packets Received | Number of error packets received to the interface. |
| Packets Sent | Number of error packets sent by the interface. |
| Packets | Total number of packets handled by the interface. |
| Rx Volume | Total volume received in Bytes. |
| Tx Volume | Total volume transmitted in Bytes. |
| Volume | Total volume in Bytes. |
| Errors (%) | Percentage of error packets received by the interface in percentage. |
| Discards (%) | Percentage of packets discarded by the interface from the total number of packets in percentage. |
| Error and Discard Percentage | Percentage of errors and discards including the Average, Maximum, and Minimum. |
| Error and Discard Count | Count of errors and discards including the Average, Maximum, and Minimum. |
Bandwidth details are also captured along with other metrics.
| Parameters | Description |
| In Speed (Mbps) | Amount of bandwidth that can be received by the interface. This is a constant value from the SNMP response of that interface. |
| Out Speed (Mbps) | Amount of bandwidth transmitted by the interface. This is a constant value from the SNMP response of that interface. |
| In Traffic (bps) | Amount of traffic received by the interface. |
| Out Traffic (bps) | Amount of traffic transmitted by the interface. |
| Rx Utilized | Amount of received traffic utilized by the interface. |
| Tx Utilized | Amount of transmitted traffic utilized by the interface. |
| Avg Rx Packet Size | Average packet size received for a period of time. |
| Avg Tx Packet Size | Average packet size transmitted for a period of time. |
| Received Packets (pps) | Number of error packets received by the interface. |
| Transmitted Packets (pps) | Number of error packets transmitted by the interface. |
Processes
Displays the processes on the selected server along with their status and other details.
| Parameter | Description |
| Process Name | Name of the process running on your server. |
| CPU (%) | CPU usage by the process in percentage. |
| Memory (%) and Memory (bytes) | Memory usage by the process in percentage and bytes (MB, TB, and GB). |
| Instances | Number of times that particular instance has occurred. |
| Status | Shows whether the process is up, down, or in trouble state. |

Services
Displays the services on the selected server along with their status and other details.
| Parameter | Description |
| Service Name | Name of the service running on the server. |
| Port | Port on which the service is running. |
| Response Time (ms) | Time taken for the service to respond to a PING. |
| Status | Shows whether the service is up, down, or in the trouble state. |
Disk
Displays the disk details on the selected server along with the status.
| Parameter | Description |
| Disk name | Name of the disk. |
| Disk partition | Total number of partitions in the disk. |
| Disk size | Size of the disk in bytes. |
| Disk used | Total space occupied in the disk in bytes and percentage. |
| Disk(free) | Free space available on the disk in bytes and percentage. |
| Status | Shows whether the disk is up or in the trouble state. |
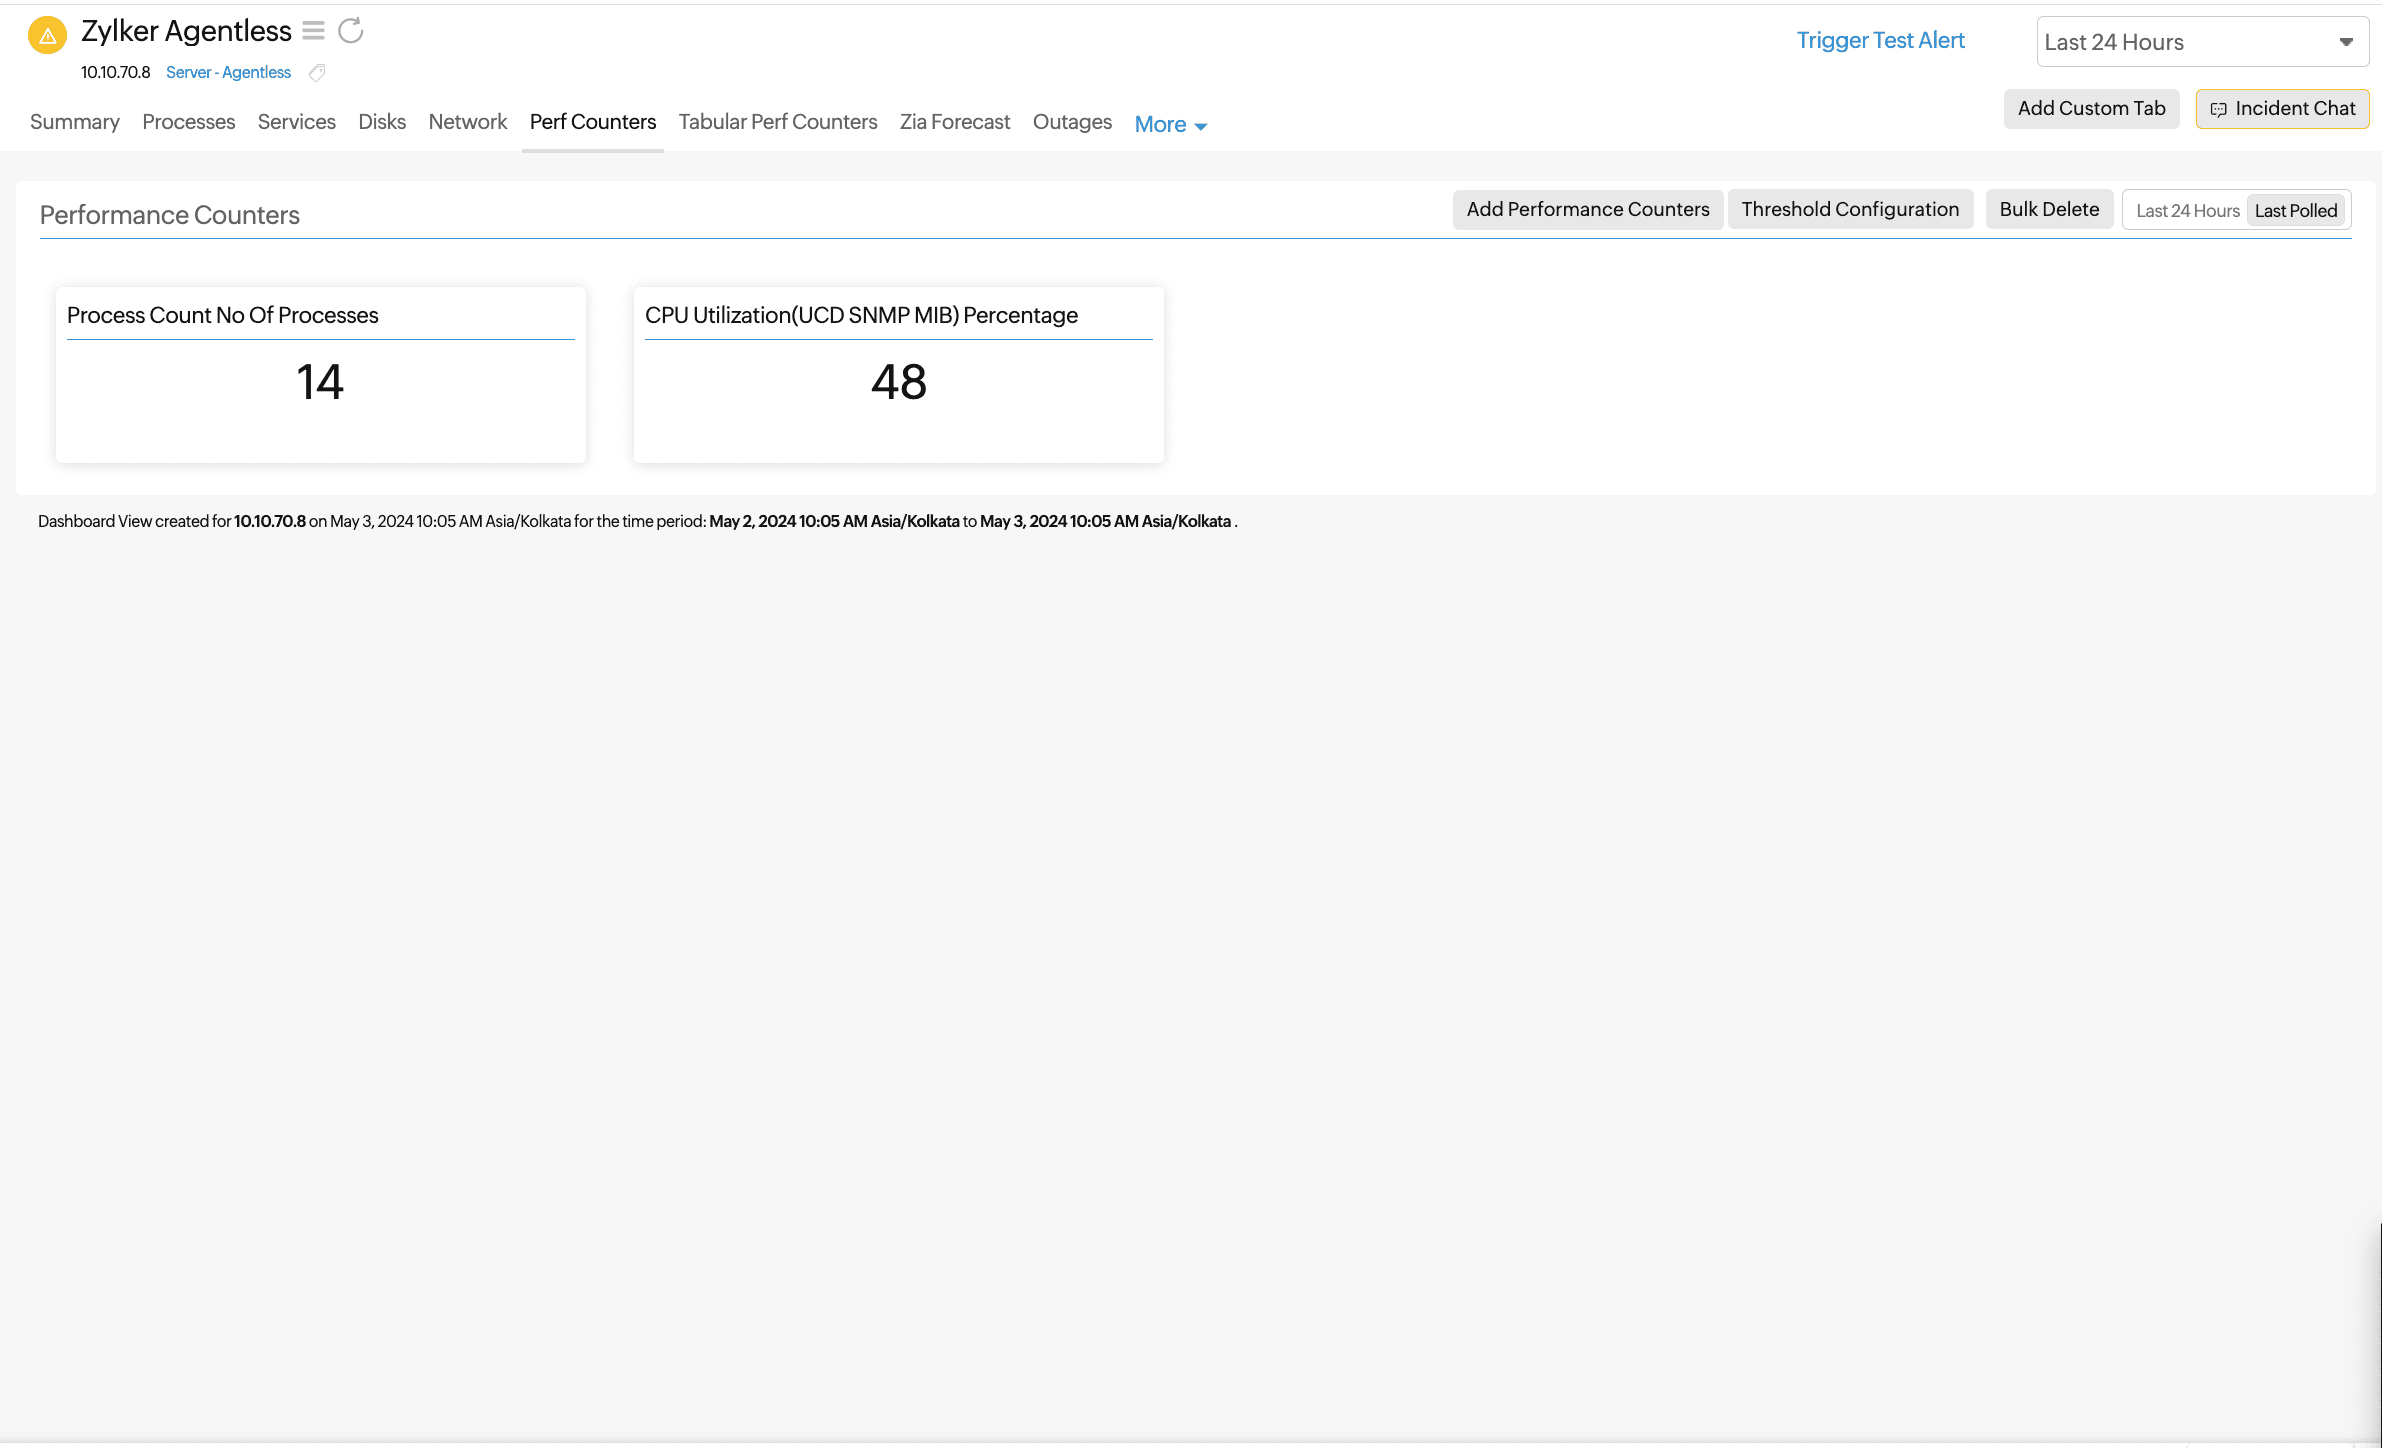
Performance counters
Custom performance counters are supported only with SNMP credentials and are not available with WMI.
This tab lists down all the performance counters associated with a server. You can test, configure thresholds, and delete performance counters from here.
Tabular performance counters
Monitor the tabular SNMP OIDs of your servers using tabular performance counters. This tab lists down your tabular performance counters along with their values, with provisions to edit thresholds and delete them.