
Create custom reports using ONQL
Custom reports allow you to retrieve, organize, and analyze monitoring data based on your reporting requirements. You can create a report by selecting the required parameters through the report form or by writing an ONQL query to define the attributes, metrics, filters, and time period. This document explains how to create custom reports using ONQL, from writing and previewing a query to generating, saving, and scheduling the report. It also covers the settings that can be managed through the report form.
Rules for report queries
When writing an ONQL query for a custom report, follow the rules below to ensure the query is valid and retrieves the intended monitoring data. These rules define how attributes, filters, sorting, and aggregation functions must be used together to avoid query errors and generate accurate reports.
- Include every attribute you filter with: Each attribute used in
filterby()andhaving()must also be specified ininclude(). Otherwise, the query returnsONQL_ERROR_RULE_01(filterby_selected_only). - Include every attribute you sort with: The attribute used in
sortmust also be specified ininclude(). Otherwise, the query returnsONQL_ERROR_COLUMN_05. - A custom report requires only
reporttypeandinclude(). All other clauses are optional.
| Clause | Requirement | Purpose |
|---|---|---|
reporttype |
Required | Which category of monitors the report is about |
include |
Required | The columns of the report |
filterby |
Optional | Monitors filtered by identity |
having |
Optional | Rows filtered by measured value |
sort |
Optional | Row order |
timeperiod |
Optional | The time window required to create a report |
timeslice |
Optional | Buckets inside the window |
Predefined time periods
ONQL supports predefined time periods to retrieve monitoring data. The following table lists the periods by category.
| Time granularity | Supported time periods |
|---|---|
| Hourly | last_1_hour, last_6_hours, last_12_hours, last_24_hours, last_48_hours |
| Daily | today, yesterday, last_3_days, last_7_days, last_30_days |
| Weekly | this_week, last_week |
| Monthly | this_month, last_month, last_3_months |
| Quarterly | this_quarter, last_quarter |
| Yearly | this_year, last_year |
| Offset-based | last_2_hours_ago, last_6_hours_ago, last_12_hours_ago |
Unsupported and invalid periods
Some periods are not available in custom reports. The following apply:
last_5_minutes,last_10_minutes,last_15_minutes,last_30_minutes, andlast_3_hoursare not supported in custom reports. Using them returnsONQL_ERROR_PERIOD_02.- An unrecognized period, such as
last_hr, returnsONQL_ERROR_PERIOD_01.
To retrieve data for unsupported predefined time periods, use custom time expressions. For example, custom_expression "-5m" retrieves data from the last five minutes.
Supported time intervals
ONQL supports hour, day, week, month, and quarter as time intervals. The interval you can use depends on the selected time period, as listed below.
| Time period | Supported time granularity |
|---|---|
| last_24_hours | hour |
| last_30_days, this_month, last_month | week, day |
| this_quarter, last_quarter, last_3_months | month, week |
| this_year, last_year | quarter, month |
The specified time span must be between one hour and two years.
Unit conversion
Unit conversion in ONQL lets you display monitoring metrics in your preferred units using the in modifier. This helps you compare values consistently and interpret monitoring data without manually converting units. You can convert values only between supported units within the same unit family.
For example, in capacity planning, disk metrics may be reported in different units, making it difficult to compare storage usage across servers. Unit conversion brings total disk size, used space, and free space into a common unit, such as GB. This helps you compare storage capacity consistently, identify disks running low on space, and plan capacity upgrades based on available storage.
Sample query:
reporttype="server" | include(monitoring_inventory.monitor_name, monitoring_inventory.monitor_type, monitoring_inventory.child.name, performance.child.disk_size in "gb", performance.child.disk_usage_size in "gb", performance.child.disk_free_size in "gb") sort monitoring_inventory.monitor_name asc timeperiod last_month
How custom reports use ONQL
You can build a custom report in two ways: using the form (report builder) or by typing a query. Both produce the same kind of report, a multi-sheet workbook that you can preview, generate, save, and schedule.
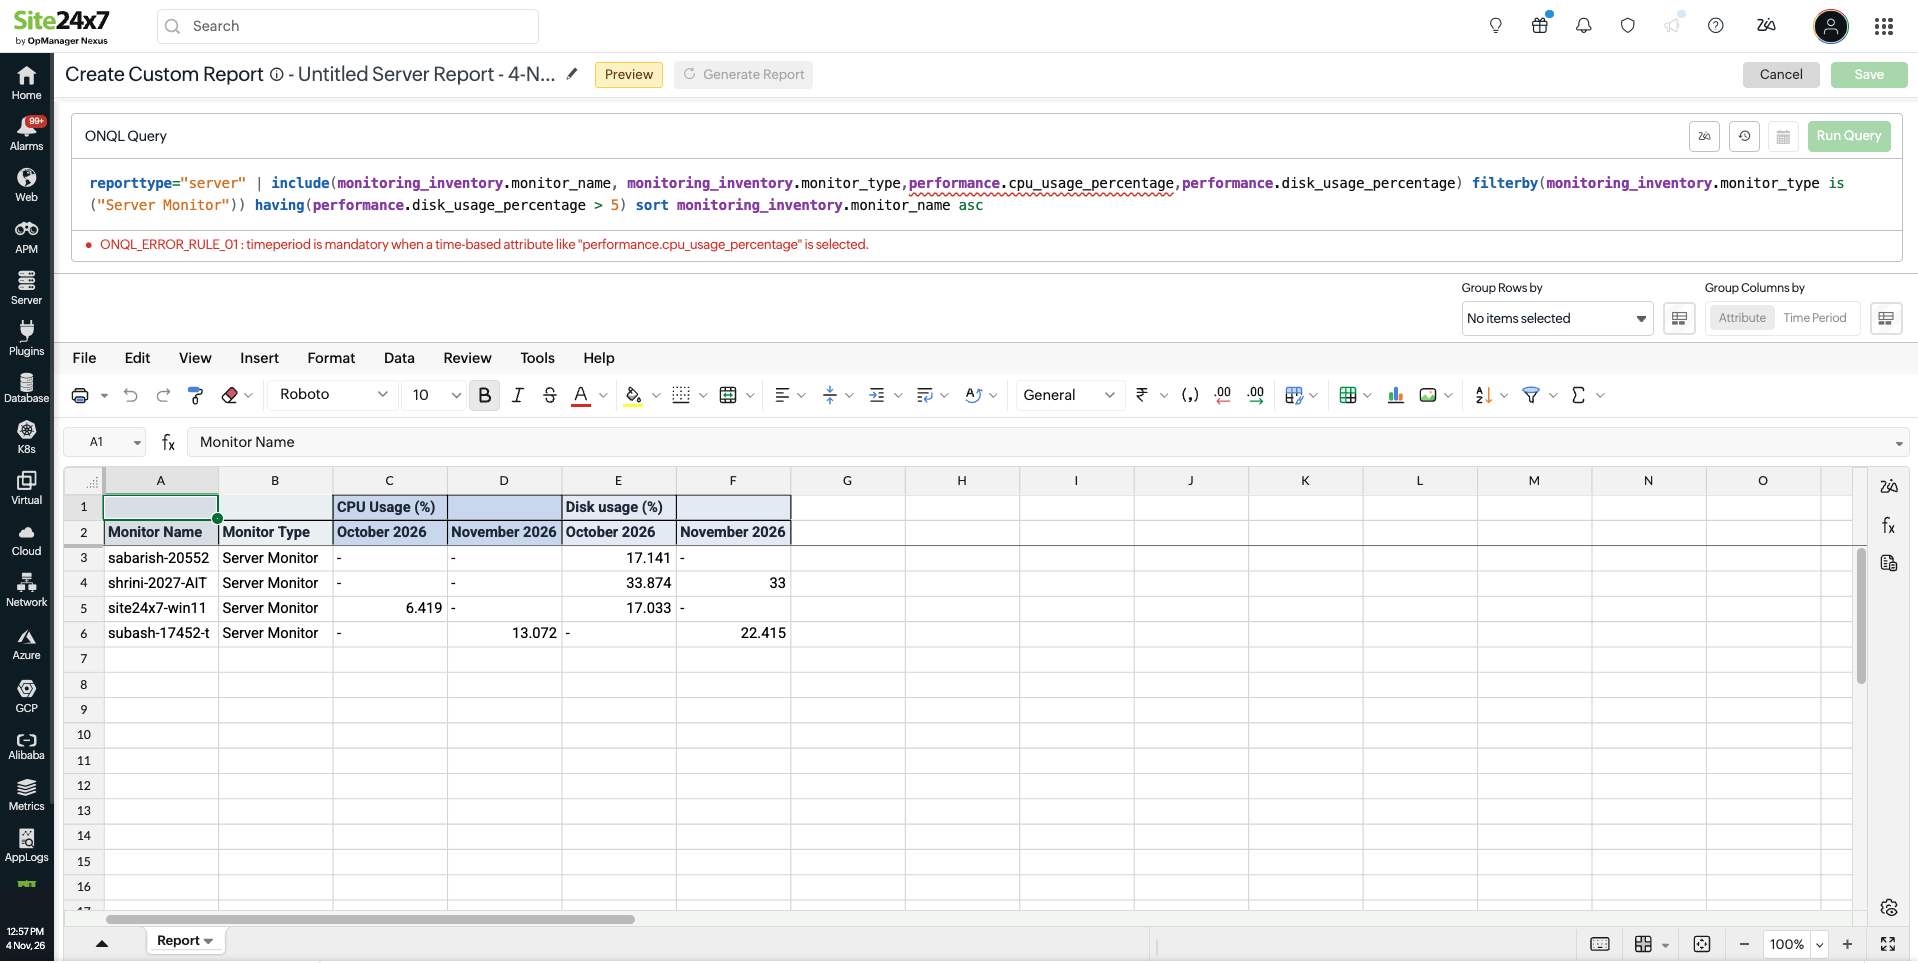
In query mode, the data is fetched based on the given query. You can use the custom report settings to organize the fetched data. The table shows what each one controls.
| Data fetched by the query | Organized through report settings |
|---|---|
Monitors: reporttype and filterby |
Sheet layout: You can decide if columns are grouped by attribute or by time period, and if the report is split into separate sheets by group or by period |
Columns: include, with aggregates, units, and aliases |
Grouping rows |
Row filtering and order: having and sort |
|
Time window and buckets: timeperiod and timeslice |
Grouping is a custom report setting. ONQL has no groupby clause.
What is different in a report?
A few ONQL behaviors are specific to custom reports. They are listed below:
- Report type is mandatory: A report is always about one category, so
reporttypeis required. - Column inclusion: Any column used in
filterby(),having(), orsortmust also be included ininclude(). - Slices are limited to supported pairs: For example,
last_30_daysworks withdayorweek, andlast_7_daysworks with no slice. - Restricted time windows: Some time periods like
last_5_minutestolast_30_minutesandlast_3_hoursare not offered in reports. A custom span must be 1 hour to 2 years.
Creating a report from a query
To create a custom report using ONQL, follow the steps below:
- Log in to your account.
- Navigate to Reports > Custom Reports.
- In the Create report using pop-up, select ONQL Query and click Continue.
- Next, in the Custom report page, start typing your query in the query box to define the data to retrieve, apply filters and aggregations, sort results, and specify time periods using the ONQL query language. The query box checks syntax and semantics as you type, and the suggestions come from the category you chose.
- Click the Run Query button on the top right or press Enter to run the query and view the sheet.
Note
If you provide an invalid query, the Run Query, Generate, and Save options are disabled until the query is corrected.
- Click Generate to fetch the entire report for all matching monitors. Generate uses the same query as Preview.
- Click Save to store the query text with the report.
Generating an ONQL query using Zia
You can use the Zia assistant to generate ONQL queries by describing your reporting requirements in plain English, without writing the query manually.
Prerequisite: Add the Zia integration to your account to enable Zia.
Follow the steps below to generate a query using Zia:
- Click the Zia icon
 adjacent to the query editor.
- In the window that appears, enter your reporting requirements under Describe your report and click Generate.
- Zia interprets your request, validates the ONQL syntax, and displays the generated query with a confidence level of High, Moderate, or Low. Review the generated query and click Apply query to insert it into the query editor.
If Zia is unable to generate a query due to a connection issue, check your Zia integration and try again.
Sample ONQL queries and use cases
The following examples show how to use ONQL to retrieve, filter, and organize monitoring data for different reporting needs. You can use these queries as a starting point and modify the attributes, monitor names, and time periods based on your requirements.
- Review weekly server health: Review the average and peak CPU usage and average memory usage of each server over the past week to identify potential performance issues.
Sample query:
reporttype="server" | include(monitoring_inventory.monitor_name, avg|max(performance.cpu_usage_percentage), avg(performance.memory_usage_percentage)) sort monitoring_inventory.monitor_name asc timeperiod last_week
- Analyze daily downtime for production websites: Review daily downtime in hours for production websites to identify recurring availability issues.
Sample query:
reporttype="web_experience" | include(monitoring_inventory.monitor_name, availability.down_time in "hrs" as "Downtime (hrs)") filterby(monitoring_inventory.monitor_name contains "prod") sort monitoring_inventory.monitor_name asc timeperiod this_month timeslice day
- Compare availability within a monitor group: Compare availability percentages and downtime across servers belonging to a specific monitor group to identify the least available servers.
Sample query:
reporttype="server" | include(monitoring_inventory.monitor_name, monitoring_inventory.monitor_groups, availability.availability_percentage, availability.down_time in "mins") filterby(monitoring_inventory.monitor_groups is "Asia-Production") sort availability.availability_percentage asc timeperiod last_30_days
- Analyze network interface traffic: Review average and peak incoming traffic for interfaces across network devices to identify interfaces with high traffic utilization.
Sample query:
reporttype="network" | include(monitoring_inventory.monitor_name, monitoring_inventory.child.name, avg|max(performance.child.in_traffic)) sort monitoring_inventory.monitor_name asc timeperiod last_24_hours
NoteWhen using a child attribute, include
monitoring_inventory.child.nameto identify the corresponding child resource. - Review database downtime: Identify database monitors that experienced downtime yesterday and arrange them by downtime duration to prioritize investigation.
Sample query:
reporttype="database" | include(monitoring_inventory.monitor_name, monitoring_inventory.monitor_type, availability.status, availability.down_time in "mins") filterby(monitoring_inventory.monitor_type is ("Microsoft SQL Server", "MySQL", "PostgreSQL")) sort availability.down_time desc timeperiod yesterday - Identify monitors with the highest response times: Find monitors with the highest average response times to identify potential performance bottlenecks.
Sample query:
reporttype="web_experience" | include(monitoring_inventory.monitor_name, avg(performance.response_time)) sort avg(performance.response_time) desc timeperiod last_24_hours
NoteReview the first 10 rows to identify the monitors with the highest response times. ONQL does not support a limit clause.
- Retrieve monitors from multiple environments: Generate a report for monitors associated with production and staging environments using their tags.
Sample query:
reporttype="server" | include(monitoring_inventory.monitor_name, monitoring_inventory.tags, availability.status) filterby(monitoring_inventory.tags is ("prod", "stage")) - Identify monitors exceeding multiple thresholds: Find servers where average CPU usage exceeds 80% and average memory usage exceeds 70% to identify potential resource constraints.
Sample query:
reporttype="server" | include(monitoring_inventory.monitor_name, avg(performance.cpu_usage_percentage), avg(performance.memory_usage_percentage)) having(avg(performance.cpu_usage_percentage) > 80 and avg(performance.memory_usage_percentage) > 70) timeperiod last_24_hours
- Review monitor status and downtime: View the availability status and downtime duration of servers to assess their availability over a selected period.
Sample query:
reporttype="server" | include(monitoring_inventory.monitor_name, availability.status, availability.down_time in "mins") timeperiod last_24_hours
NoteAvailability attributes such as
availability.statusandavailability.down_timecan be included ininclude(), but cannot be used inhaving(). - Customize report column names: Assign meaningful names to report columns so that the generated report is easier to understand.
Sample query:
reporttype="server" | include(monitoring_inventory.monitor_name, avg(performance.cpu_usage_percentage) as "Avg CPU (%)", avg(performance.memory_usage_percentage) as "Avg memory (%)") timeperiod last_24_hours
- Generate an ONQL query using natural language: Create a report query by describing your reporting requirements instead of writing the ONQL query manually.
Example prompt to Zia:
Show the average CPU and memory utilization of all servers over the last 24 hours, sorted by CPU usage in descending order.
Click the Zia icon
in the query editor, enter your requirements, and review the generated ONQL query before executing it.
Common mistakes
These are the mistakes that occur most often, with the corrected version beside each one.
| Invalid | Valid |
|---|---|
filterby(monitoring_inventory.monitor_name = "web") |
filterby(monitoring_inventory.monitor_name is "web") |
sort avg(performance.cpu_usage_percentage) |
sort avg(performance.cpu_usage_percentage) desc |
include(…) | filterby(…) |
include(…) filterby(…) |
availability.down_time in "hours" |
availability.down_time in "hrs" |
timeperiod last_7_days timeslice day |
timeperiod last_30_days timeslice day |
reporttype="servers" | |
reporttype="server" | |
Troubleshooting
If a query does not run, use the table to find the likely cause and where to look.
| Symptom | Likely cause | Look at |
|---|---|---|
| Run Query, Generate, or Save is disabled | The given query is not valid | The error under the query box, and the ONQL error codes page |
| The message "clause reporttype is required" appears | The custom report needs a report type | Refer to [ONQL_ERROR_CLAUSE_02] |
| The report covers last month, not the period you wanted | No timeperiod was written |
Custom reports support only certain predefined time periods |
| The time slice is rejected | The particular time period and slice pair is not allowed | Refer to [ONQL_ERROR_PERIOD_04] |
| Interface rows cannot be told apart | The child name is missing | Refer to [ONQL_ERROR_RULE_01] |
| An attribute is not found | The attribute does not exist for the chosen category | Press Ctrl + Space (Windows), Option + Space (macOS), or Shift + Space (Linux) to get context-aware suggestions. Refer to [ONQL_ERROR_COLUMN_01] |
Attribute names under performance and resource_inventory depend on the account and category. Press Ctrl + Space (Windows), Option + Space (macOS), or Shift + Space (Linux) in the query editor to view context-aware suggestions.