Network Load Balancer monitoring
The OCI Network Load Balancer is a fast, scalable service that distributes incoming traffic across multiple backend servers using network-level information, making it ideal for low-latency, long-running tasks like database applications. Site24x7 enhances the reliability of this service by providing real-time monitoring of backend health, connection performance, and listener availability to ensure traffic is routed only to healthy resources.
Overview
Site24x7’s integration with Oracle Cloud Infrastructure (OCI) Network Load Balancer enables end-to-end visibility and health tracking of your high-performance, low-latency load-balancing resources.
This integration helps you monitor the health status, traffic distribution, and resource usage of the Network Load Balancer and its associated components to ensure reliable application delivery and minimal latency. This integration also provides you with the following child monitors:
- Backend Set: A critical component of the OCI Network Load Balancer that defines how incoming traffic is distributed across backend servers. Monitoring Backend Sets with Site24x7 ensures that traffic is only routed to healthy backend servers, thereby maintaining service availability and enabling quick detection and resolution of performance issues.
- Listener: The entry point for client traffic into the Network Load Balancer that's configured to listen to specific ports and protocols. Site24x7 monitors each listener to track metrics such as incoming traffic, number of active connections, and port-level configuration details. Ensure seamless traffic flow into your applications, detect configuration errors early, and maintain optimal load balancer performance.
Use cases
A global e-commerce company hosts its customer-facing applications on OCI and relies on OCI Network Load Balancers to manage high volumes of TCP traffic across backend servers deployed in multiple availability domains. To ensure uninterrupted service during peak shopping periods, the company integrates its OCI Network Load Balancers with Site24x7.
With real-time health checks, connection metrics, and traffic flow visibility provided by Site24x7, the IT operations team can proactively detect backend server failures and abnormal traffic patterns. During a seasonal flash sale, Site24x7 alerts help the team quickly identify and isolate a misconfigured backend set, minimizing downtime and ensuring a seamless shopping experience for customers. This integration significantly enhances the company's ability to maintain high availability, troubleshoot faster, and scale operations with confidence.
Benefits of Site24x7's Load Balancer integration
Integrate your Network Load Balancer with Site24x7 and leverage the following benefits:
- Continuously monitor the health of backend servers and ensure reliable traffic distribution across instances.
- Track latency, dropped connections, and backend server response times to fine-tune load-balancing policies.
- Monitor traffic while preserving the original client IP for better traceability and diagnostics.
- Get notified about performance issues or health check failures before they impact users, enabling quick remediation.
- Gain deep visibility into connection patterns and backend statuses for faster root cause analysis.
Setup and configuration
- Site24x7 uses cross-tenancy access to monitor your resources using Site24x7's tenancy user. Log in to your Site24x7 account and create a specific policy to allow Site24x7 to view your resources without affecting your security.
- On the Integrate OCI Monitor page, select Load Balancer from the Services to be discovered list.
Policies and permissions
Ensure that the associated OCI policy has the following statements:
- read the network-load-balancer-family
Polling frequency
Site24x7 queries OCI service-level APIs according to the set polling frequency (from once a minute to once a day) to collect metrics from a Network Load Balancer monitor.
Supported metrics
Network Load Balancer
These are the supported metrics for a Network Load Balancer monitor:
| Metric name | Description | Statistics | Unit |
|---|---|---|---|
|
Processed Bytes |
The total number of bytes processed by the network load balancer, including TCP/IP headers. |
Sum |
Bytes |
|
Processed Packets |
The total number of packets processed by the network load balancer. |
Sum |
Count |
|
Ingress Packets Dropped by Security List |
The packets received from the network, destined for the network load balancer, that were dropped because of security rule violations. |
Sum |
Count |
|
Egress Packets Dropped by Security List |
The packets sent by the network load balancer, destined for the network, that were dropped because of security rule violations. |
Sum |
Count |
|
New Connections |
The total number of new connections established between the client and a backend server. |
Maximum |
Count |
|
New TCP Connections |
The total number of new TCP connections established between the client and a backend server. |
Maximum |
Count |
|
New UDP Connections |
The total number of new UDP connections established between the client and a backend server. |
Maximum |
Count |
|
VTAP Packets Received by the Network Load Balancer |
The number of VTAP packets received by the Network Load Balancer. |
Sum |
Count |
|
VTAP Bytes received by the Network Load Balancer |
The number of VTAP bytes received by the Network Load Balancer. |
Sum |
Bytes |
|
VTAP Packets Transmitted by the Network Load Balancer |
The number of VTAP packets transmitted by the Network Load Balancer. |
Sum |
Count |
|
VTAP Bytes Transmitted by the Network Load Balancer |
The number of VTAP bytes transmitted by the Network Load Balancer. |
Sum |
Bytes |
|
VTAP Packets Dropped by the Network Load Balancer |
The number of VTAP packets dropped by the Network Load Balancer. |
Sum |
Count |
|
Number of Healthy Backends for Network Load Balancer |
The number of healthy backend servers present in the Network Load Balancer. |
Maximum |
Count |
|
Number of Unhealthy Backends for Network Load Balancer |
The number of unhealthy backend servers present in the network load balancer. |
Maximum |
Count |
|
Network Load Balancer Ingress Drops |
The number of incoming packets dropped by the Network Load Balancer due to errors, congestion, or configuration issues. |
Sum |
Count |
| Critical Backend Sets | The number of backend sets in a critical state due to severe health issues or failures. | Sum | Count |
| Warning Backend Sets | The number of backend sets showing potential issues that require attention. | Sum | Count |
| Unknown Backend Sets | The number of backend sets with an unknown health status, possibly due to a lack of data or connectivity issues. | Sum | Count |
| OK Backend Sets | The number of backend sets that are healthy and operating normally. | Sum | Count |
| Percentage of Critical Backend Sets | The percentage of total backend sets currently in a critical state. | Mean | Percentage |
| Percentage of Warning Backend Sets | The percentage of total backend sets currently in a warning state. | Mean | Percentage |
| Percentage of Unknown Backend Sets | The percentage of total backend sets with an unknown health status. | Mean | Percentage |
| Percentage of OK Backend Sets | The percentage of total backend sets that are functioning normally. | Mean | Percentage |
| Drained Backend Sets | The number of backend sets that have been marked as drained. | Mean | Count |
| Percentage of Drained Backend Sets | The percentage of total backend sets that are currently in a drained state. | Mean | Percentage |
Backend Set
These are the supported metrics for a Backend Set monitor:
| Metric name | Description | Statistics | Unit |
|---|---|---|---|
| Backend Servers | The number of backend servers in the backend set. | Maximum | Count |
| Unhealthy Backend Servers | The number of unhealthy backend servers in the backend set. | Maximum | Count |
| Critical Backends | The number of backends in a critical state due to severe health issues or failures. | Sum | Count |
| Warning Backends | The number of backends showing potential issues that require attention. | Sum | Count |
| Unknown Backends | The number of backends with an unknown health status, possibly due to a lack of data or connectivity issues. | Sum | Count |
| OK Backends | The number of backends that are healthy and operating normally. | Sum | Count |
| Percentage of Critical Backends | The percentage of total backends currently in a critical state. | Mean | Percentage |
| Percentage of Warning Backends | The percentage of total backends currently in a warning state. | Mean | Percentage |
| Percentage of Unknown Backends | The percentage of total backends with an unknown health status. | Mean | Percentage |
| Percentage of OK Backends | The percentage of total backends that are functioning normally. | Mean | Percentage |
| Drained Backends | The number of backends that have been marked as drained. | Mean | Count |
| Percentage of Drained Backends | The percentage of total backends that are currently in a drained state. | Mean | Percentage |
Threshold configuration
To configure thresholds for a Network Load Balancer monitor:
- Log in to your Site24x7 account and navigate to Admin > Configuration Profiles > Threshold and Availability.
- Click Add Threshold Profile.
- Select OCI Network Load Balancer from the Monitor Type drop-down menu and provide an appropriate name in the Display Name field.
- The supported metrics are displayed in the Threshold Configuration section. You can set threshold values for all the metrics mentioned above.
- Click Save.
Status propagation in OCI Network Load Balancer monitors
OCI Network Load Balancer integration supports status propagation for Backend Sets and Listeners.
When status propagation is enabled:
- Alerts for backend sets and listeners are disabled by default.
- Status change alerts from child monitors are suppressed unless you set Skip Alert to No in the Edit Threshold page.
- You receive alerts only from the parent Network Load Balancer monitor.
This ensures focused alerting at the network load balancing layer.
Alerts are automatically disabled for child monitors that support status propagation.
For example, if a Listener fails or becomes unavailable, the parent Network Load Balancer monitor raises a single alert indicating a network load balancing issue.
Licensing
- Each Network Load Balancer monitor utilizes one basic monitor license .
- Each Backend Set monitor utilizes one basic monitor license.
- The Listener monitor is a free monitor.
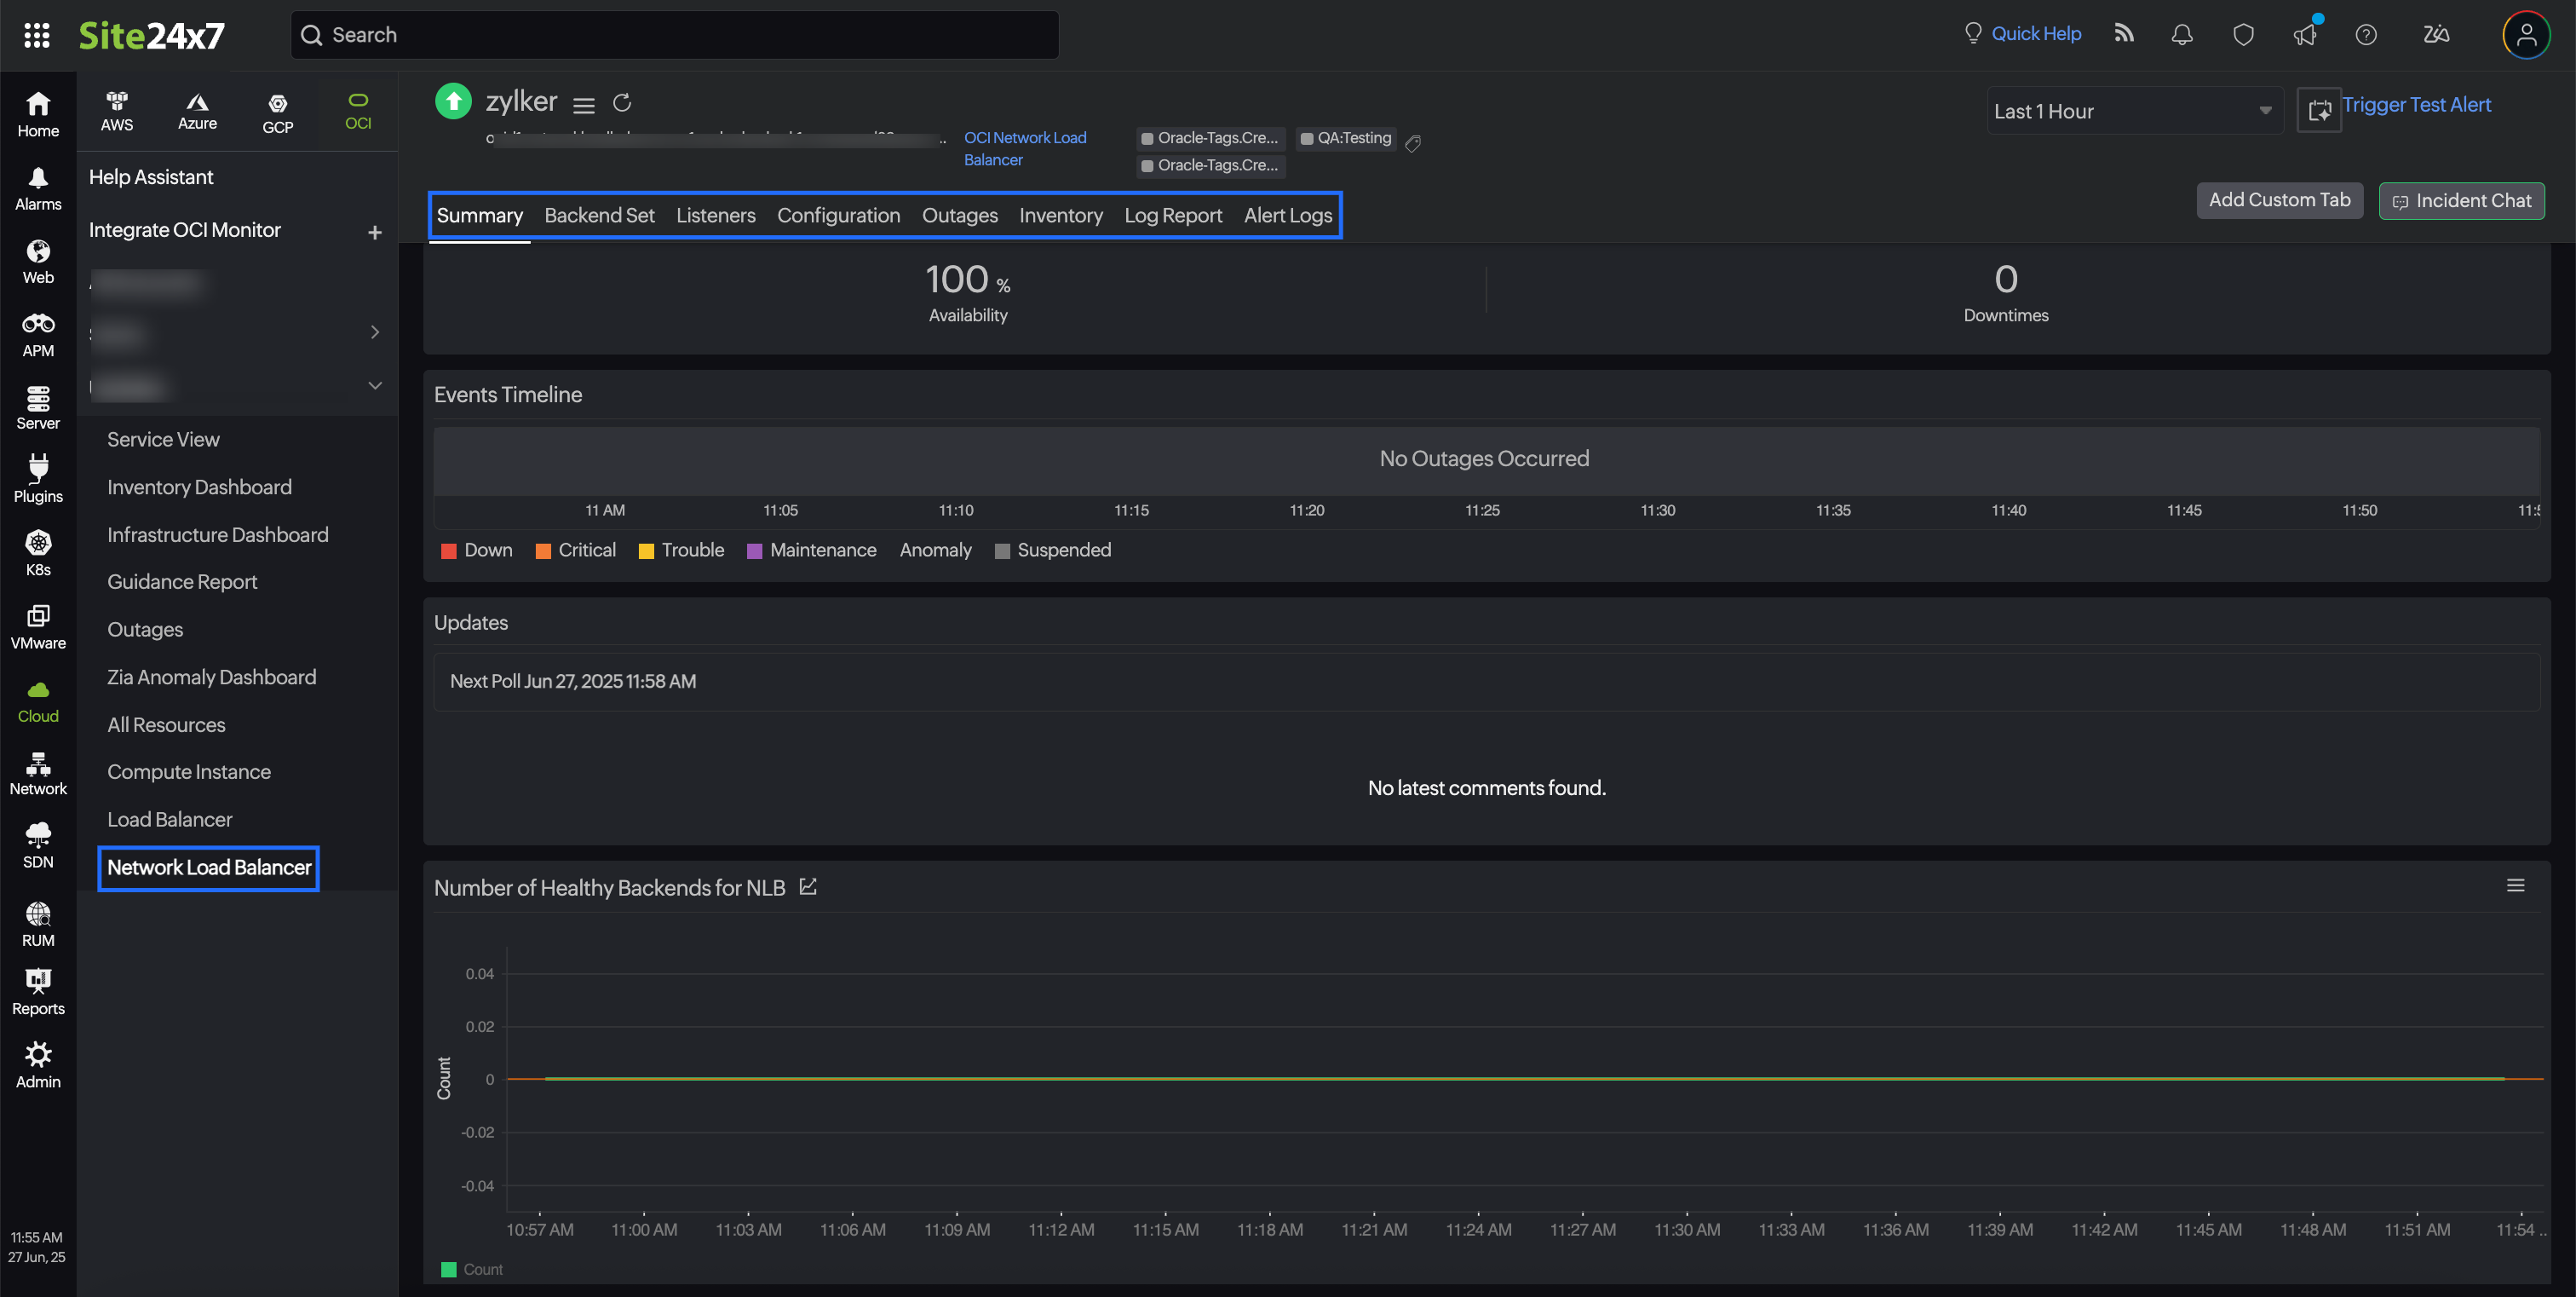
Viewing Network Load Balancer data
To monitor your Network Load Balancer environment, log in to your Site24x7 account and navigate to Cloud > OCI > Network Load Balancer .
Monitor data
Network Load Balancer
The monitor data for the Network Load Balancer monitor is given below.
Summary
The Summary tab provides an overview of the events timeline and metrics in the form of charts.
Backend Set
The Backend Set tab displays the Backend Set Availability details and the list of Backend Set monitors associated with the Network Load Balancer monitor. Click the desired monitor name hyperlink to view the Backend Set monitor data.
Listeners
The Listeners tab displays the Listeners Availability details and the list of Listener monitors associated with the Network Load Balancer monitor. Click the desired monitor name hyperlink to view the Listener monitor data.
Configuration
View the basic configuration details about your Load Balancer monitor, such as Load Balancer Name, Region, Compartment ID, and OCID, in the Configuration tab.
Zia Forecast
Estimate future values of the Processed Bytes, and Processed Packets metrics with the Zia Forecast feature. Predict future points of these performance metrics (measurement of resource usage) based on historical observations and make informed decisions. Fifteen days of historical data is used to predict what your metric usage will be in the next seven days.
Outages
The Outages tab provides details on an outage's start time, end time, duration, and comments (if any).
Inventory
Obtain details like Load Balancer Name, Region, and Monitor Licensing Category from the Inventory tab. Set and view the Threshold and Availability Profile and the Notification Profile according to the user in this tab.
Log Report
The Log Report tab offers a consolidated report of the Network Load Balancer monitor's log status, which can be downloaded as a CSV file.
Alert Logs
The Alert Logs tab displays a chronological list of all triggered alerts related to the Network Load Balancer monitor. This tab helps you trace alert history and severity to assess issues and validate threshold settings.
Backend Set
The monitor data for the Backend Set monitor is given below.
Summary
The Summary tab provides an overview of the events timeline and metrics in the form of charts. You can also view the Backends Health details in this tab.
Configuration
View the basic configuration details about your Backend Set monitor, such as Load Balancer Name, Overall Health, Region, and Policy, in the Configuration tab. In addition to this, Health Check Configuration details are also provided in this tab.
Backends
The Backends tab displays Backend Details such as Resource Name, IP Address, Port, and Weight. You can filter the resources with options such as Resource Name, IP Address, and Port.
If the Backend Set monitor is integrated with an OCI compute instance that is being monitored by Site24x7, the instance name will appear in the Resource Name column. Clicking this instance name will redirect you to the corresponding monitor details page.
Outages
The Outages tab provides details on an outage's start time, end time, duration, and comments (if any).
Inventory
Obtain details like Load Balancer Name, Region, and Monitor Licensing Category from the Inventory tab. Set and view the Threshold and Availability Profile and the Notification Profile according to the user in this tab.
Log Report
The Log Report tab offers a consolidated report of the Backend Set monitor's log status, which can be downloaded as a CSV file.
Alert Logs
The Alert Logs tab displays a chronological list of all triggered alerts related to the Backend Set monitor. This tab helps you trace alert history and severity to assess issues and validate threshold settings.
Listener
The monitor data for the Listener monitor is given below.
Summary
The Summary tab provides an overview of the event timeline and availability details.
Configuration
View the basic configuration details about your Listener monitor, such as Listener Name, Backend Set Name,Region, and Port, in the Configuration tab.
Outages
The Outages tab provides details on an outage's start time, end time, duration, and comments (if any).
Inventory
Obtain details like Load Balancer Name, Region, and Monitor Licensing Category from the Inventory tab. Set and view the Threshold and Availability Profile and the Notification Profile according to the user in this tab.
Log Report
The Log Report tab offers a consolidated report of the Listener monitor's log status, which can be downloaded as a CSV file.
Alert Logs
The Alert Logs tab displays a chronological list of all triggered alerts related to the Listener monitor. This tab helps you trace alert history and severity to assess issues and validate threshold settings.