Load Balancer monitoring
OCI Load Balancer is a fully managed, highly available service that distributes incoming application traffic across multiple backend servers to ensure fault tolerance and optimal performance. Monitoring your Load Balancer with Site24x7 helps you gain real-time visibility into traffic distribution, backend health, and listener performance. This enables faster issue detection, improved uptime, and better resource optimization.
Overview
Site24x7's integration with Oracle Cloud Infrastructure (OCI) Load Balancer enables you to monitor and gain visibility into the performance, health, and availability of your load balancing infrastructure.
With this integration, you can monitor key metrics, track health statuses, and set up proactive alerts to ensure uninterrupted traffic distribution across your backend resources. This integration also provides you with the following child monitors:
- Backend Set: Tracks the health and performance of the group of backend servers attached to your load balancer. Site24x7 monitors key metrics such as the number of healthy and unhealthy backends, backend response latency, and health check status. This helps ensure that traffic is routed only to healthy instances and allows you to take corrective action when a backend becomes unresponsive.
- Listener: Gain visibility into how your load balancer handles incoming client requests. It monitors listener-specific metrics such as request counts, connection errors, and response latencies. With Site24x7, you can detect anomalies like sudden traffic spikes or increases in failed connections, helping you troubleshoot and maintain reliable client-server communication.
Use cases
- A retail e-commerce company relies on Load Balancer to manage incoming user traffic to its shopping platform, which is hosted across multiple backend servers. During a seasonal sale event, the platform experiences a sudden spike in traffic, and one of the backend servers becomes unresponsive due to resource exhaustion.
With Site24x7’s Load Balancer monitoring, the operations team receives an immediate alert indicating that a backend in the affected backend set has failed a health check. Simultaneously, listener metrics show an increase in connection errors and latency, signaling a potential impact on user experience. Using these insights, the team quickly isolates the issue, reconfigures traffic distribution to healthy servers, and scales up backend resources to handle the load. Site24x7’s real-time monitoring and alerting prevented prolonged downtime, ensured consistent load distribution, and maintained optimal performance during a critical business period. - A video streaming platform relies on Load Balancer to manage millions of concurrent viewers during high-traffic live sports events. The primary challenge is ensuring smooth streaming without buffering or downtime, which can occur if backend servers become overloaded due to sudden traffic surges. Site24x7 plays a critical role in maintaining performance by automatically discovering new backend servers as they scale, ensuring traffic is efficiently distributed. It continuously monitors bandwidth usage and throughput to identify and prevent bottlenecks before they impact viewers. Additionally, Site24x7 alerts administrators if a cache hit ratio drops, signaling inefficient content delivery that could degrade the user experience. By leveraging these capabilities, the streaming platform achieves seamless, uninterrupted playback, even during peak demand, ensuring high viewer satisfaction and retention.
Benefits of Site24x7's Load Balancer integration
Integrate your Load Balancer with Site24x7 and leverage the following benefits:
- Monitor incoming and outgoing traffic patterns to optimize resource allocation and detect anomalies.
- Stay informed about the availability and health of your backend resources and listeners.
- Gain deep visibility into request and response metrics, error counts, and backend health check status.
- Track latency, dropped connections, and backend server response times to fine-tune load balancing policies.
- Receive instant alerts on threshold breaches, enabling quick response to potential problems.
Setup and configuration
- Site24x7 uses cross-tenancy access to monitor your resources using Site24x7's tenancy user. Log in to your Site24x7 account and create a specific policy to allow Site24x7 to view your resources without affecting your security.
- On the Integrate OCI Monitor page, select Load Balancer from the Services to be discovered list.
Policies and permissions
Ensure that the associated OCI policy has the permission:
- read the load-balancer-family
Polling frequency
Site24x7 queries OCI service-level APIs according to the set polling frequency (from once a minute to once a day) to collect metrics from a Load Balancer monitor.
Supported metrics
Load Balancer
These are the supported metrics for a Load Balancer monitor:
| Metric name | Description | Statistics | Unit |
|---|---|---|---|
| Accepted Connections | The number of connections accepted by the Load Balancer. | Sum | Count |
| Accepted SSL Handshakes | The number of accepted SSL handshakes. | Sum | Count |
| Active Connections | The number of active connections from clients to the Load Balancer. | Maximum | Count |
| Active SSL Connections | The number of active SSL connections. | Maximum | Count |
| Bytes Received | The number of bytes received by the Load Balancer. | Mean | Bytes |
| Bytes Sent | The number of bytes sent by the Load Balancer. | Mean | Bytes |
| Failed Client SSL Cert Verifications | The number of failed client SSL certificate verifications. | Sum | Count |
| Failed SSL Handshakes | The number of failed SSL handshakes. | Mean | Count |
| Handled Connections | The number of connections handled by the Load Balancer. | Mean | Count |
| Inbound Requests | The number of incoming client requests to the Load Balancer. | Mean | Count |
| Peak Bandwidth | Maximum bits per second bandwidth used during the specified interval. | Mean | Bits |
| Critical Backend Sets | The number of backend sets in a critical state due to severe health issues or failures. | Sum | Count |
| Warning Backend Sets | The number of backend sets showing potential issues that require attention. | Sum | Count |
| Unknown Backend Sets | The number of backend sets with an unknown health status, possibly due to a lack of data or connectivity issues. | Sum | Count |
| Incomplete Backend Sets | The number of backend sets with incomplete configuration or missing components. | Sum | Count |
| Pending Backend Sets | The number of backend sets whose health checks are still initializing or pending results. | Sum | Count |
| OK Backend Sets | The number of backend sets that are healthy and operating normally. | Sum | Count |
| Percentage of Critical Backend Sets | The percentage of total backend sets currently in a critical state. | Mean | Percentage |
| Percentage of Warning Backend Sets | The percentage of total backend sets currently in a warning state. | Mean | Percentage |
| Percentage of Unknown Backend Sets | The percentage of total backend sets with an unknown health status. | Mean | Percentage |
| Percentage of Incomplete Backend Sets | The percentage of total backend sets with incomplete setup or configuration. | Mean | Percentage |
| Percentage of Pending Backend Sets | The percentage of total backend sets awaiting health check results. | Mean | Percentage |
| Percentage of OK Backend Sets | The percentage of total backend sets that are functioning normally. | Mean | Percentage |
| Drained Backend Sets | The number of backend sets that have been marked as drained. | Mean | Count |
| Percentage of Drained Backend Sets | The percentage of total backend sets that are currently in a drained state. | Mean | Percentage |
Backend Set
These are the supported metrics for a Backend Set monitor:
| Metric name | Description | Statistics | Unit |
|---|---|---|---|
| Active Connections | The number of active connections from the Load Balancer to all backend servers. | Maximum | Count |
| Backend Servers | The number of backend servers in the backend set. | Maximum | Count |
| Backend Timeouts | The number of timeouts across all backend servers. | Sum | Count |
| Bytes Received | The number of bytes received across all backend servers. | Sum | Bytes |
| Bytes Sent | The number of bytes sent across all backend servers. | Sum | Bytes |
| Closed Connections | The number of connections closed between the Load Balancer and backend servers. | Maximum | Count |
| Inbound Requests | The number of incoming client requests to the backend set. | Sum | Count |
| Responses | The number of HTTP responses across all backend servers. | Minimum | Count |
| HTTP 200 Responses | The number of HTTP 200 responses received from backend servers. | Minimum | Count |
| HTTP 2xx Responses | The number of HTTP 2xx responses received from backend servers. | Minimum | Count |
| HTTP 3xx Responses | The number of HTTP 3xx responses received from backend servers. | Minimum | Count |
| HTTP 4xx Responses | The number of HTTP 4xx responses received from backend servers. | Minimum | Count |
| HTTP 502 Responses | The number of HTTP 502 responses received from backend servers. | Minimum | Count |
| HTTP 504 Responses | The number of HTTP 504 responses received from backend servers. | Minimum | Count |
| HTTP 5xx Responses | The number of HTTP 5xx responses received from backend servers. | Minimum | Count |
| Invalid Header Responses | The number of invalid header responses across all backend servers. | Sum | Count |
| Keep-alive Connections | The number of keep-alive connections. | Sum | Count |
| Average Response Time (TCP only) | Average time to the first byte of response from backend servers. TCP only. | Sum | MS |
| Average Response Time (HTTP only) | Average response time of backend servers. HTTP only. | Sum | MS |
| Unhealthy Backend Servers | The number of unhealthy backend servers in the backend set. | Maximum | Count |
| Critical Backends | The number of backends in a critical state due to severe health issues or failures. | Sum | Count |
| Warning Backends | The number of backends showing potential issues that require attention. | Sum | Count |
| Unknown Backends | The number of backends with an unknown health status, possibly due to a lack of data or connectivity issues. | Sum | Count |
| OK Backends | The number of backends that are healthy and operating normally. | Sum | Count |
| Percentage of Critical Backends | The percentage of total backends currently in a critical state. | Mean | Percentage |
| Percentage of Warning Backends | The percentage of total backends currently in a warning state. | Mean | Percentage |
| Percentage of Unknown Backends | The percentage of total backends with an unknown health status. | Mean | Percentage |
| Percentage of Incomplete Backends | The percentage of total backends with incomplete setup or configuration. | Mean | Percentage |
| Percentage of Pending Backends | The percentage of total backends awaiting health check results. | Mean | Percentage |
| Percentage of OK Backends | The percentage of total backends that are functioning normally. | Mean | Percentage |
| Incomplete Backends | The number of backends with incomplete configuration or missing components. | Sum | Count |
| Pending Backends | The number of backends whose health checks are still initializing or pending results. | Sum | Count |
| Drained Backends | The number of backends that have been marked as drained. | Mean | Count |
| Percentage of Drained Backends | The percentage of total backends that are currently in a drained state. | Mean | Percentage |
Listener
These are the supported metrics for a Listener monitor:
| Metric name | Description | Statistics | Unit |
|---|---|---|---|
|
HTTP 200 Responses |
The number of HTTP 200 responses received from backend sets. |
Minimum |
Count |
|
HTTP 2xx Responses |
The number of HTTP 2xx responses received from backend sets. |
Minimum |
Count |
|
HTTP 3xx Responses |
The number of HTTP 3xx responses received from backend sets. |
Minimum |
Count |
|
HTTP 4xx Responses |
The number of HTTP 4xx responses received from backend sets. |
Minimum |
Count |
|
HTTP 502 Responses |
The number of HTTP 502 responses received from backend sets. |
Minimum |
Count |
|
HTTP 504 Responses |
The number of HTTP 504 responses received from backend sets. |
Minimum |
Count |
|
HTTP 5xx Responses |
The number of HTTP 5xx responses received from backend sets. |
Minimum |
Count |
|
Responses |
The number of incoming responses received from backend sets. |
Minimum |
Count |
Threshold configuration
To configure thresholds for a Load Balancer monitor:
- Log in to your Site24x7 account and navigate to Admin > Configuration Profiles > Threshold and Availability .
- Click Add Threshold Profile .
- Select OCI Load Balancer from the Monitor Type drop-down menu and provide an appropriate name in the Display Name field.
- The supported metrics are displayed in the Threshold Configuration section. You can set threshold values for all the metrics mentioned above.
- Click Save.
Status propagation in OCI Load Balancer monitors
Site24x7’s OCI Load Balancer integration supports status propagation for backend sets and listeners.
When status propagation is enabled:
- Alerts for backend sets and listeners are disabled by default.
- Status change alerts from child monitors are suppressed unless you set Skip Alert to No in the Edit Threshold page.
- A single alert is raised from the parent Load Balancer monitor.
This simplifies troubleshooting for load balancing issues.
Alerts are automatically disabled for child monitors that support status propagation.
For example, if a Backend Set becomes unhealthy, the parent Load Balancer monitor raises a single alert indicating a load balancing issue.
Licensing
- Each Load Balancer monitor utilizes one basic monitor license.
- Each Backend Set monitor utilizes one basic monitor license.
- The Listener monitor is a free monitor.
Viewing Load Balancer data
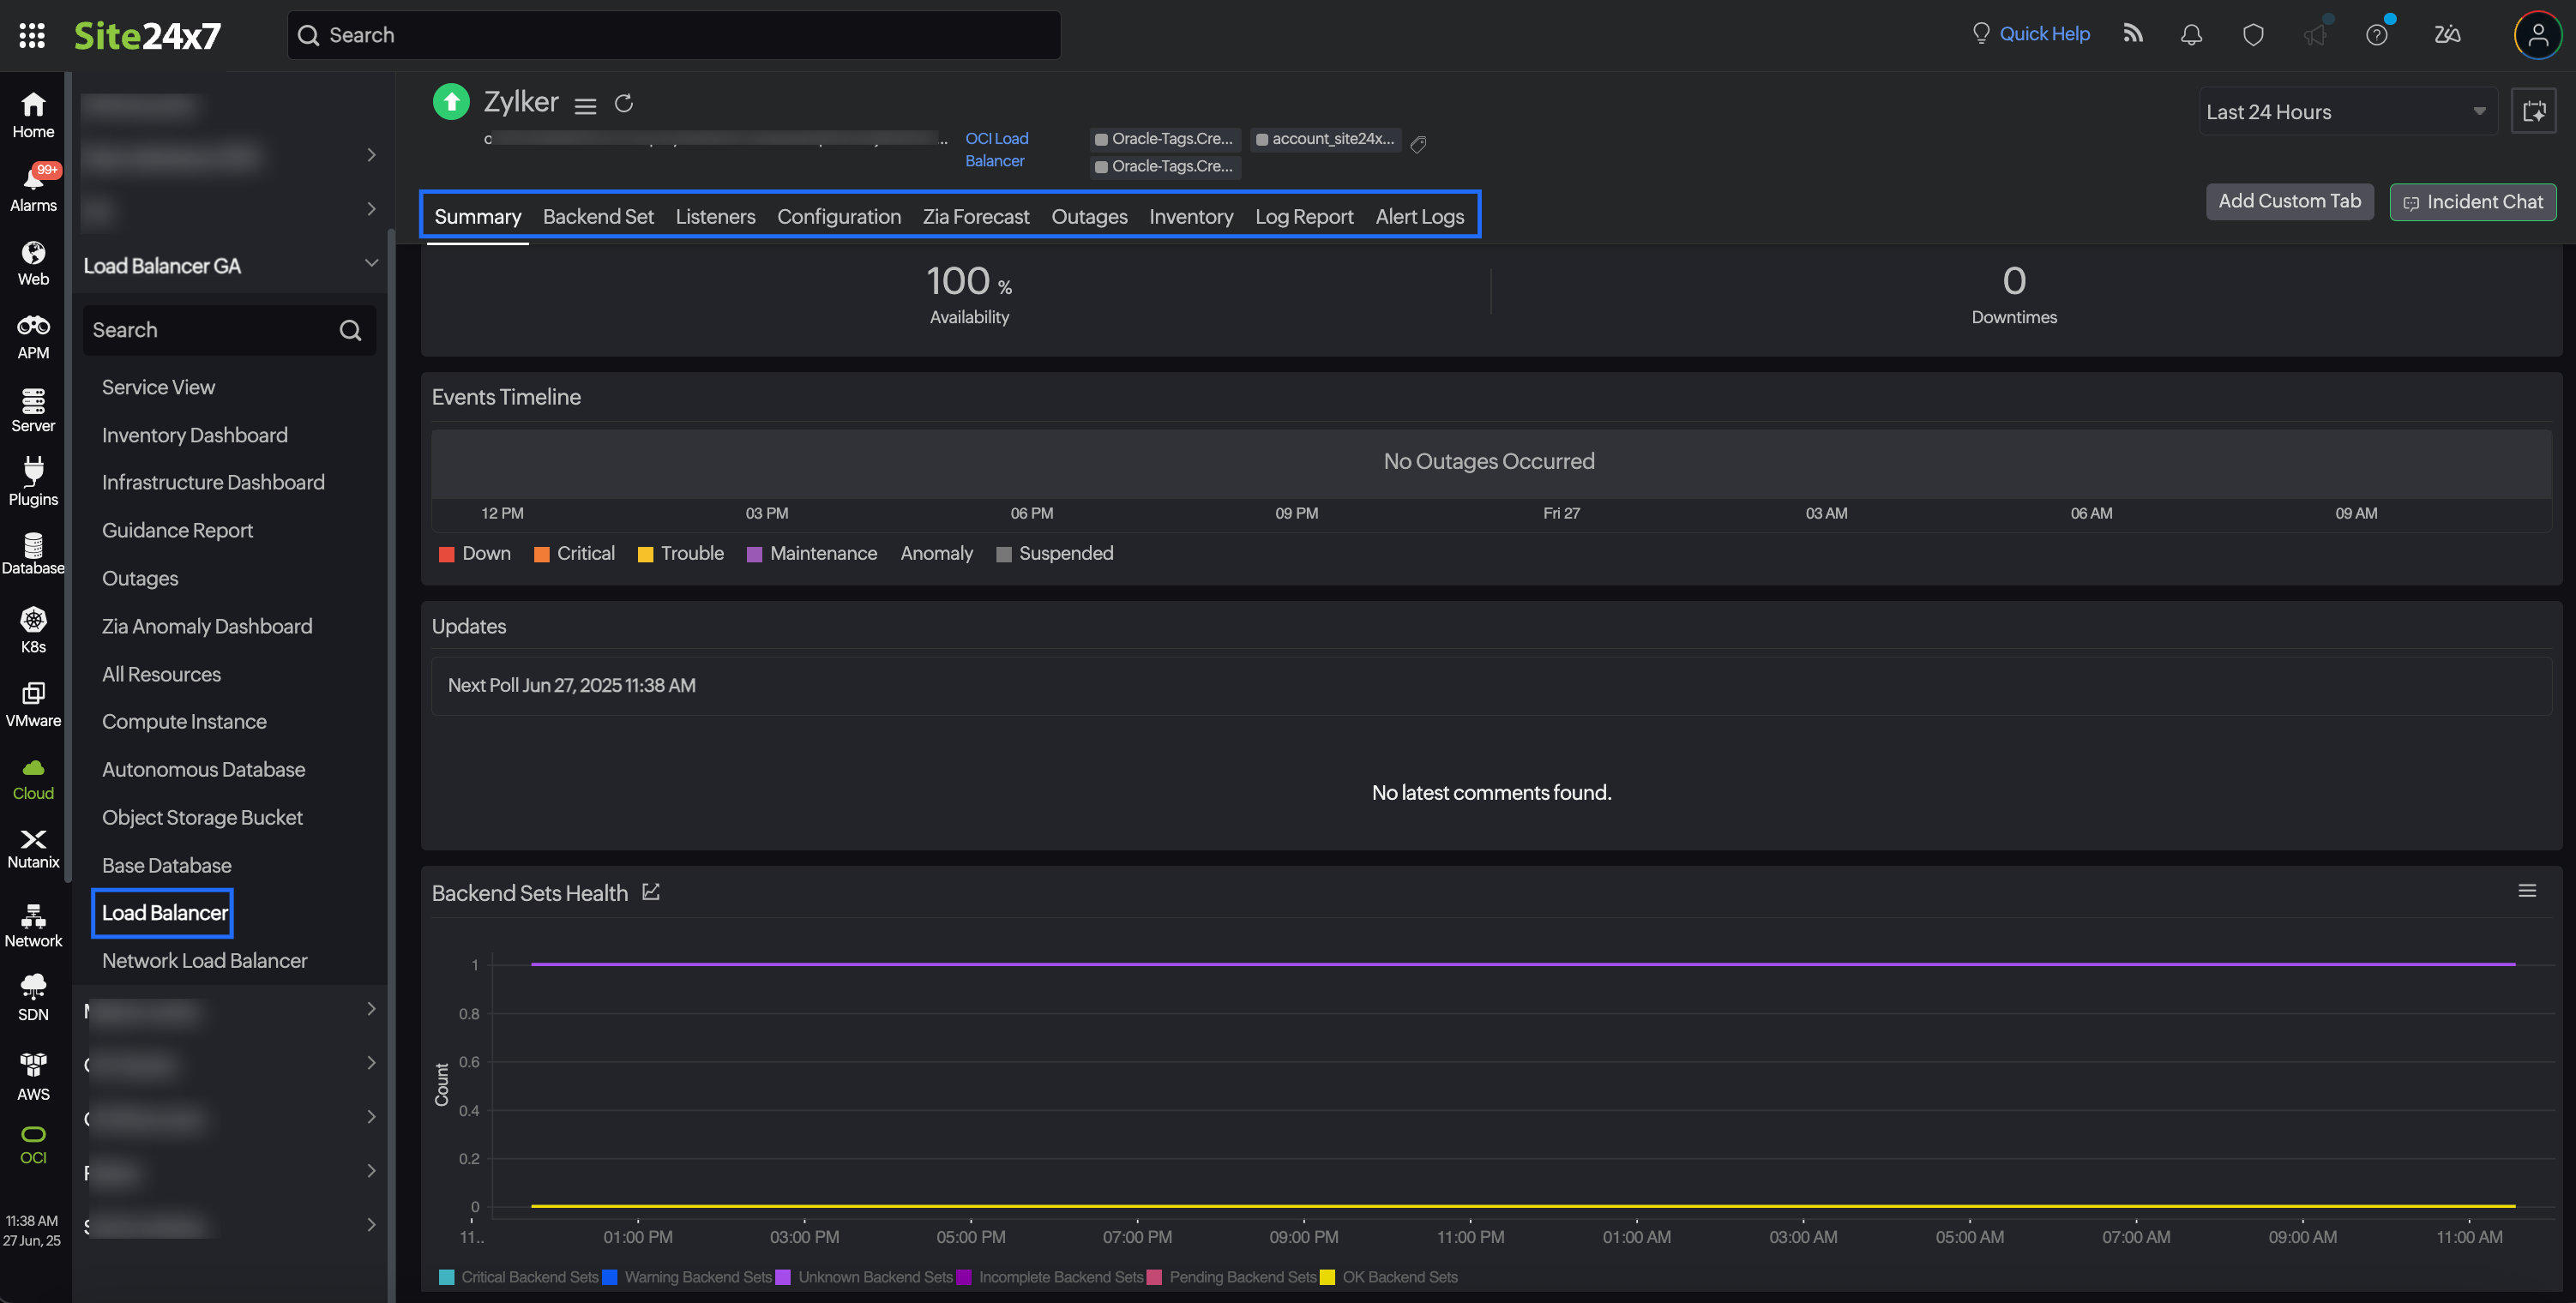
To monitor your Load Balancer environment, log in to your Site24x7 account and navigate to Cloud > OCI > Load Balancer.
Monitor data
Load Balancer
The monitor data for the Load Balancer monitor is given below.
Summary
The Summary tab provides an overview of the events timeline and metrics in the form of charts.
Listeners
The Listeners tab displays the Listeners Availability details and the list of Listener monitors associated with the Load Balancer monitor. Click the desired monitor name hyperlink to view the Listener monitor data.
Backend Set
The Backend Set tab displays the Backend Set Availability details and the list of Backend Set monitors associated with the Load Balancer monitor. Click the desired monitor name hyperlink to view the Backend Set monitor data.
WAF Firewall
The WAF Firewall tab shows the list of WAF monitors associated with your Load Balancer monitor. Click your preferred monitor name to view the the WAF monitor data
Configuration
View the basic configuration details about your Load Balancer monitor, such as Load Balancer Name, Region, Compartment ID, and OCID in the Configuration tab.
Zia Forecast
Estimate future values of the CPU Utilization, CPU Time, and Storage Utilization metrics with the Zia Forecast feature. Predict future points of these performance metrics (measurement of resource usage) based on historical observations and make informed decisions. Fifteen days of historical data is used to predict what your metric usage will be in the next seven days.
Outages
The Outages tab provides details on an outage's start time, end time, duration, and comments (if any).
Inventory
Obtain details like Load Balancer Name, Region, and Monitor Licensing Category from the Inventory tab. Set and view the Threshold and Availability Profile and the Notification Profile according to the user in this tab.
Log Report
The Log Report tab offers a consolidated report of the Load Balancer monitor's log status, which can be downloaded as a CSV file.
Alert Logs
The Alert Logs tab displays a chronological list of all triggered alerts related to the Load Balancer monitor. This tab helps you trace alert history and severity to assess issues and validate threshold settings.
Backend Set
The monitor data for the Backend Set monitor is given below.
Summary
The Summary tab provides an overview of the events timeline and metrics in the form of charts. You can also view the Backends Health details in this tab.
Configuration
View the basic configuration details about your Backend Set monitor, such as Load Balancer Name, Overall Health, Region, and Policy, in the Configuration tab. In addition to this, Health Check Configuration details are also provided in this tab.
Backends
The Backends tab displays Backends Details such as IP Address, Port, and Weight. You can filter the resources with options such as IP Address, Port, and Weight .
Outages
The Outages tab provides details on an outage's start time, end time, duration, and comments (if any).
Inventory
Obtain details like Load Balancer Name, Region, and Monitor Licensing Category from the Inventory tab. Set and view the Threshold and Availability Profile and the Notification Profile according to the user in this tab.
Log Report
The Log Report tab offers a consolidated report of the Backend Set monitor's log status, which can be downloaded as a CSV file.
Alert Logs
The Alert Logs tab displays a chronological list of all triggered alerts related to the Backend Set monitor. This tab helps you trace alert history and severity to assess issues and validate threshold settings.
Listener
The monitor data for the Listener monitor is given below.
Summary
The Summary tab provides an overview of the events timeline and metrics in the form of charts.
Configuration
View the basic configuration details about your Listener monitor, such as Load Balancer Name, Overall Health, Region, and Policy, in the Configuration tab.
Outages
The Outages tab provides details on an outage's start time, end time, duration, and comments (if any).
Inventory
Obtain details like Load Balancer Name, Region, and Monitor Licensing Category from the Inventory tab. Set and view the Threshold and Availability Profile and the Notification Profile according to the user in this tab.
Log Report
The Log Report tab offers a consolidated report of the Listener monitor's log status, which can be downloaded as a CSV file.
Alert Logs
The Alert Logs tab displays a chronological list of all triggered alerts related to the Listener monitor. This tab helps you trace alert history and severity to assess issues and validate threshold settings.