Forwarding logs using TCP or UDP
When applications do not write logs to the local disk, they transmit log data directly over the network using a designated port. For such setups, TCP or UDP log forwarding is used to receive and collect logs in real time. This approach enables seamless log ingestion from sources that generate logs exclusively through network-based transmission rather than file-based logging.
This feature is currently enabled on demand only. Please contact our support team to activate it.
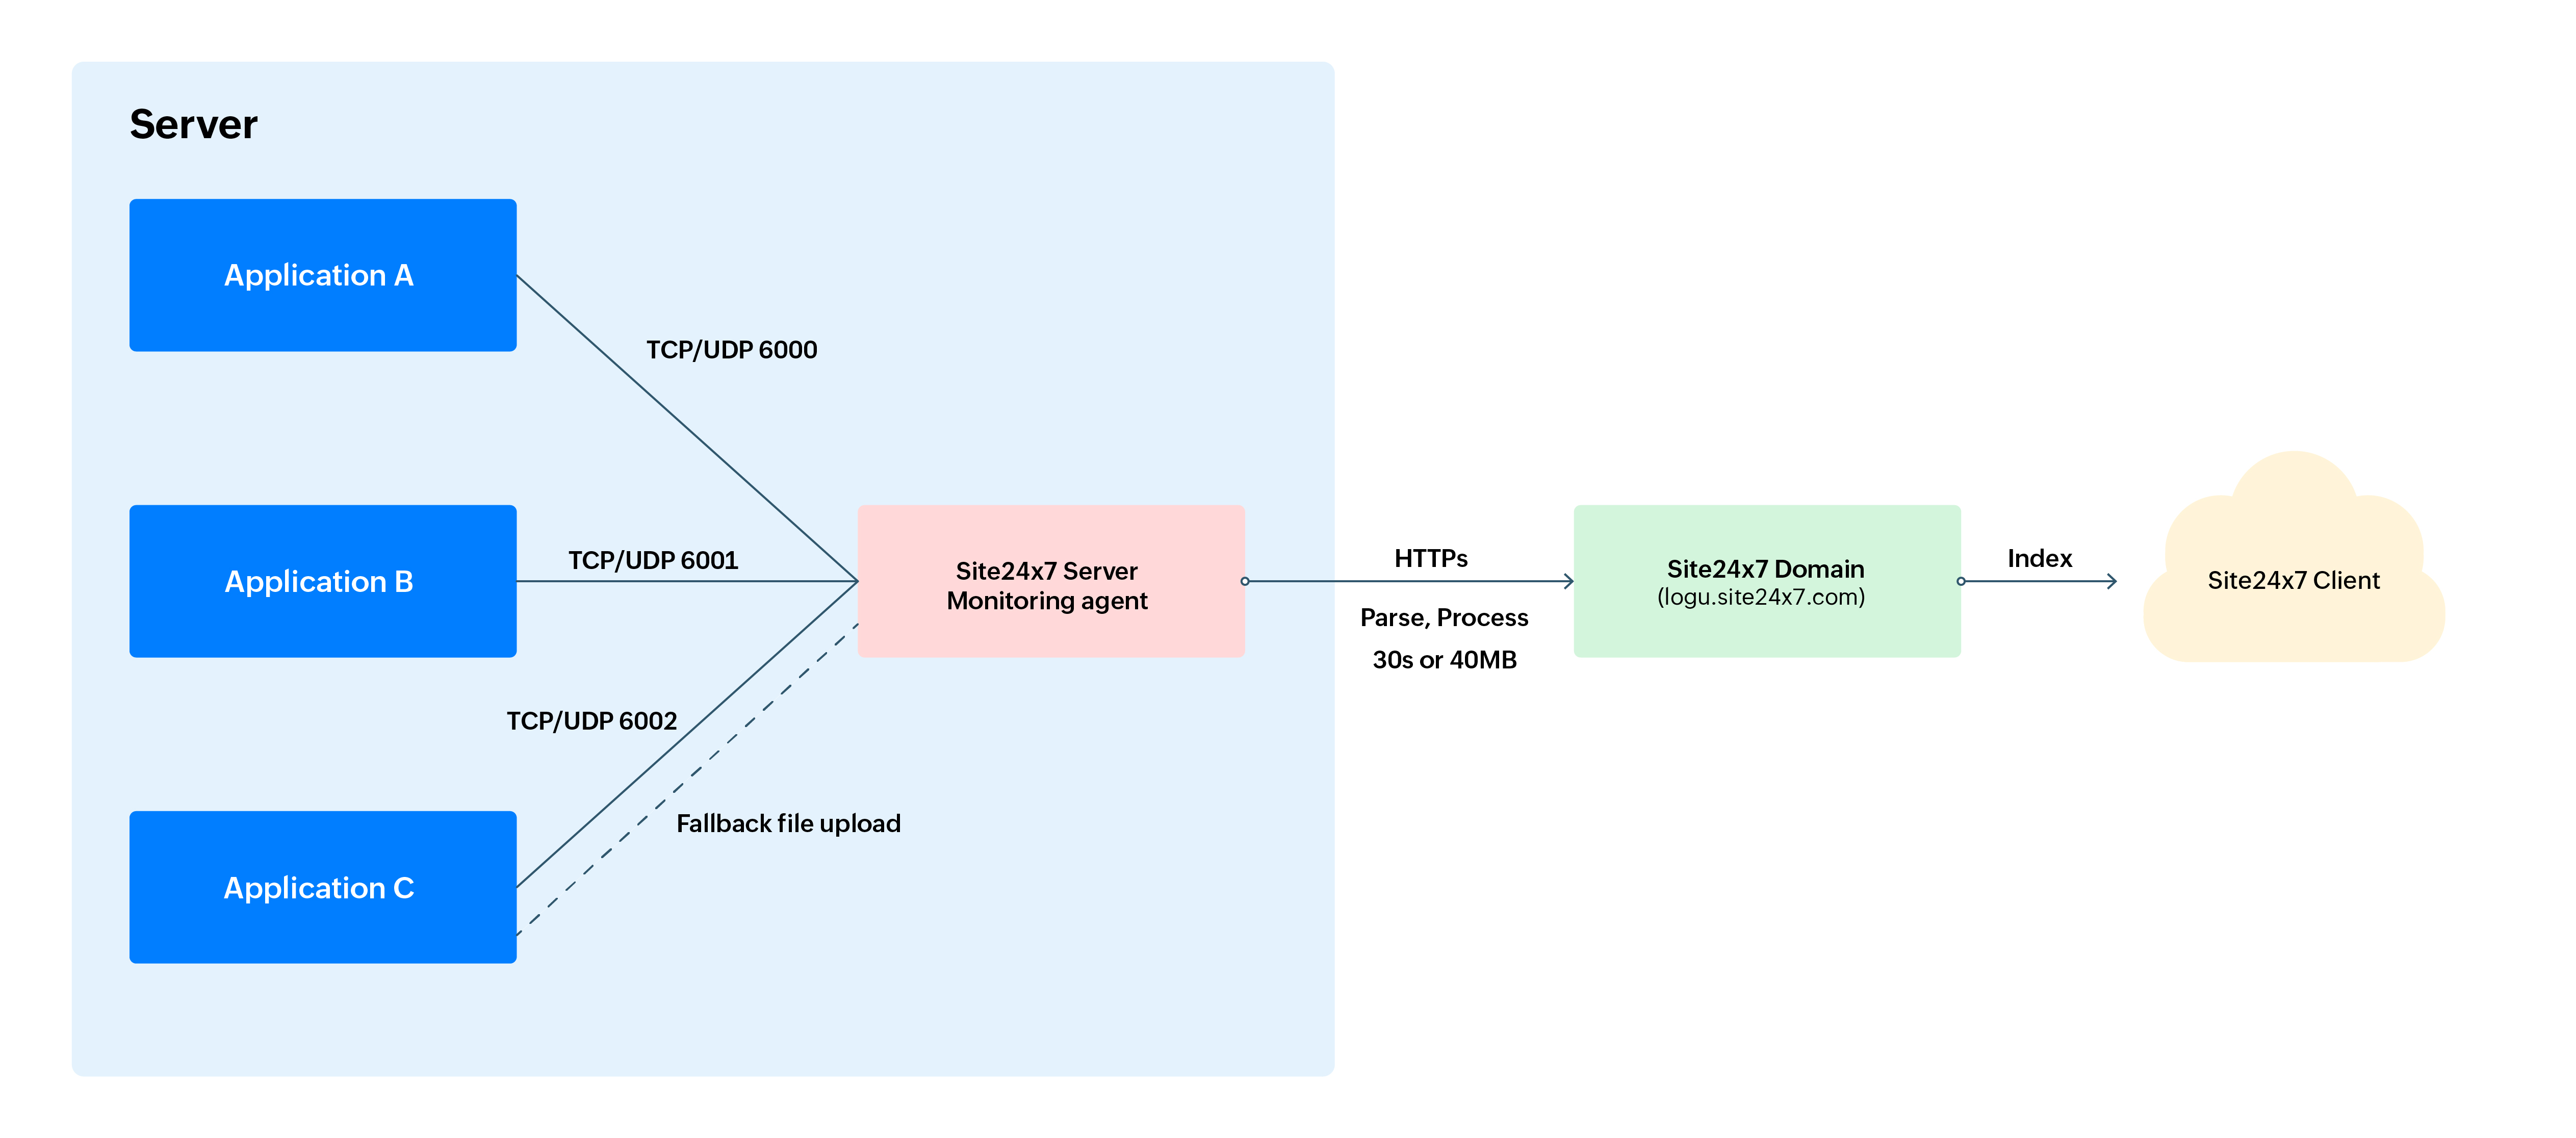
The following flow diagram illustrates the process of sending logs from applications to the Site24x7 Client via the Site24x7 Server Monitoring agent using TCP/UDP protocols.

Brief explanation of the flow diagram
- Log sources (Applications A, B, and C): Logs generated by various applications running on the server send logs to the Site24x7 Server Monitoring agent using designated ports (e.g., 6000, 6001, 6002) over TCP/UDP protocols.
- Site24x7 Server Monitoring agent: The Site24x7 Server Monitoring agent receives logs from the applications. It processes and parses the logs in chunks, and sends them to the Site24x7 server either every 30 seconds or when the log size reaches 40 MB.
- Fallback mechanism: In case of connectivity issues or failures in log transmission via TCP/UDP to the Server Monitoring agent, your application should store the logs in a flat file as a part of a fallback upload mechanism. This option is recommended when logs cannot be transmitted immediately due to network issues or disruption in communication. Uploads will regularly occur, and once the network connection is restored, the logs will be sent via the designated port.
- Transmission to Site24x7 upload domain: Logs are securely sent from the Site24x7 Server Monitoring agent to the Site24x7 domain (For example, US DC - logu.site24x7.com) via HTTPS for further processing.
- Indexing and Client Access: The logs are indexed in the Site24x7 system for analysis and visualization. The indexed data is made available to the Site24x7 Client for monitoring, alerting, and reporting purposes.
Getting started
- Log in to your Site24x7 account.
- Download and install the Site24x7 Server Monitoring agent (Windows | Linux).
Create a log type
Once you install the Server Monitoring agent, you can create custom log types and define them by using the steps below:
- Go to Admin > AppLogs > Log Types > Add Log Type.
- Display Name: Enter a display name.
- Search Retention (days): You can choose from the predefined Search Retention (days) options, 7, 15, 30, 60, or 90, to retain your logs. This setting specifies the number of days the collected log data will be stored and available for search in Site24x7. Know more.
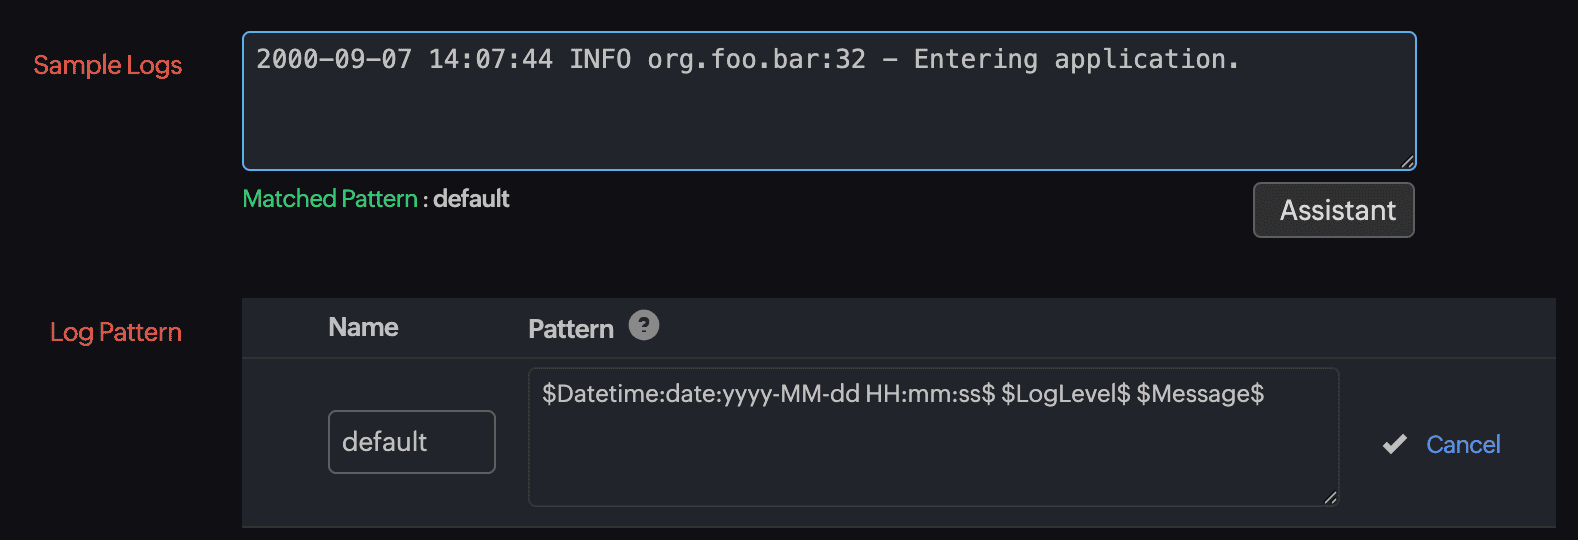
- Sample Logs: Provide sample log lines to discover the log pattern. Below is a sample log line:
2000-09-07 14:07:44 INFO org.foo.bar:32 - Entering application.

- Log Pattern: Log Pattern is the format in which Site24x7 parses your logs. This can be customized as per your requirements. Below is a log pattern:
$DateTime:date$ $LogLevel$ $ClassName$:$Line:number$ $Message$
Once you define the Pattern and enter the Name, click the tick ✓ icon to save the pattern.

- Finally, click Save and associate it with a Log Profile. You can start searching your logs.
Associate it with the log profile
A Log Profile enables you to associate the log types with a particular set of servers. To associate a log profile follow the steps below:
- Go to Admin > AppLogs > Log Profile > Add Log Profile
- Profile Name: Enter a name for your Log Profile.
- Choose the Log Type: Choose the Log Type you would like to associate with this profile.
- Log Source: Choose where your logs are located. You can select from the available sources in the drop-down menu. To send logs through TCP/UDP, select the TCP/UDP Protocol from the menu. Once you choose TCP/UDP Protocol, the following fields will appear:
- Protocol: Toggle between TCP and UDP to determine your preferred transmission protocol.
- Port: UDP default port is 514. You can specify the port number where the logs should be received.
- Failover File Path: This option is recommended if logs cannot be transmitted immediately due to network issues or Site24x7 Sever agent unavailability.
Refer to the log ingestion documentation to find various methods of importing logs into Site24x7.
- Associate this log profile with these servers: Select a server to associate with this profile. This associates the Log Type under a profile with a particular server.
- Associate this log profile with all the monitors in these monitor groups: Choose a monitor group to associate with. This associates the Log Type under a profile with a particular monitor group.

- Click Save.
- To begin your log search, go to the left navigation and click AppLogs. Type your log type name in the search bar, which displays the logs collected via TCP or UDP.
