Squid proxy logs
Squid is a high performance proxy caching server for web clients that supportsP, Gopher, and HTTP data objects. It reduces bandwidth and enhances response times by caching and reusing frequently requested webpages. Site24x7 AppLogs natively supports Squid proxy logs.
Getting started
1. Log in to your Site24x7 account.
2. Download and install the Site24x7 Server Monitoring agent (Windows | Linux).
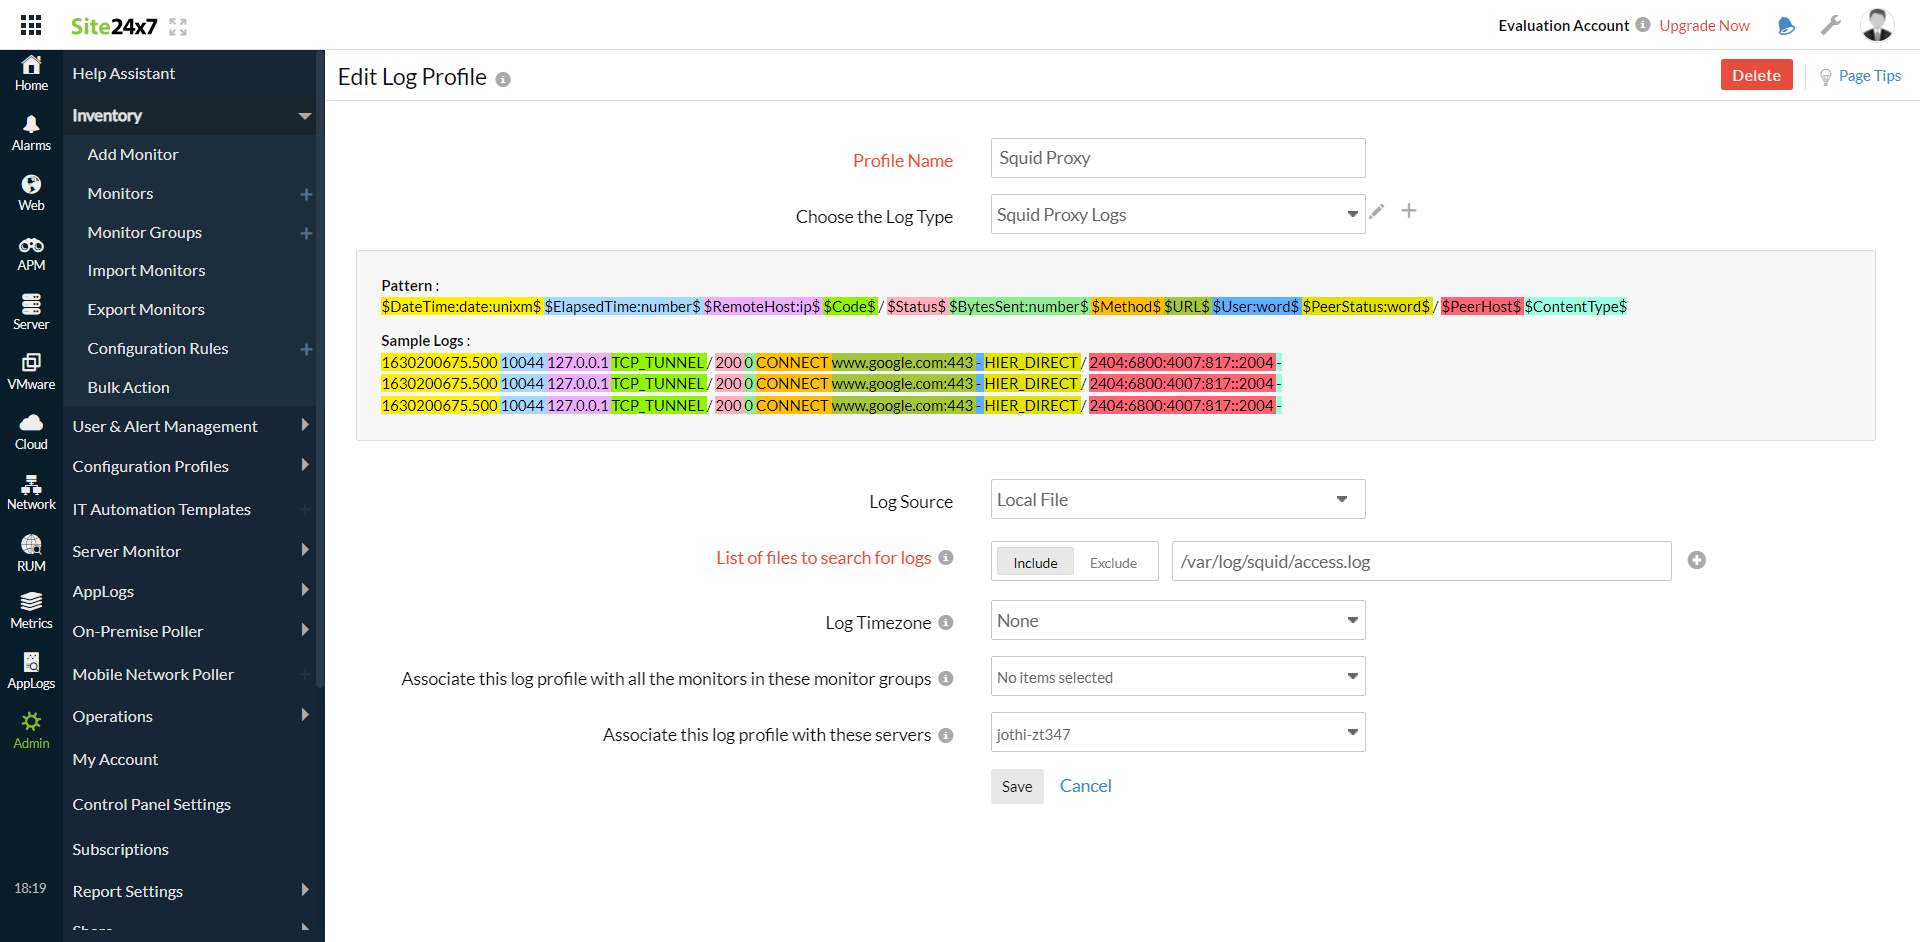
3. Go to Admin > AppLogs > Log Profile and select Add Log Profile.
4. Enter the Profile Name.
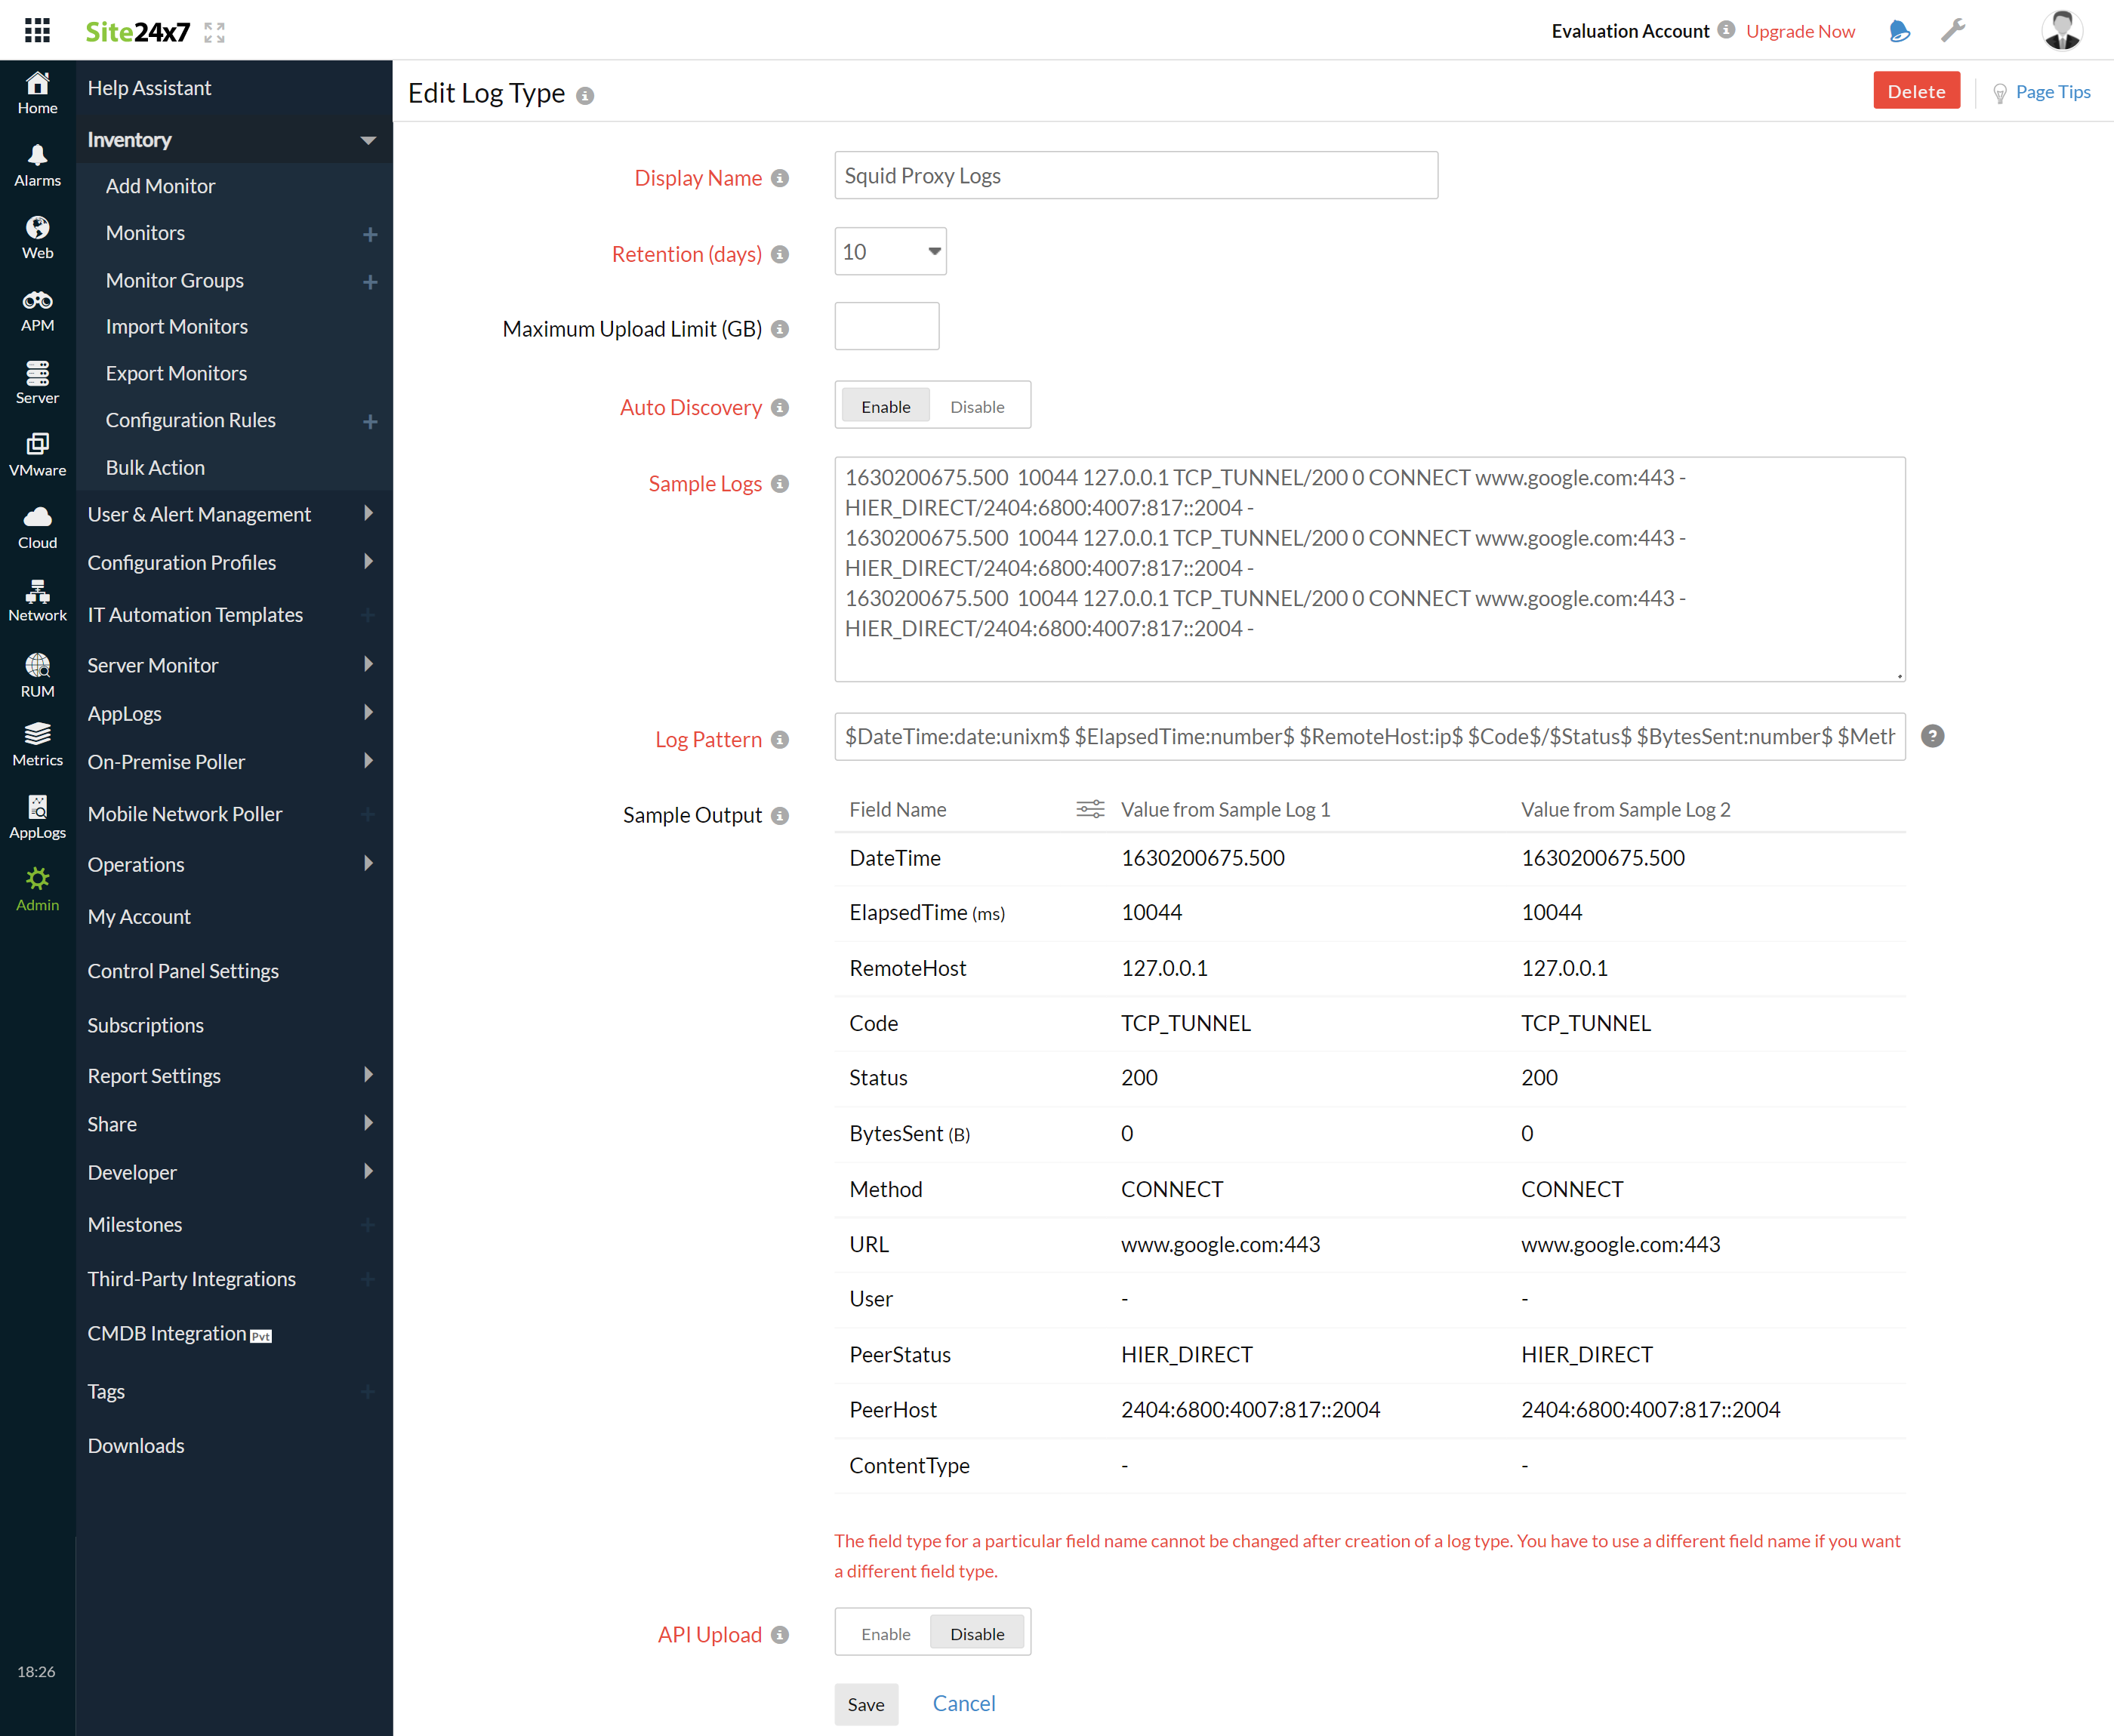
5. Select Squid Proxy Logs from the Choose the Log Type drop-down list.
- The Pattern and Sample Logs are displayed below.
Sample Logs:
1630200675.500 10044 127.0.0.1 TCP_TUNNEL/200 0 CONNECT www.google.com:443 - HIER_DIRECT/2404:6800:4007:817::2004 -
1630200765.663 14961 127.0.0.1 TCP_MISS/503 4226 GET http://you/ - HIER_NONE/- text/html
1630200765.735 0 127.0.0.1 TCP_MISS/503 4185 GET http://you/favicon.ico - HIER_NONE/- text/html
This log is separated into fields, each of which takes its respective value and is then uploaded to Site24x7. - By default, this is the log pattern identified by Site24x7 AppLogs for Squid proxy logs:
$DateTime:date:unixm$ $ElapsedTime:number$ $RemoteHost:ip$ $Code$/$Status$ $BytesSent:number$ $Method$ $URL$ $User:word$ $PeerStatus:word$/$PeerHost$ $ContentType$ - You can also add a custom Log Pattern instead of the default one. To do so, click the pencil icon and specify your pattern. Additionally, provide three examples for us to understand and query your custom Log Pattern.

6. Select the Local File as the Log Source.
7. By default, the paths below are used as the file sources:
Linux : /var/log/squid/access.log
- If your source path is different from the default path, specify it in the List of files to search for logs field.
8. Select either monitors or monitor groups to collect the logs.

9. Click Save.
Dashboard
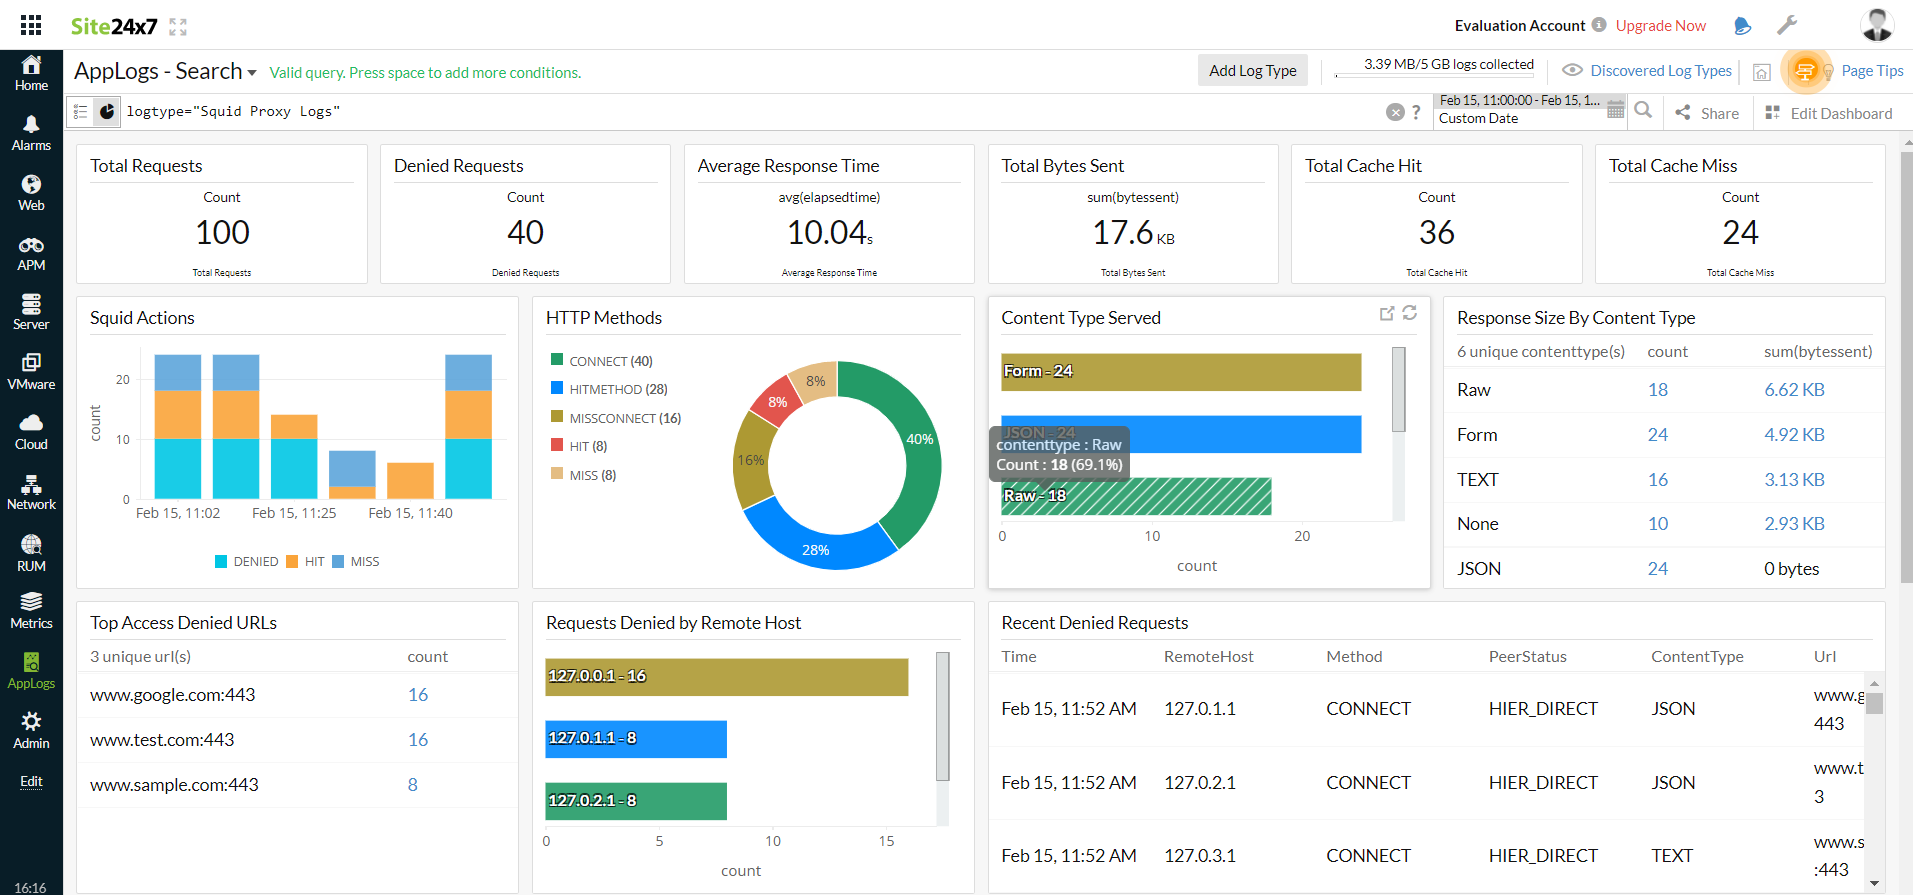
AppLogs creates an exclusive dashboard for every Log Type and shows a few widgets by default. Here's a list of the widgets available on the Squid proxy log dashboard:
- Total Requests
- Denied Requests
- Average Response Time
- Total Bytes Sent
- Total Cache Hit
- Total Cache Miss
- Squid Actions
- HTTP Methods
- Content Type Served
- Response Size By Content Type
- Top Access Denied URLs
- Requests Denied Remote Host
- Recent Denied Requests

Related log types
-
On this page
- Getting started
- Dashboard
- Related log types
