Log Usage Summary
The Log Usage Summary gives you a comprehensive view of your log usage (total and daily usage) based on your monthly subscription to Site24x7 AppLogs. This helps you analyze the usage patterns, manage log usage, and plan your log add-ons accordingly.
Log Usage Summary
To view the Log Usage Summary:
- Log in to your Site24x7 account.
- Click AppLogs from the left panel.
- You can access the Log Usage Summary by using one of the following navigation options:
- Click on the logs usage bar located in the top-right corner, next to the Add Log Type button.
- Alternatively, you can click AppLogs - Search and choose Log Usage Summary in the top-left corner.
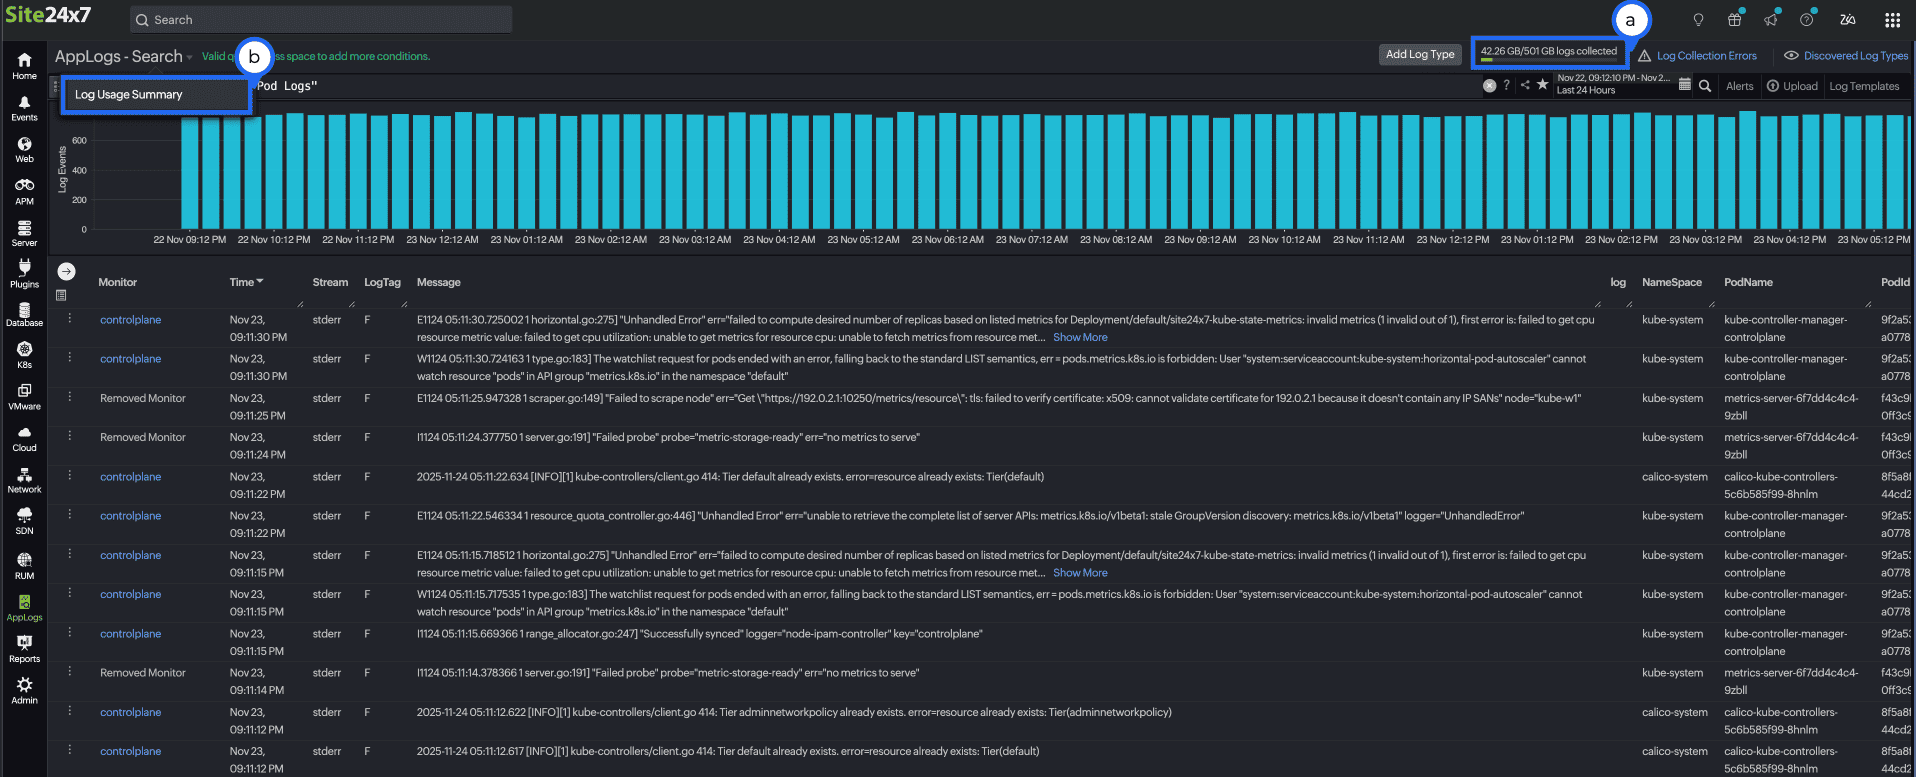
On the summary page, you can check the following:
- Total Logs Usage: Displays the overall log usage circular chart, the center displays the total log usage size (example: 501 GB). The inner circles represent the total percentages of used (green colored) and remaining logs, while the outer circle illustrates the retention level breakdown of the used (green colored) and remaining percentage.
- Total Logs Usage by Search Retention: Displays a horizontal bar chart based on the log usage categorized by retention periods (7, 15, 30, 60, or 90 days). Each bar represents the volume of both actual and billable log data consumed within the specific retention period.
- Total Storage Retention by Log Types: Displays a detailed bar chart illustrating which log types are utilizing the log storage (six months, one, two, three, four, or five years). Each bar represents the volume of both actual and billable log storage consumed within the specific retention period.
- Total Logs Usage by Log Types: Displays a detailed bar chart listing which log types consume the most space. You can hover on any of the listed log types to get the billed and actual size of the log type.
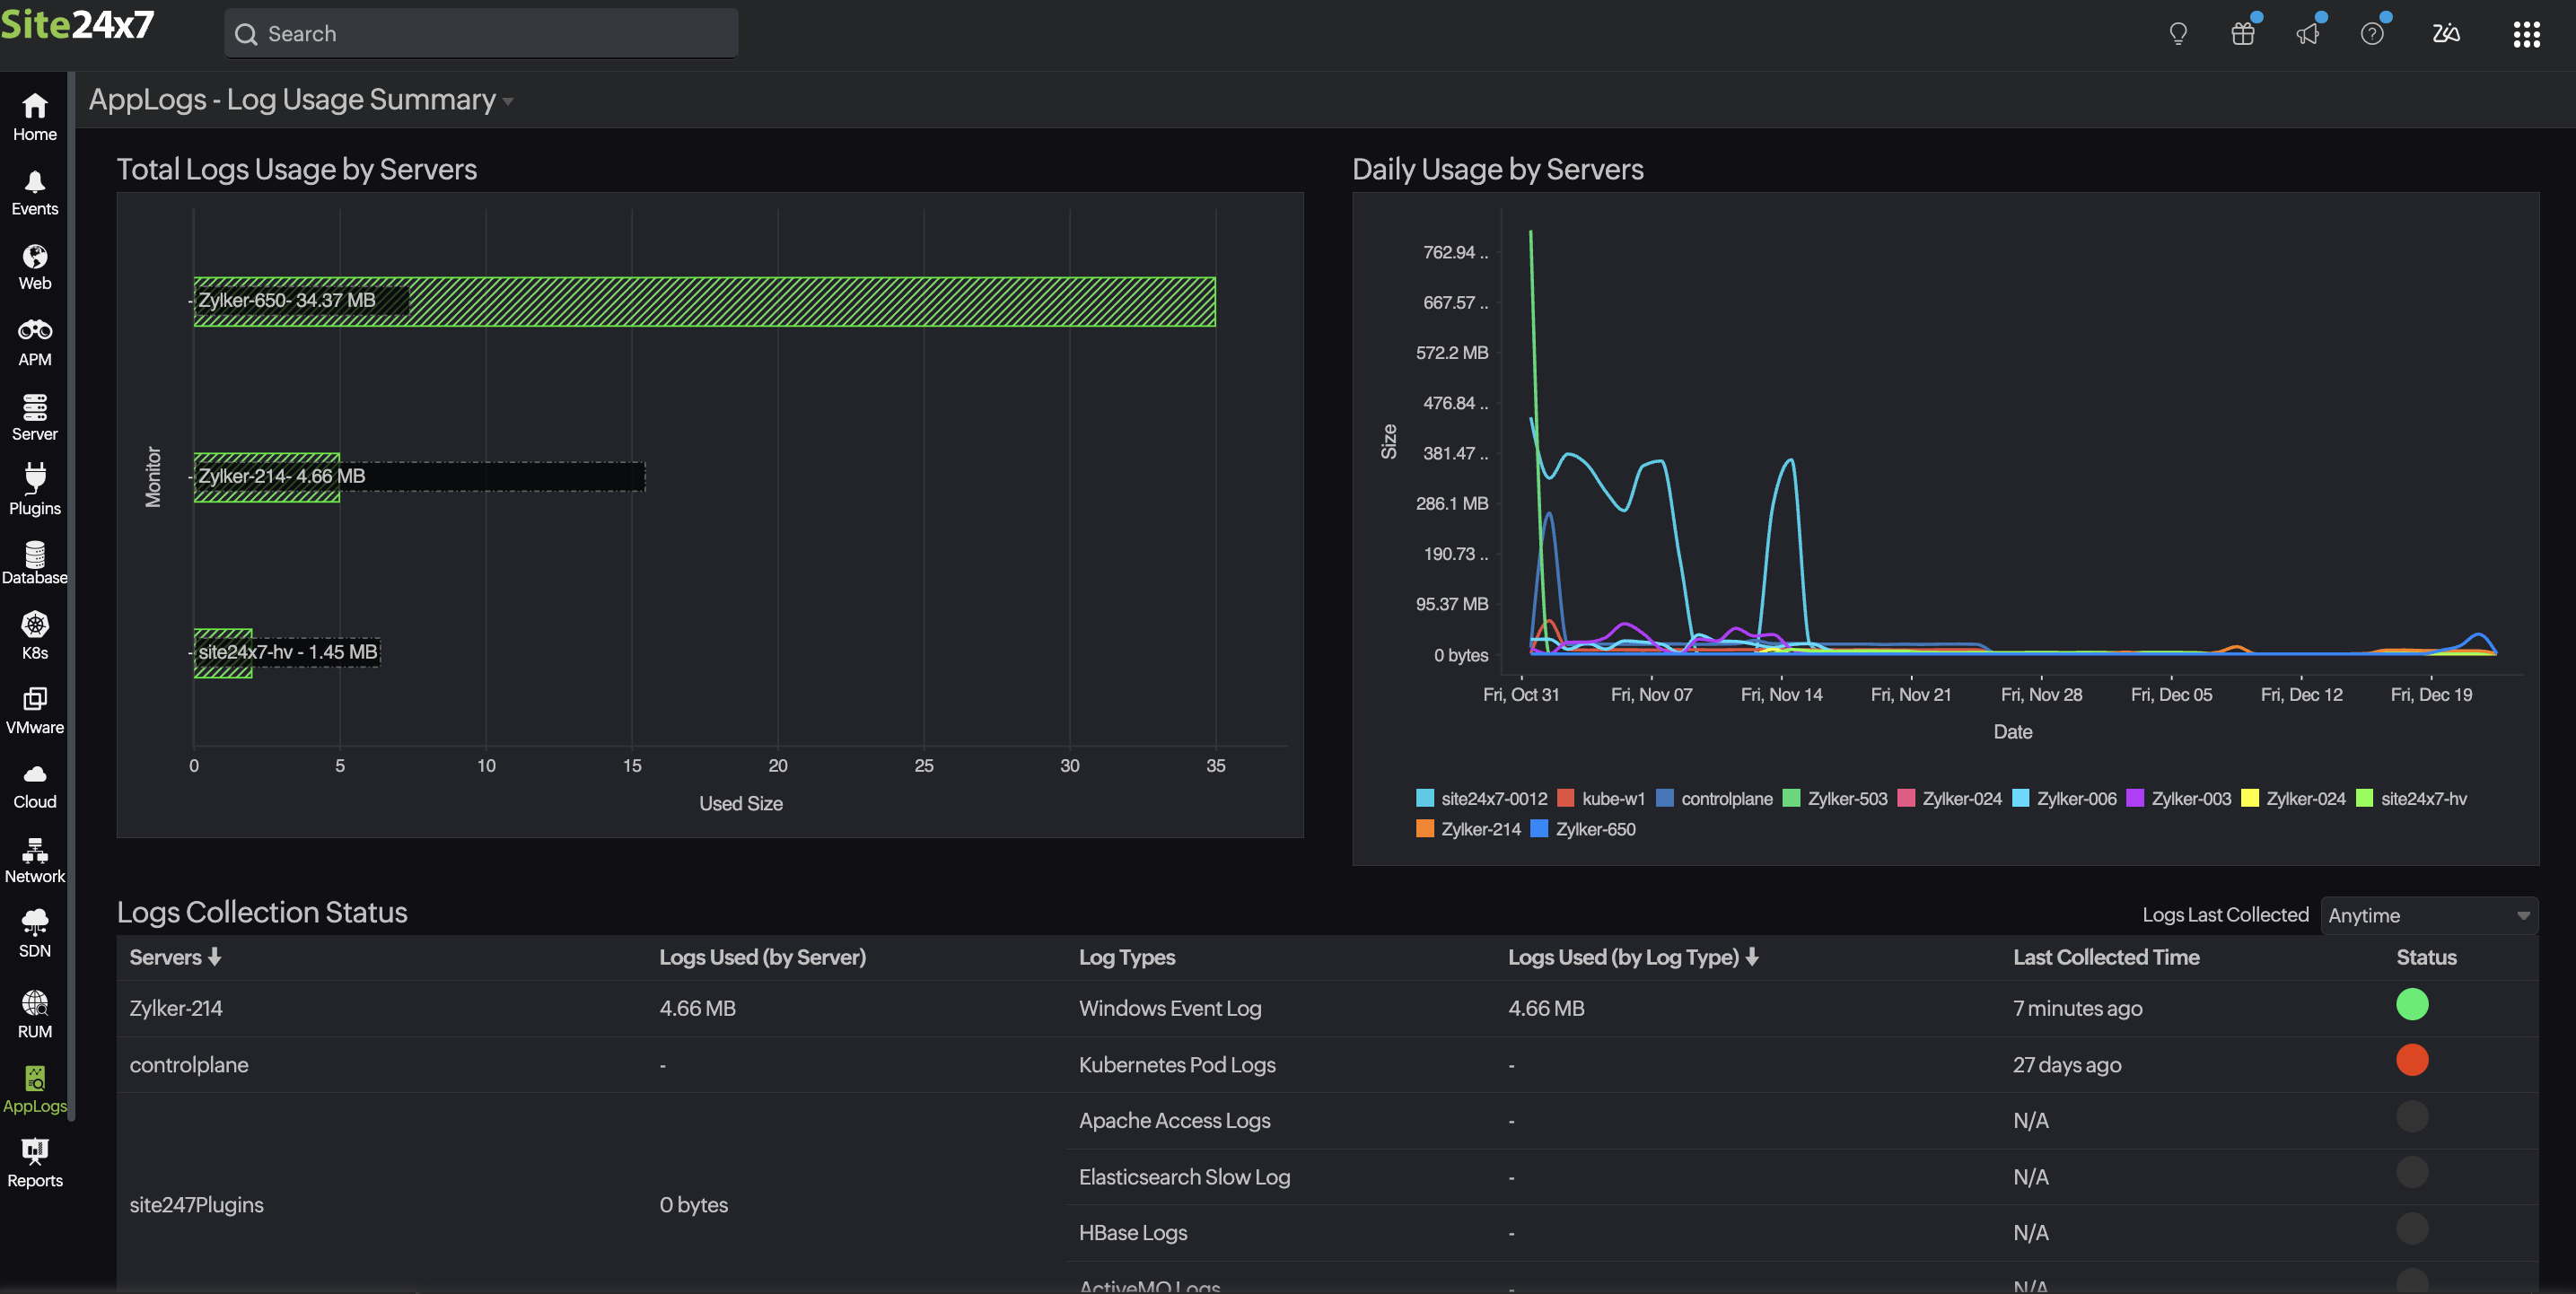
- Total Logs Usage by Servers: Displays a horizontal bar chart showing the log data uploaded by each server. Both the billed size and actual size are clearly indicated, helping you identify which servers generate the most logs.
- Daily Usage: Displays a line graph showing daily log usage over a selected period. The peaks and troughs indicate days with higher and lower log consumption, respectively.
- Daily Usage by Log Types: Displays a line graph representing daily usage across different log types, each shown in a distinct color. This helps you understand which log types contribute to usage trends on specific dates.
- Daily Usage by Servers: Displays a line graph representing daily usage across different servers, each shown in a distinct color. This helps you understand server-specific log activity over time.
- Logs Collection Status: Displays a table summarizing the log collection status across different servers.
Attribute Description Servers Displays the list of server names. Logs Used (by Server) Displays the total log size used by the server. Log Types Displays the list of log types that are collected from each server name, aligned. Logs Used (by Log Type) Displays the total log size used by the log type. Last Collected Time Displays the last time the logs were collected. Status Displays whether the log collection is active (green) or if there is any issue (other colors). - Logs Last collected: You can filter logs based on the last collected log time. By default, the filter is set to Anytime (Select All). You can choose from the following time ranges:
- Green: Collected Less than 15 mins ago
- Yellow: Collected Less than one hour ago
- Orange: Collected Less than one day ago
- Bright red: Collected Less than five days ago
- Red: Collected Before five days
You can select a color-coded range to filter it based on the log collection time.
With the above data, you can:
- View the Next Reset Time under Total Logs Usage.
- Visualize the log usage pattern over the last 60 days using Daily Usage charts.
- Figure out which log types or servers are consuming more space.
- View the log collection status based on the Logs Last Collected drop-down.
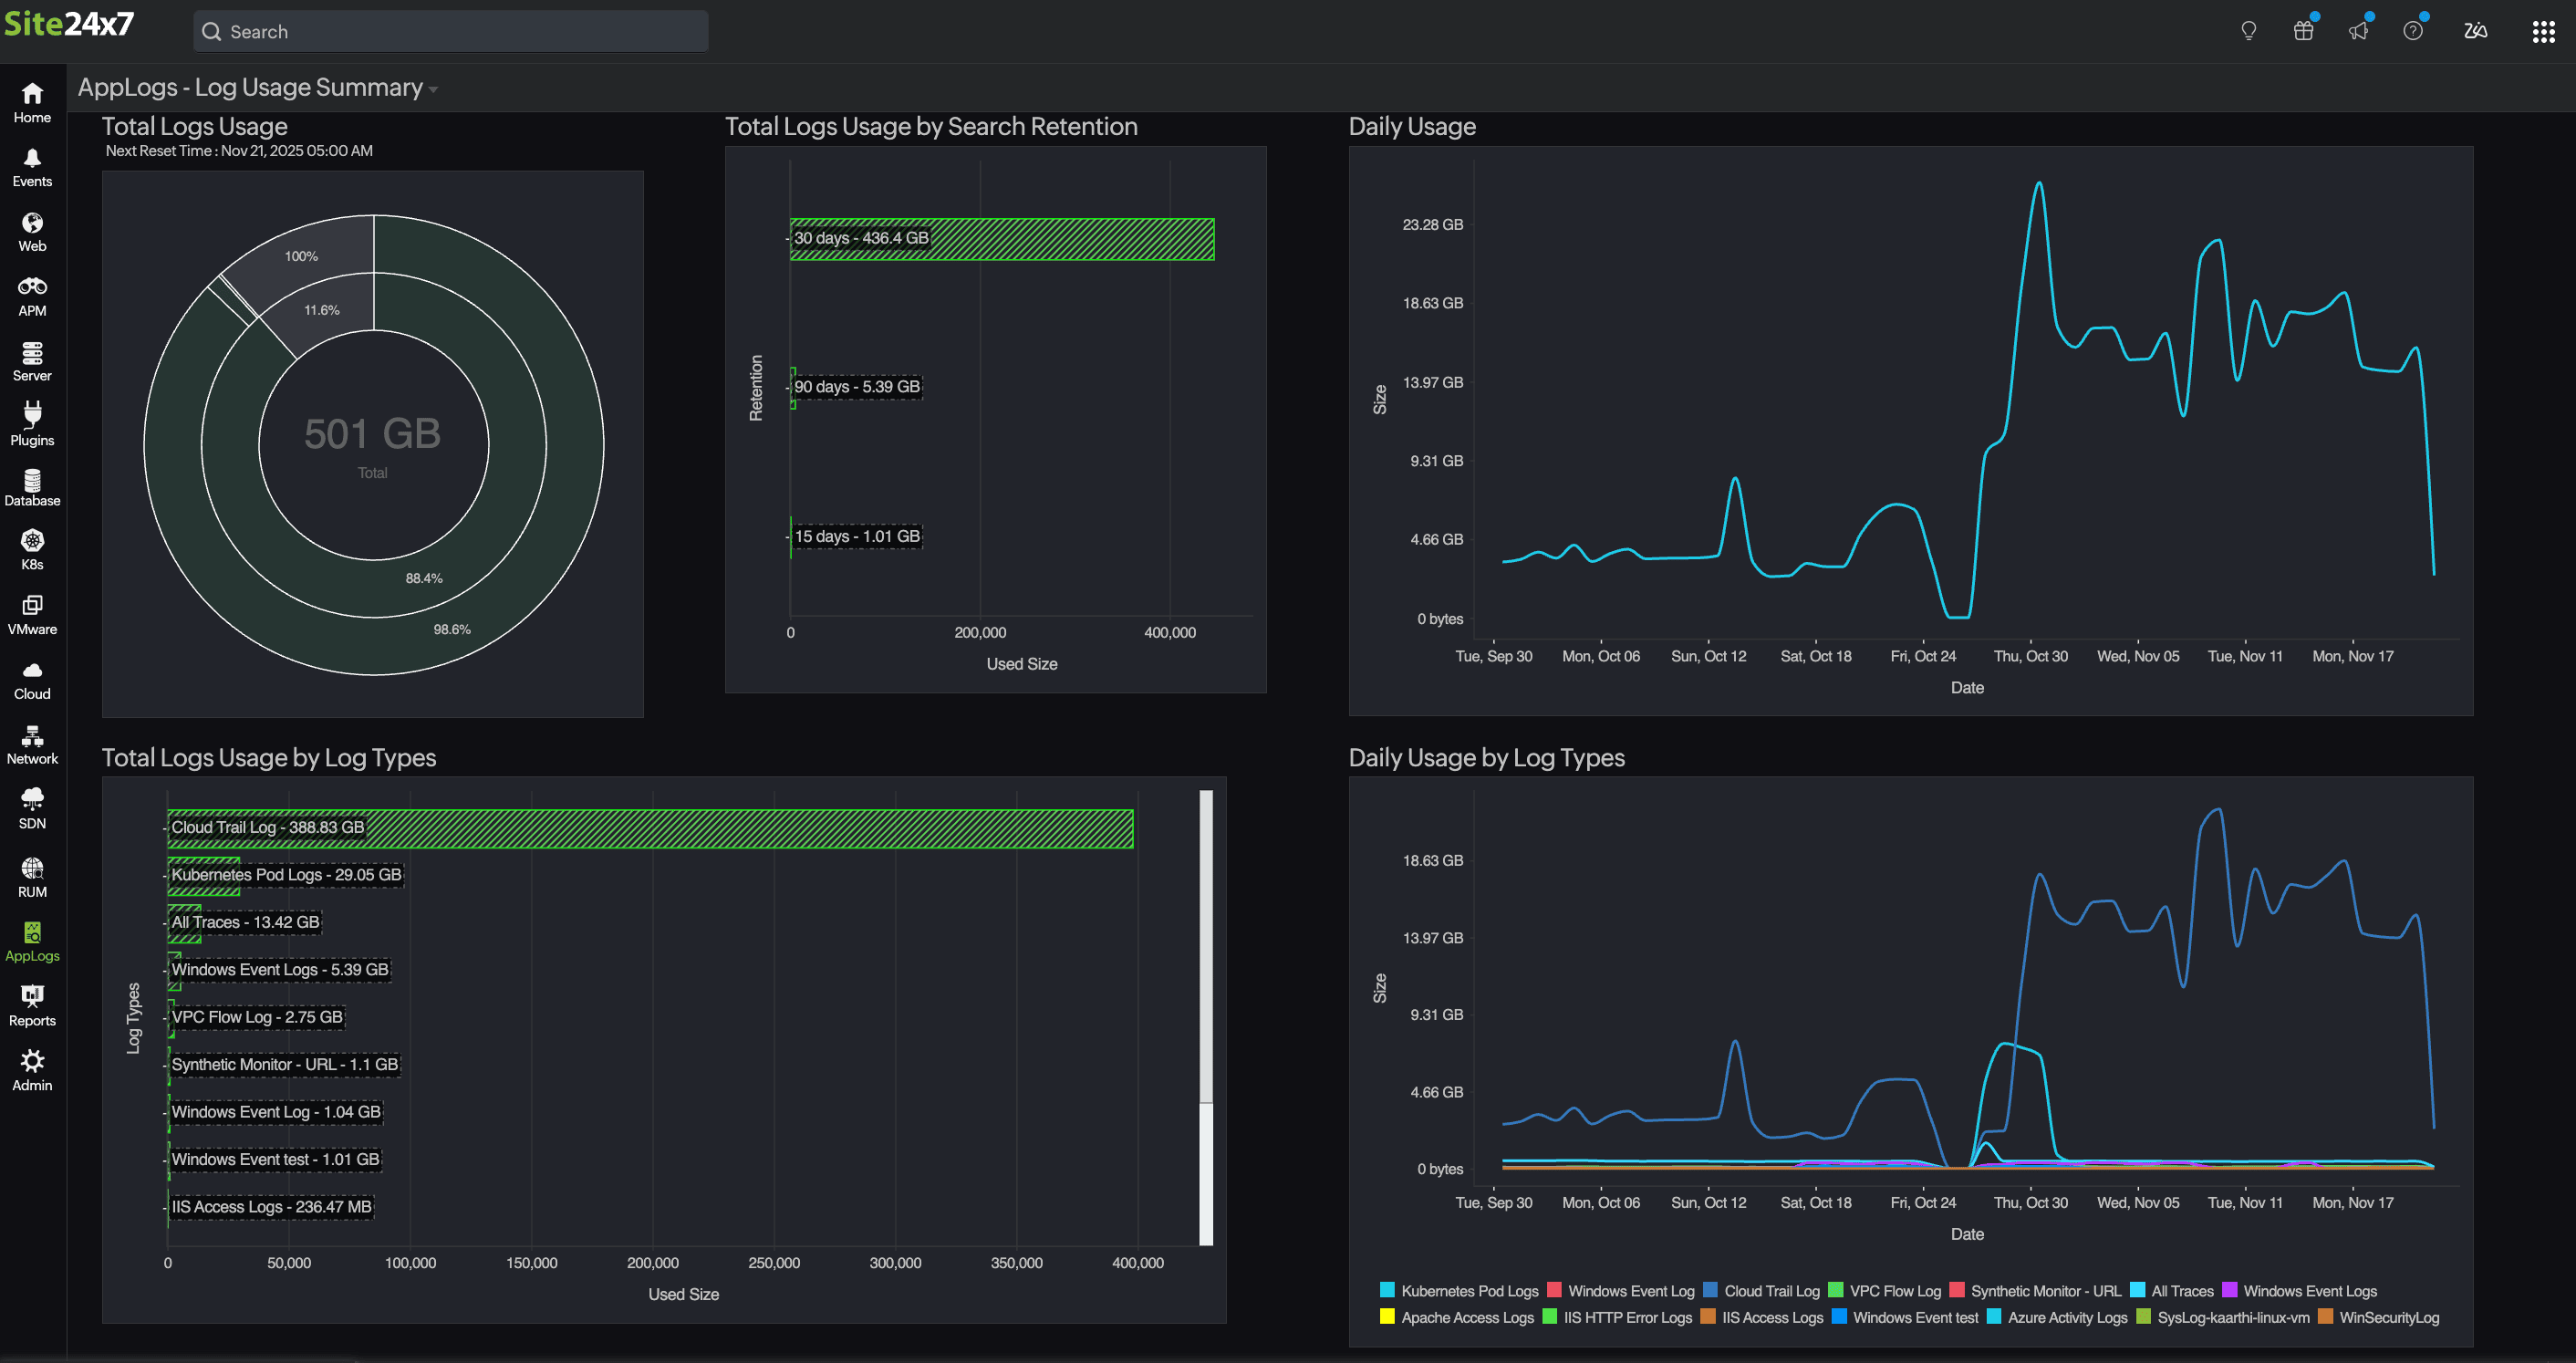
The main Daily Usage chart shows your overall log volume for each day. To see how that volume breaks down:
- By log type, check the Daily Usage by Log Types chart.
- By server, check the Daily Usage by Servers chart.
Use case
When you notice a sudden spike in the Daily Usage chart, for example, log volume jumping from 4GB to 12GB in a single day, you may want to understand what caused it. By checking the Daily Usage by Log Types chart, you might see that CloudTrail Logs increased sharply to 9GB while Kubernetes Pod Logs stayed around their usual 3GB. This tells you the spike is primarily due to CloudTrail activity.
To pinpoint the source, you then look at the Daily Usage by Servers chart, where you may find that one specific AWS account or server generated most of those CloudTrail logs. In this way, the three views together help you understand not just that a spike occurred, but which log type caused it and where it originated.
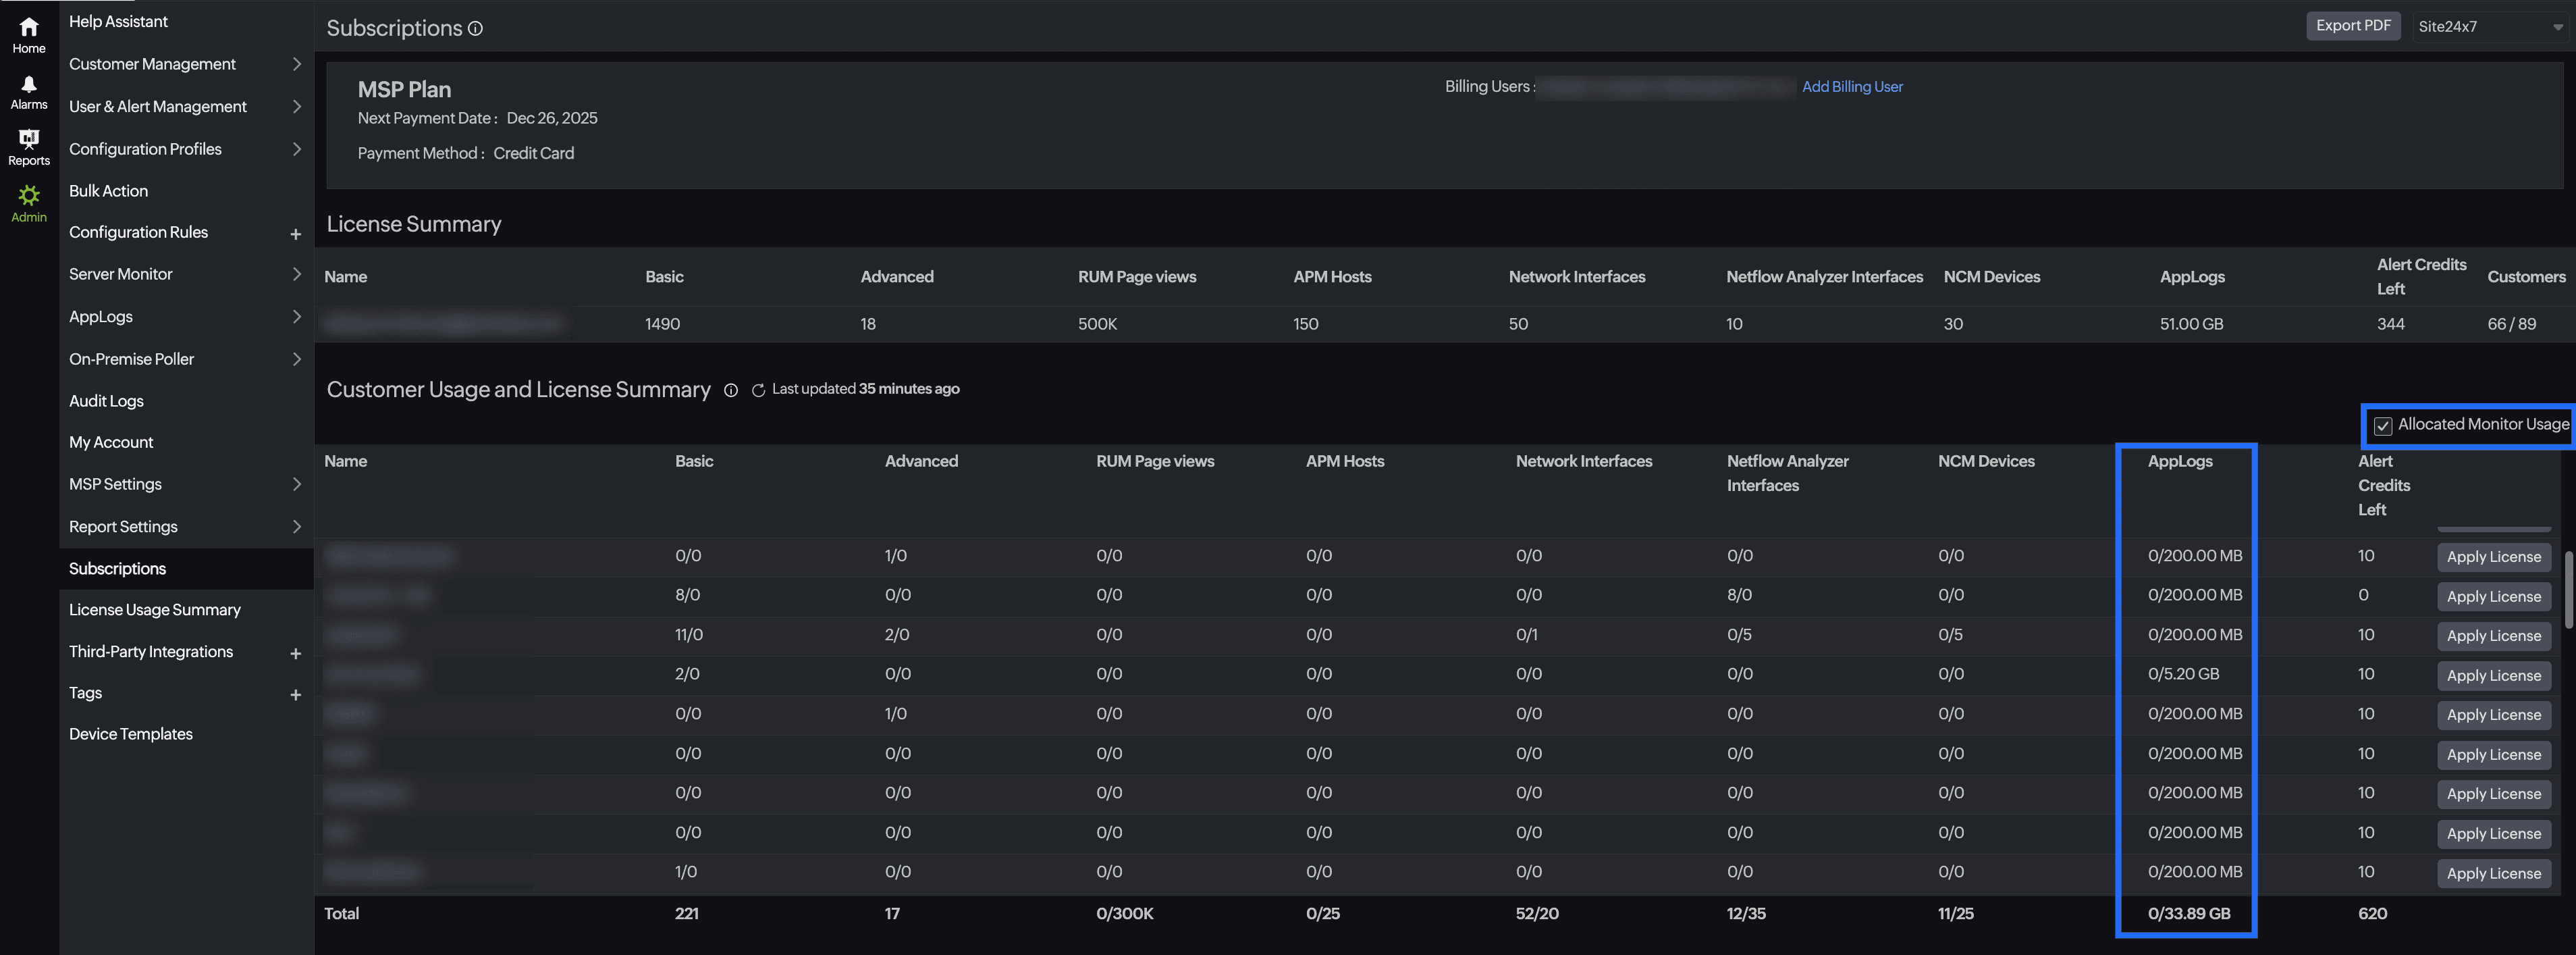
MSP and BU admins can see the AppLogs usage for all the customer accounts from their Admin > Subscriptions page.
Frequently asked questions
- Can I delete the uploaded logs?
You cannot delete the uploaded log data until the retention period has passed. Refer to this documentation to learn more. - Does deleting the logs or updating the retention period reset the log limit?
No. You cannot manage the consumed AppLogs space. Logs already collected for the current billing cycle cannot be removed until the next billing cycle. You can purchase additional add-ons or wait until next month for the AppLogs limit to reset. Reach out to sales@site24x7.com if you need further assistance.
2.1: I currently have 10GB of AppLogs space with a 30-day retention period that is fully utilized. If I change the retention period to 15 days now after completely using the AppLogs space, will the logs older than 15 days old be deleted immediately?
No, the space used for the logs will not be removed or restored, and the collected logs will be retained for 30 days. The updated retention period will only affect newly collected logs and will not apply to logs already collected.
2.2: If the retention period is changed from 30 days to 15 days, will the chart on the logs usage summary page immediately reflect the data for the new 15-day period?
When the retention period is reduced from 30 days to 15 days, the chart on the logs usage summary page will only display data for the new 15-day period after new logs are collected within that retention period. - How long does Site24x7 retain my logs?
For customers who signed up before August 2024, the default log search retention is 30 days; refer to this documentation to customize the log retention period.
For customers who signed up after August 2024, the default log search retention is seven days; refer to this documentation to customize the log retention period.
If you want to increase the retention period, reach out to support@site24x7.com. - Do I get notified of the log usage limit?
When you exhaust 60%, 80%, and 90% of your log usage, you will receive a reminder email with the below information along with recommended add-ons that you may need for seamless log collection:- Log Usage Summary
- Overall log usage trends for the month
- Log usage trend split up by log type
- How can I limit log uploads for a particular log type?
You can set the Maximum Upload Limit while adding your log type to limit a particular log type from consuming more space. - How do I disable log collection for individual log types?
You can disable log collection for a specific log type from the Edit Log Type page. - What are the possible log collection errors?
Upload Limit Reached, Files Not Found, Recent Files Not Found, Empty File, Log Pattern Mismatch, and Permission Denied are common log collection errors. Refer to this documentation for troubleshooting tips for possible log collection errors. - Can I view the log usage summary for the last 30 days?
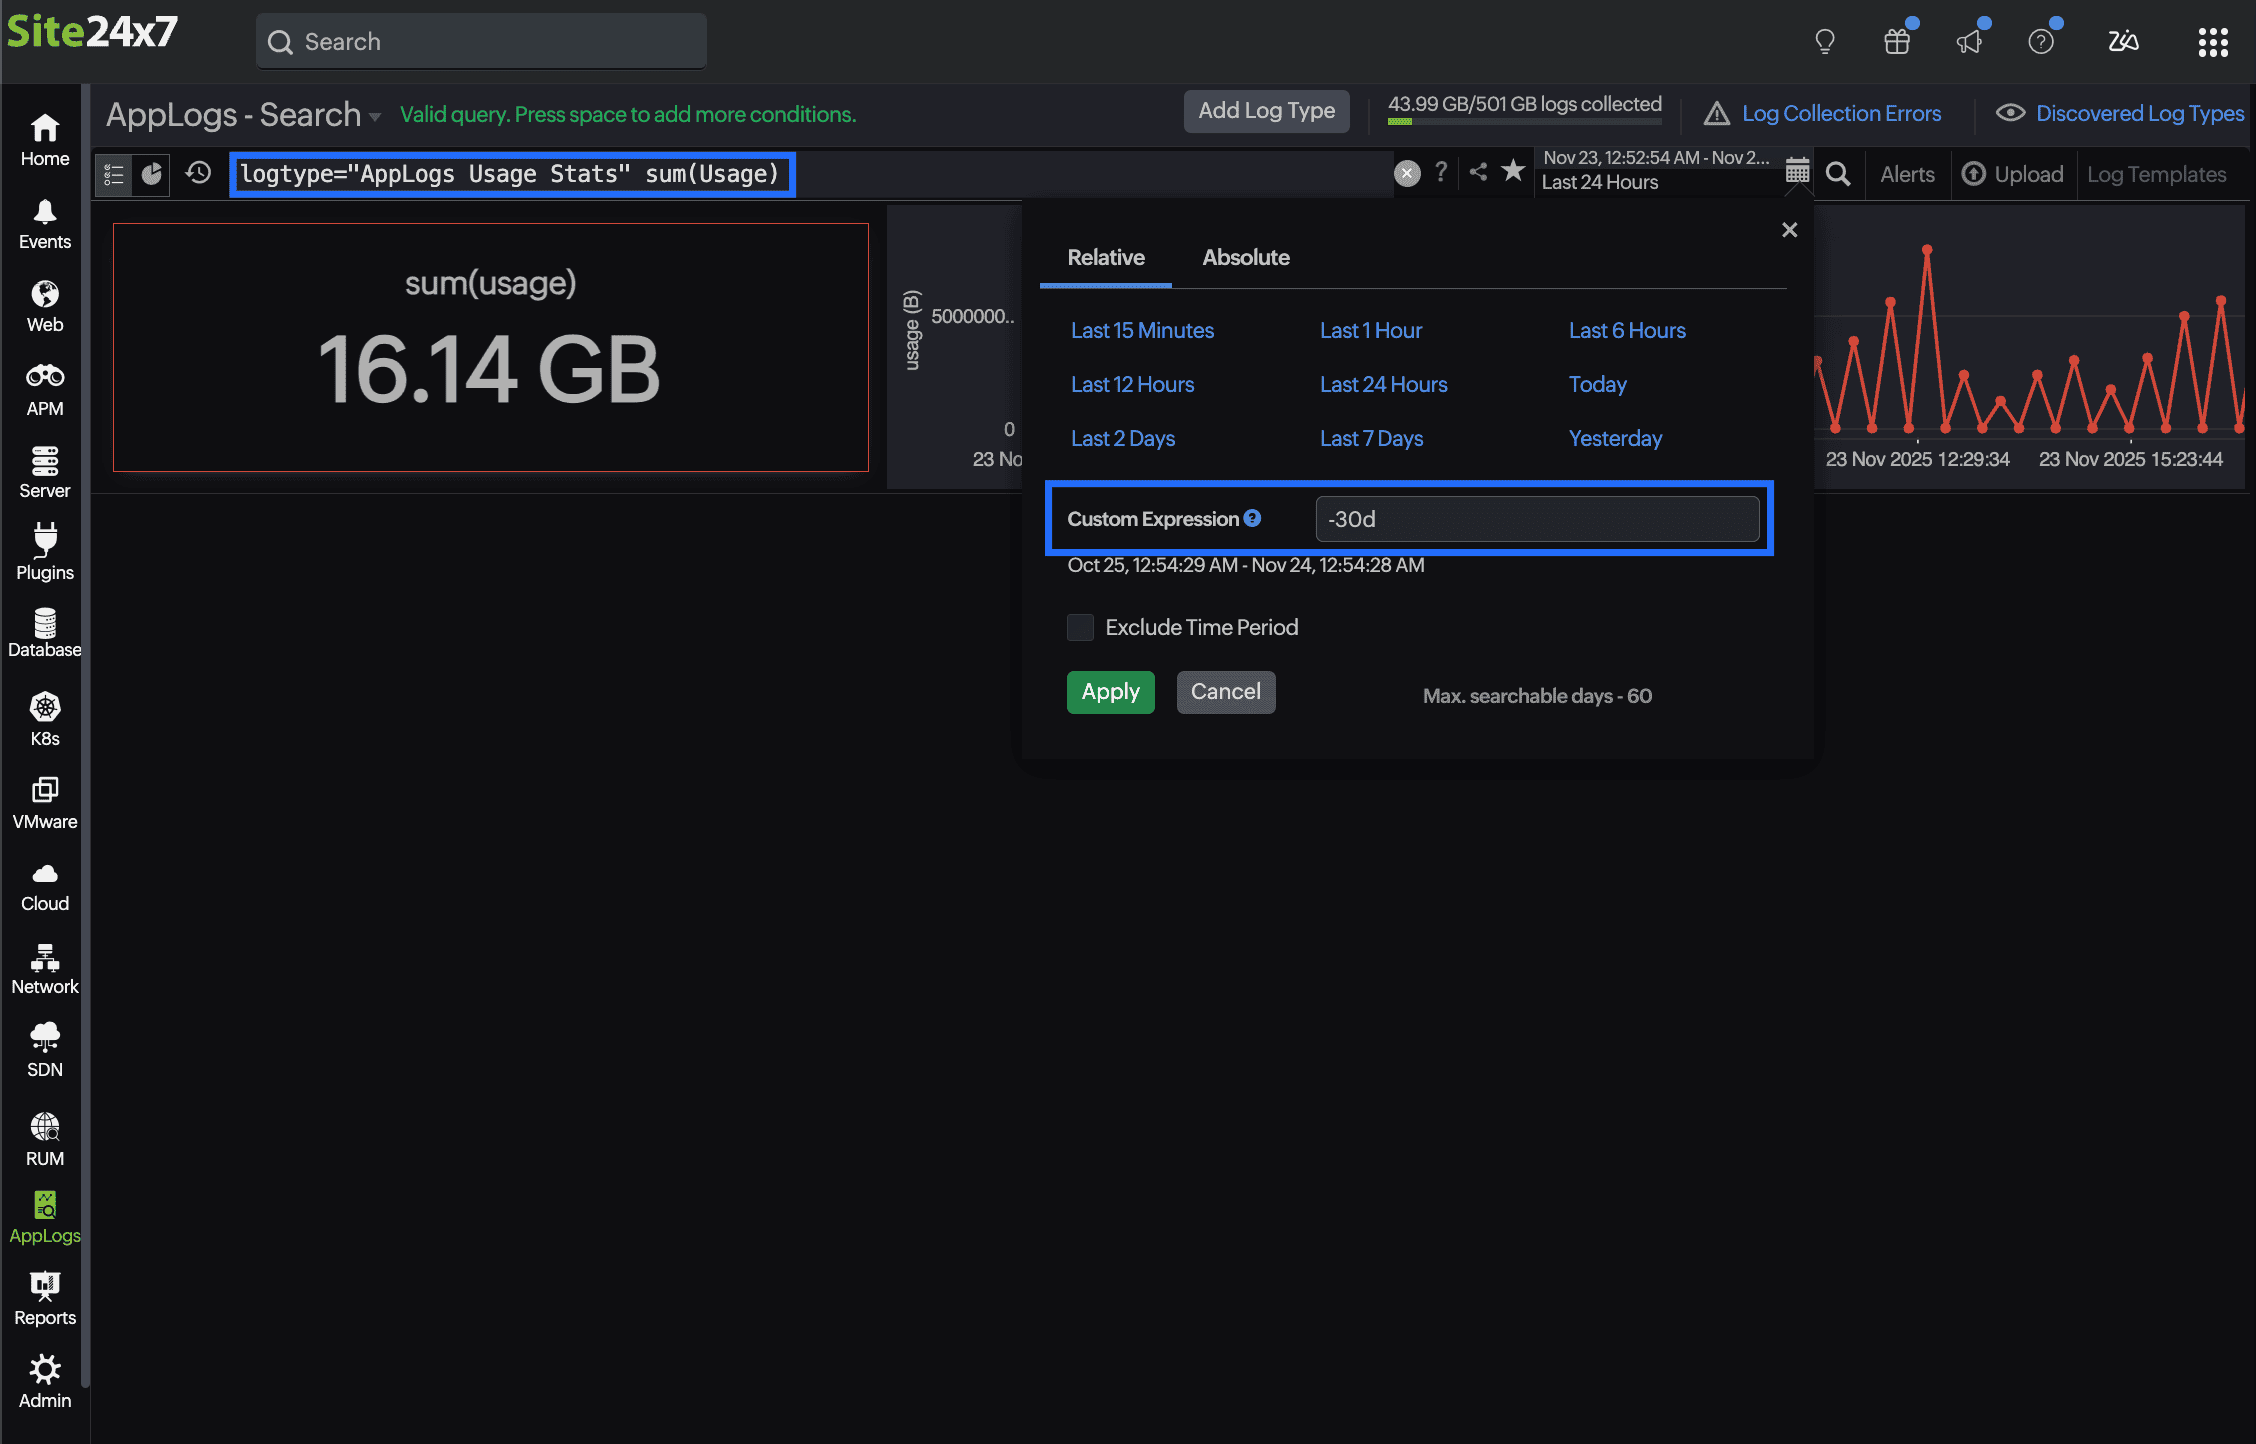
Yes, you can use the following query to view the log usage summary for the last 30 days. To do so, follow these steps:- Navigate to the AppLogs search page.
- Select Relative time by clicking the calendar
icon on the top right of the page and enter -30d in the Custom Expression field.
- To view the overall usage, enter the following query:
logtype="AppLogs Usage Stats" sum(usage)
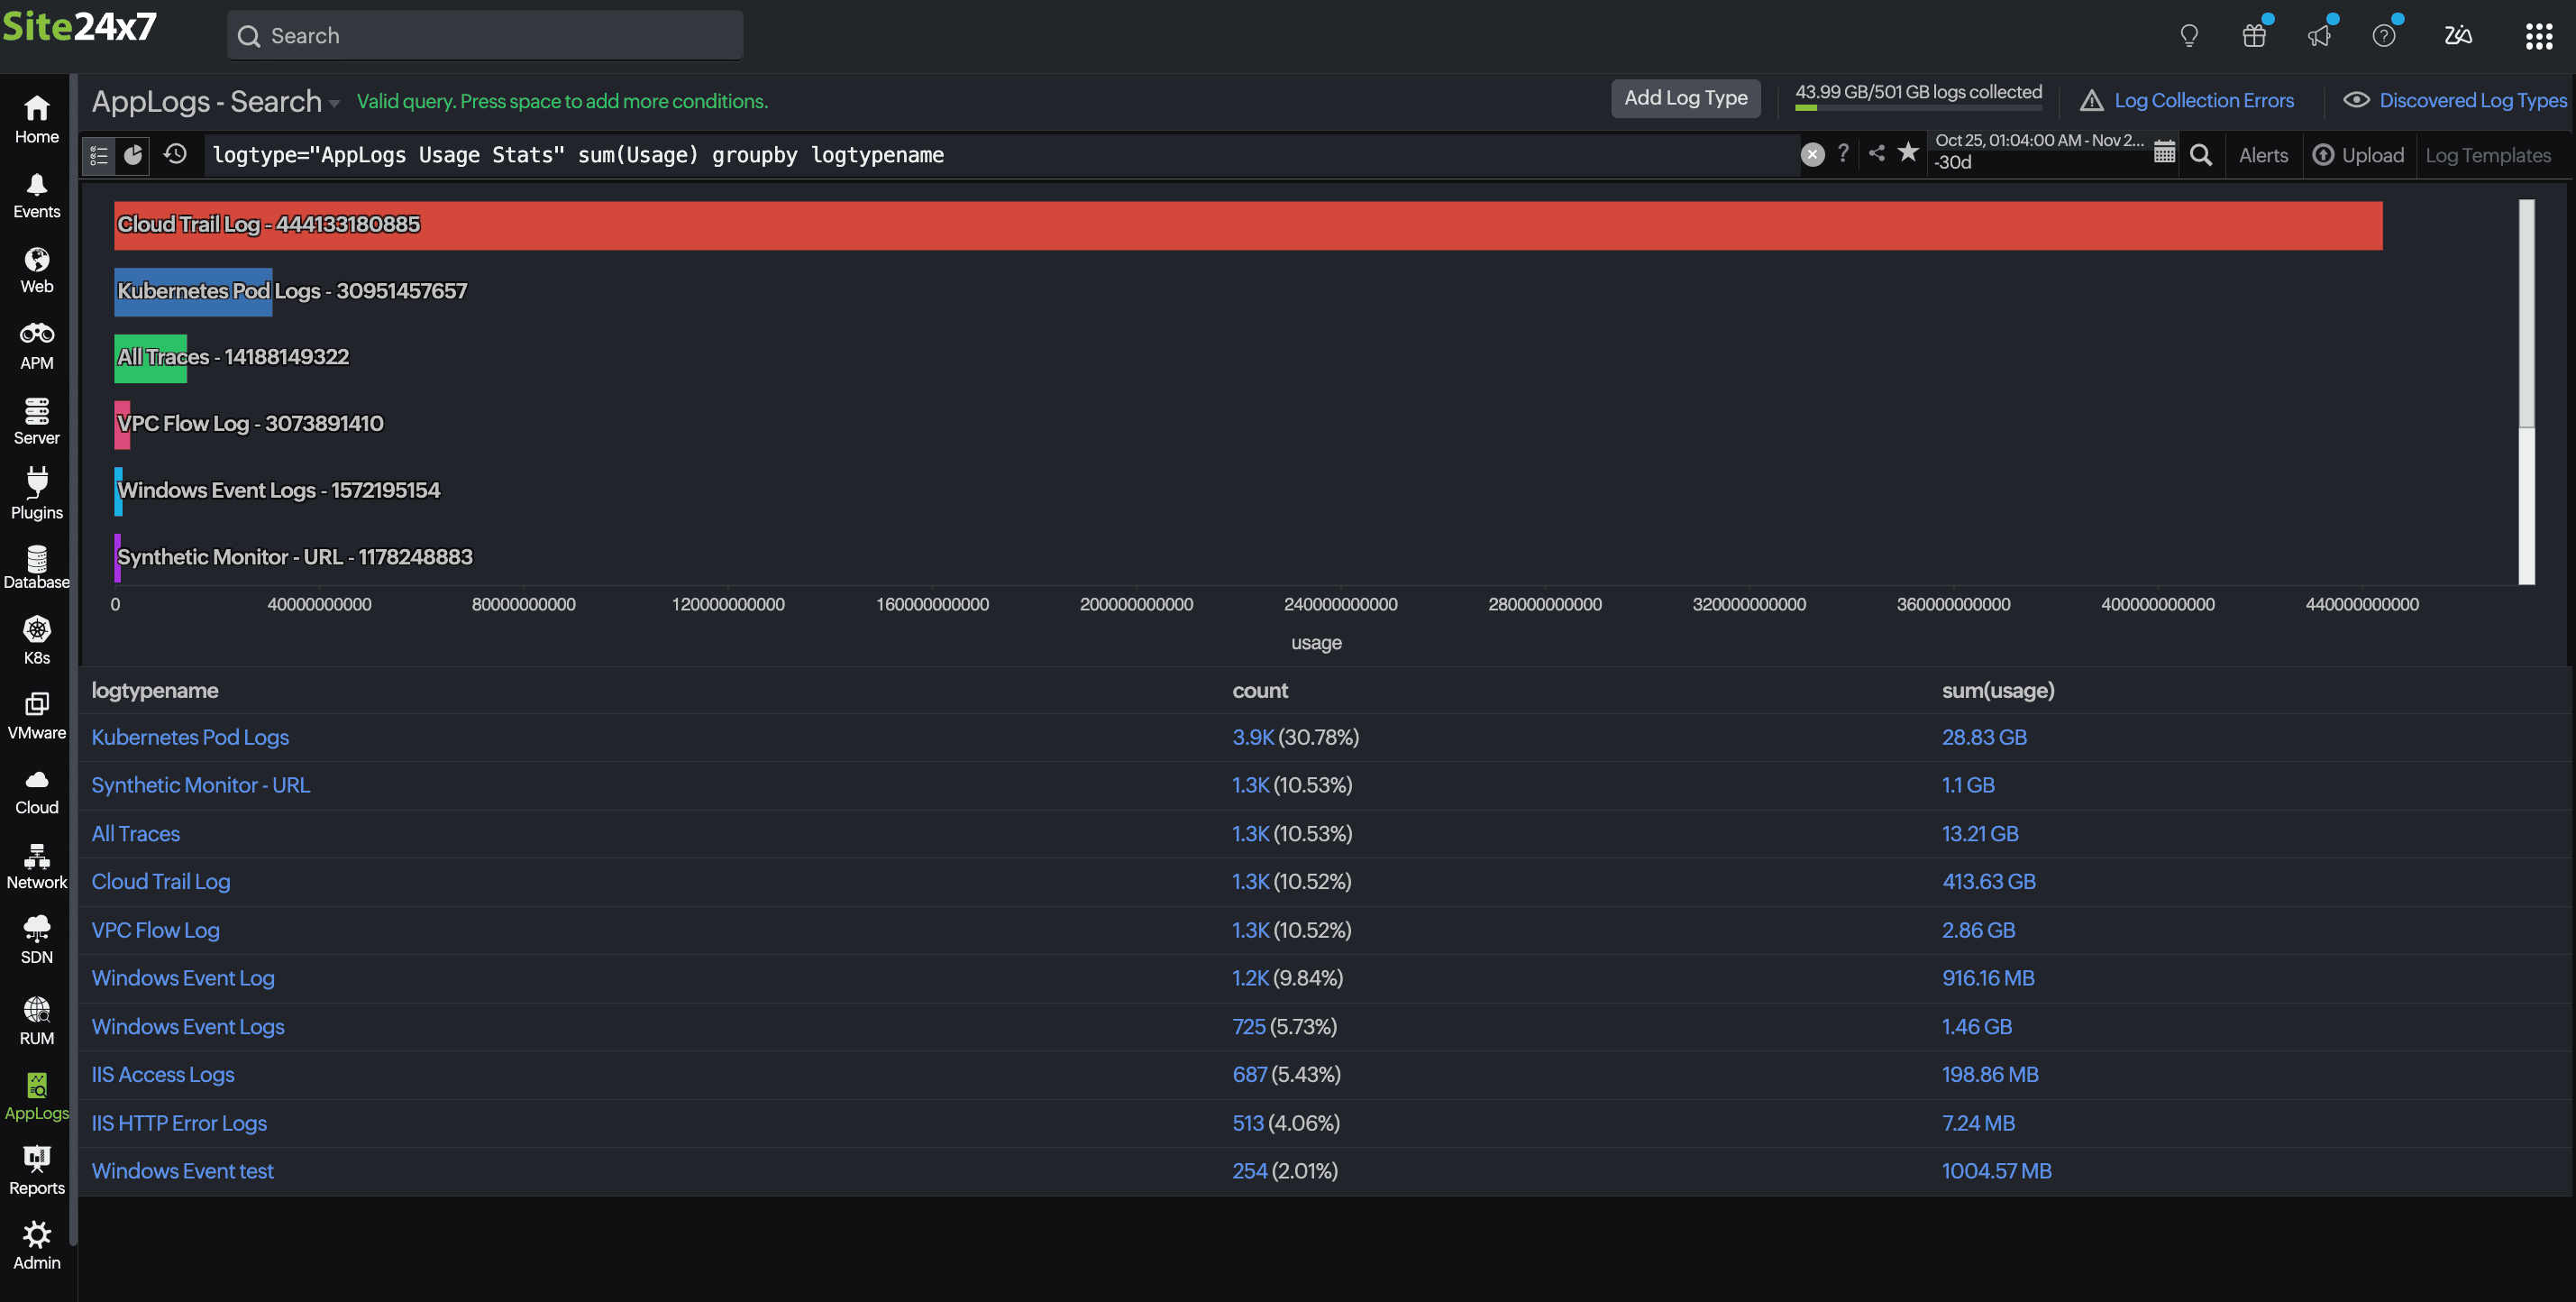
- To view the individual log usage, enter the following query:
logtype="AppLogs Usage Stats" sum(usage) groupby logtypename
- What is the billed size and actual size?
Billed size is the storage consumption for billing; this accounts the uploaded data toward your monthly quota (or add-on). Actual size is the actual amount of log data you have uploaded (eg, 1GB, 3GB/day, etc), shown in a line graph.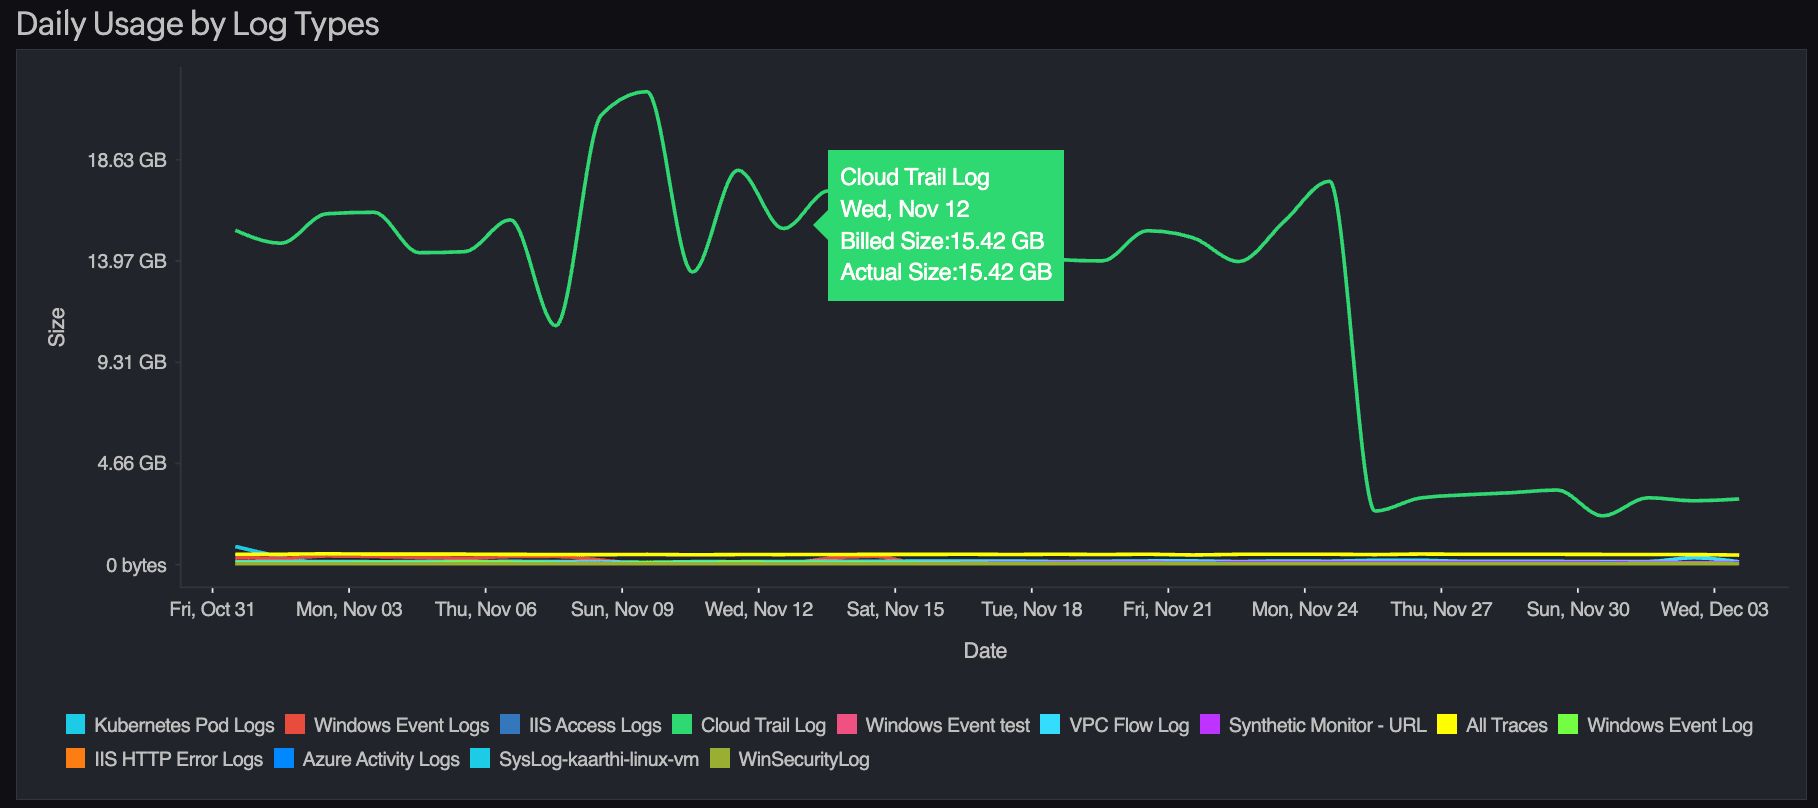
Due to retention settings, compression, and how logs are purged over time, the billed size can differ from the actual size. In simple terms, actual size is what you sent, billed size is what you are charged based on your retention period. Learn how you can check and reduce unwanted log usage. - If we reduce the retention period, will those logs be deleted?
No, once the storage is consumed, it cannot be reclaimed. This updated retention will only apply to the next log ingestion.
Related articles
-
On this page
- Log Usage Summary
- Use case
- Frequently asked questions
- Can I delete the uploaded logs?
- Does deleting the logs or updating the retention period reset the log limit?
- How long does Site24x7 retain my logs?
- Do I get notified of the log usage limit?
- How can I limit log uploads for a particular log type?
- How do I disable log collection for individual log types?
- What are the possible log collection errors?
- What is the billed size and actual size?
- Can I view the log usage summary for the last 30 days?
- If we reduce the retention period, will those logs be deleted?
