Collecting AWS Managed Microsoft AD logs using AWS Lambda
AWS Managed Microsoft AD makes it easy to extend the existing Active Directory to the AWS Cloud. With this, you can leverage your existing on-premises user credentials to access cloud resources.
Analyzing these security logs will help you keep track of your AD environment and troubleshoot easily. Site24x7 AppLogs uses AWS Lambda to collect AWS Managed Microsoft AD logs from CloudWatch and display the collected information in simple formats like human-readable text or graphs and charts for easy analysis. Learn more about log management with Site24x7.
Creating a log profile
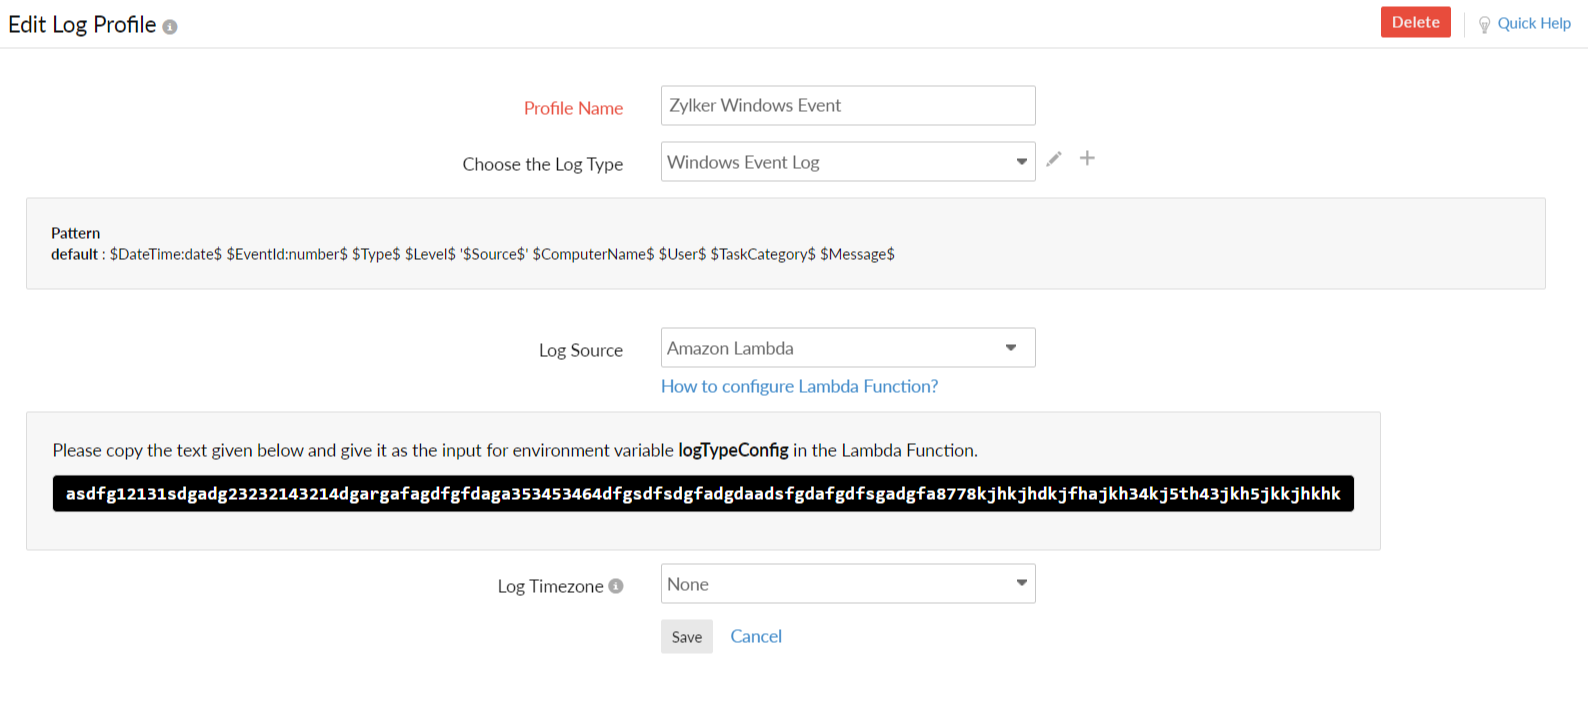
To collect the AWS Managed Microsoft AD logs, you first need to create a log profile. Navigate to Admin > AppLogs > Log Profile > Add Log Profile, and enter the following:
- Profile Name: Enter a name for your log profile.
- Log Type: Choose Windows Event logs from the drop-down menu. If you haven't enabled AWS Managed Microsoft AD logs on your AWS account, please follow these instructions, and then return to this document.
- Log Source: Choose Amazon Lambda.
- Log Time Zone: Choose the desired time zone.
- Click Save.
- Configure AWS Lambda following the steps below.
AWS setup
1. Finding the log group
- Log in to your AWS console and navigate to Services.
- Go to CloudWatch.
- Go to Logs > Log Groups and choose a suitable Log Group from the list.
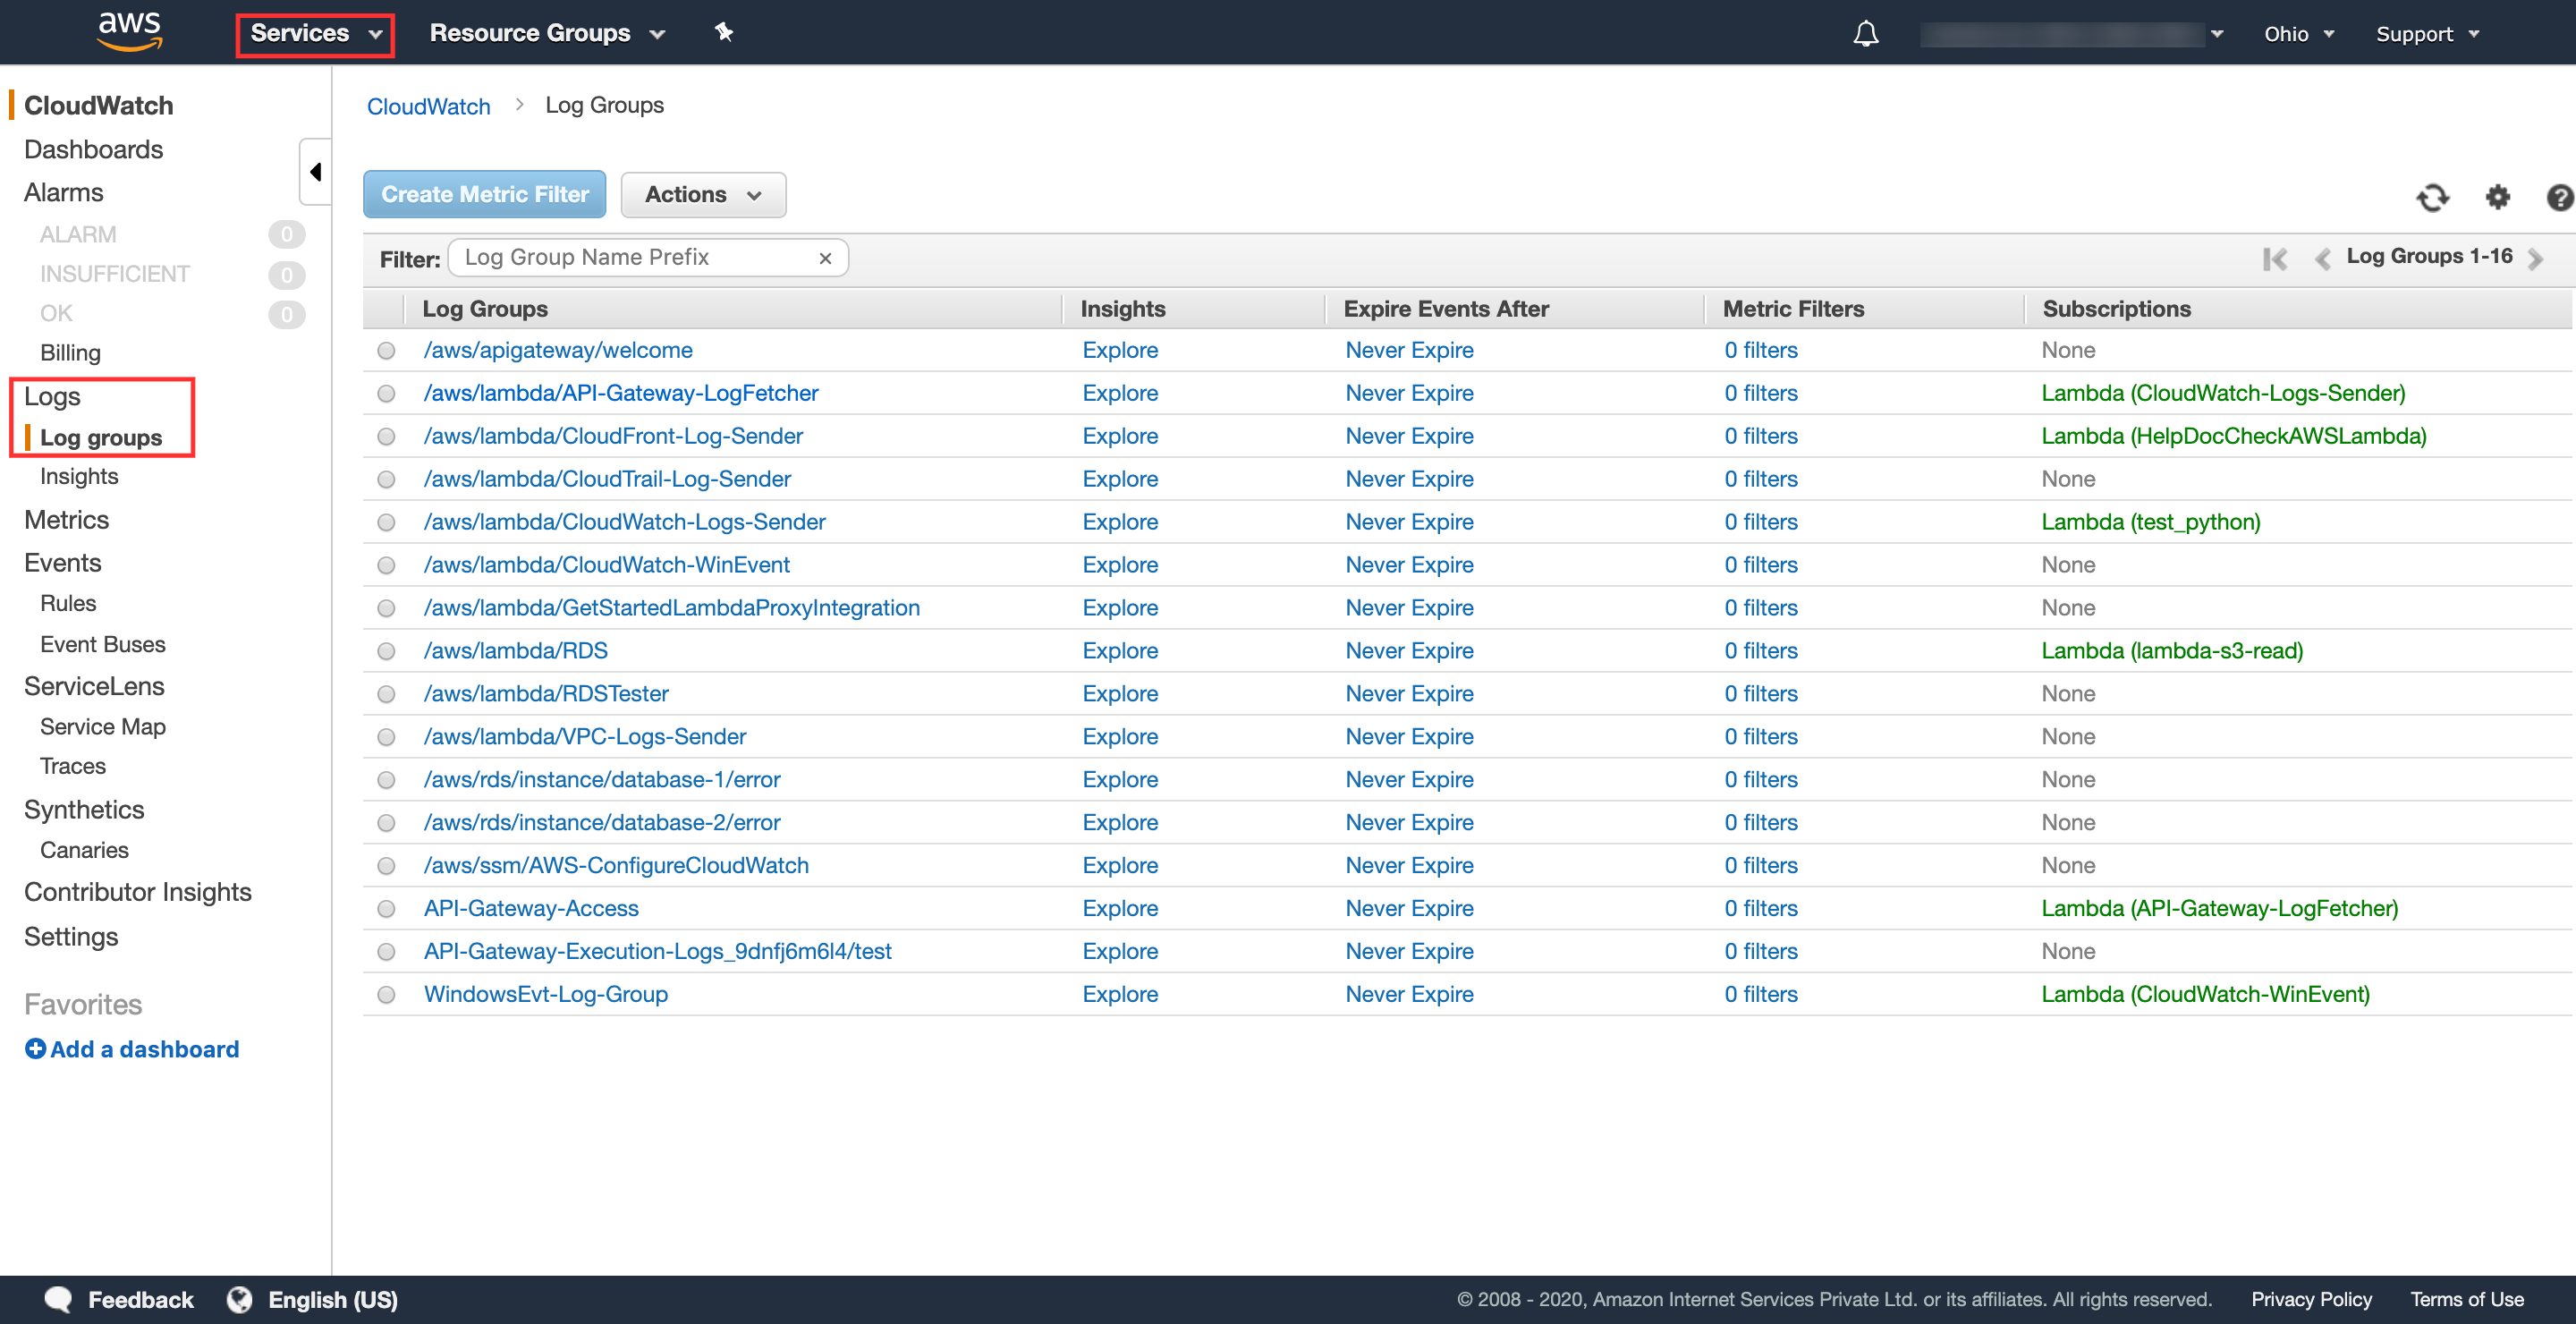
2. Get the AWS Lambda code
Use this link to obtain the code required for AWS Lambda:
https://github.com/site24x7/applogs-aws-lambda/blob/master/cloudwatchlogs/cloudwatch-wineventlog-sender.py
3. Configure AWS Lambda
- Choose Lambda from the Services drop-down list, and choose Create Function. Select Author from scratch, define a name for the function, and choose Python 3.7 as the Runtime.
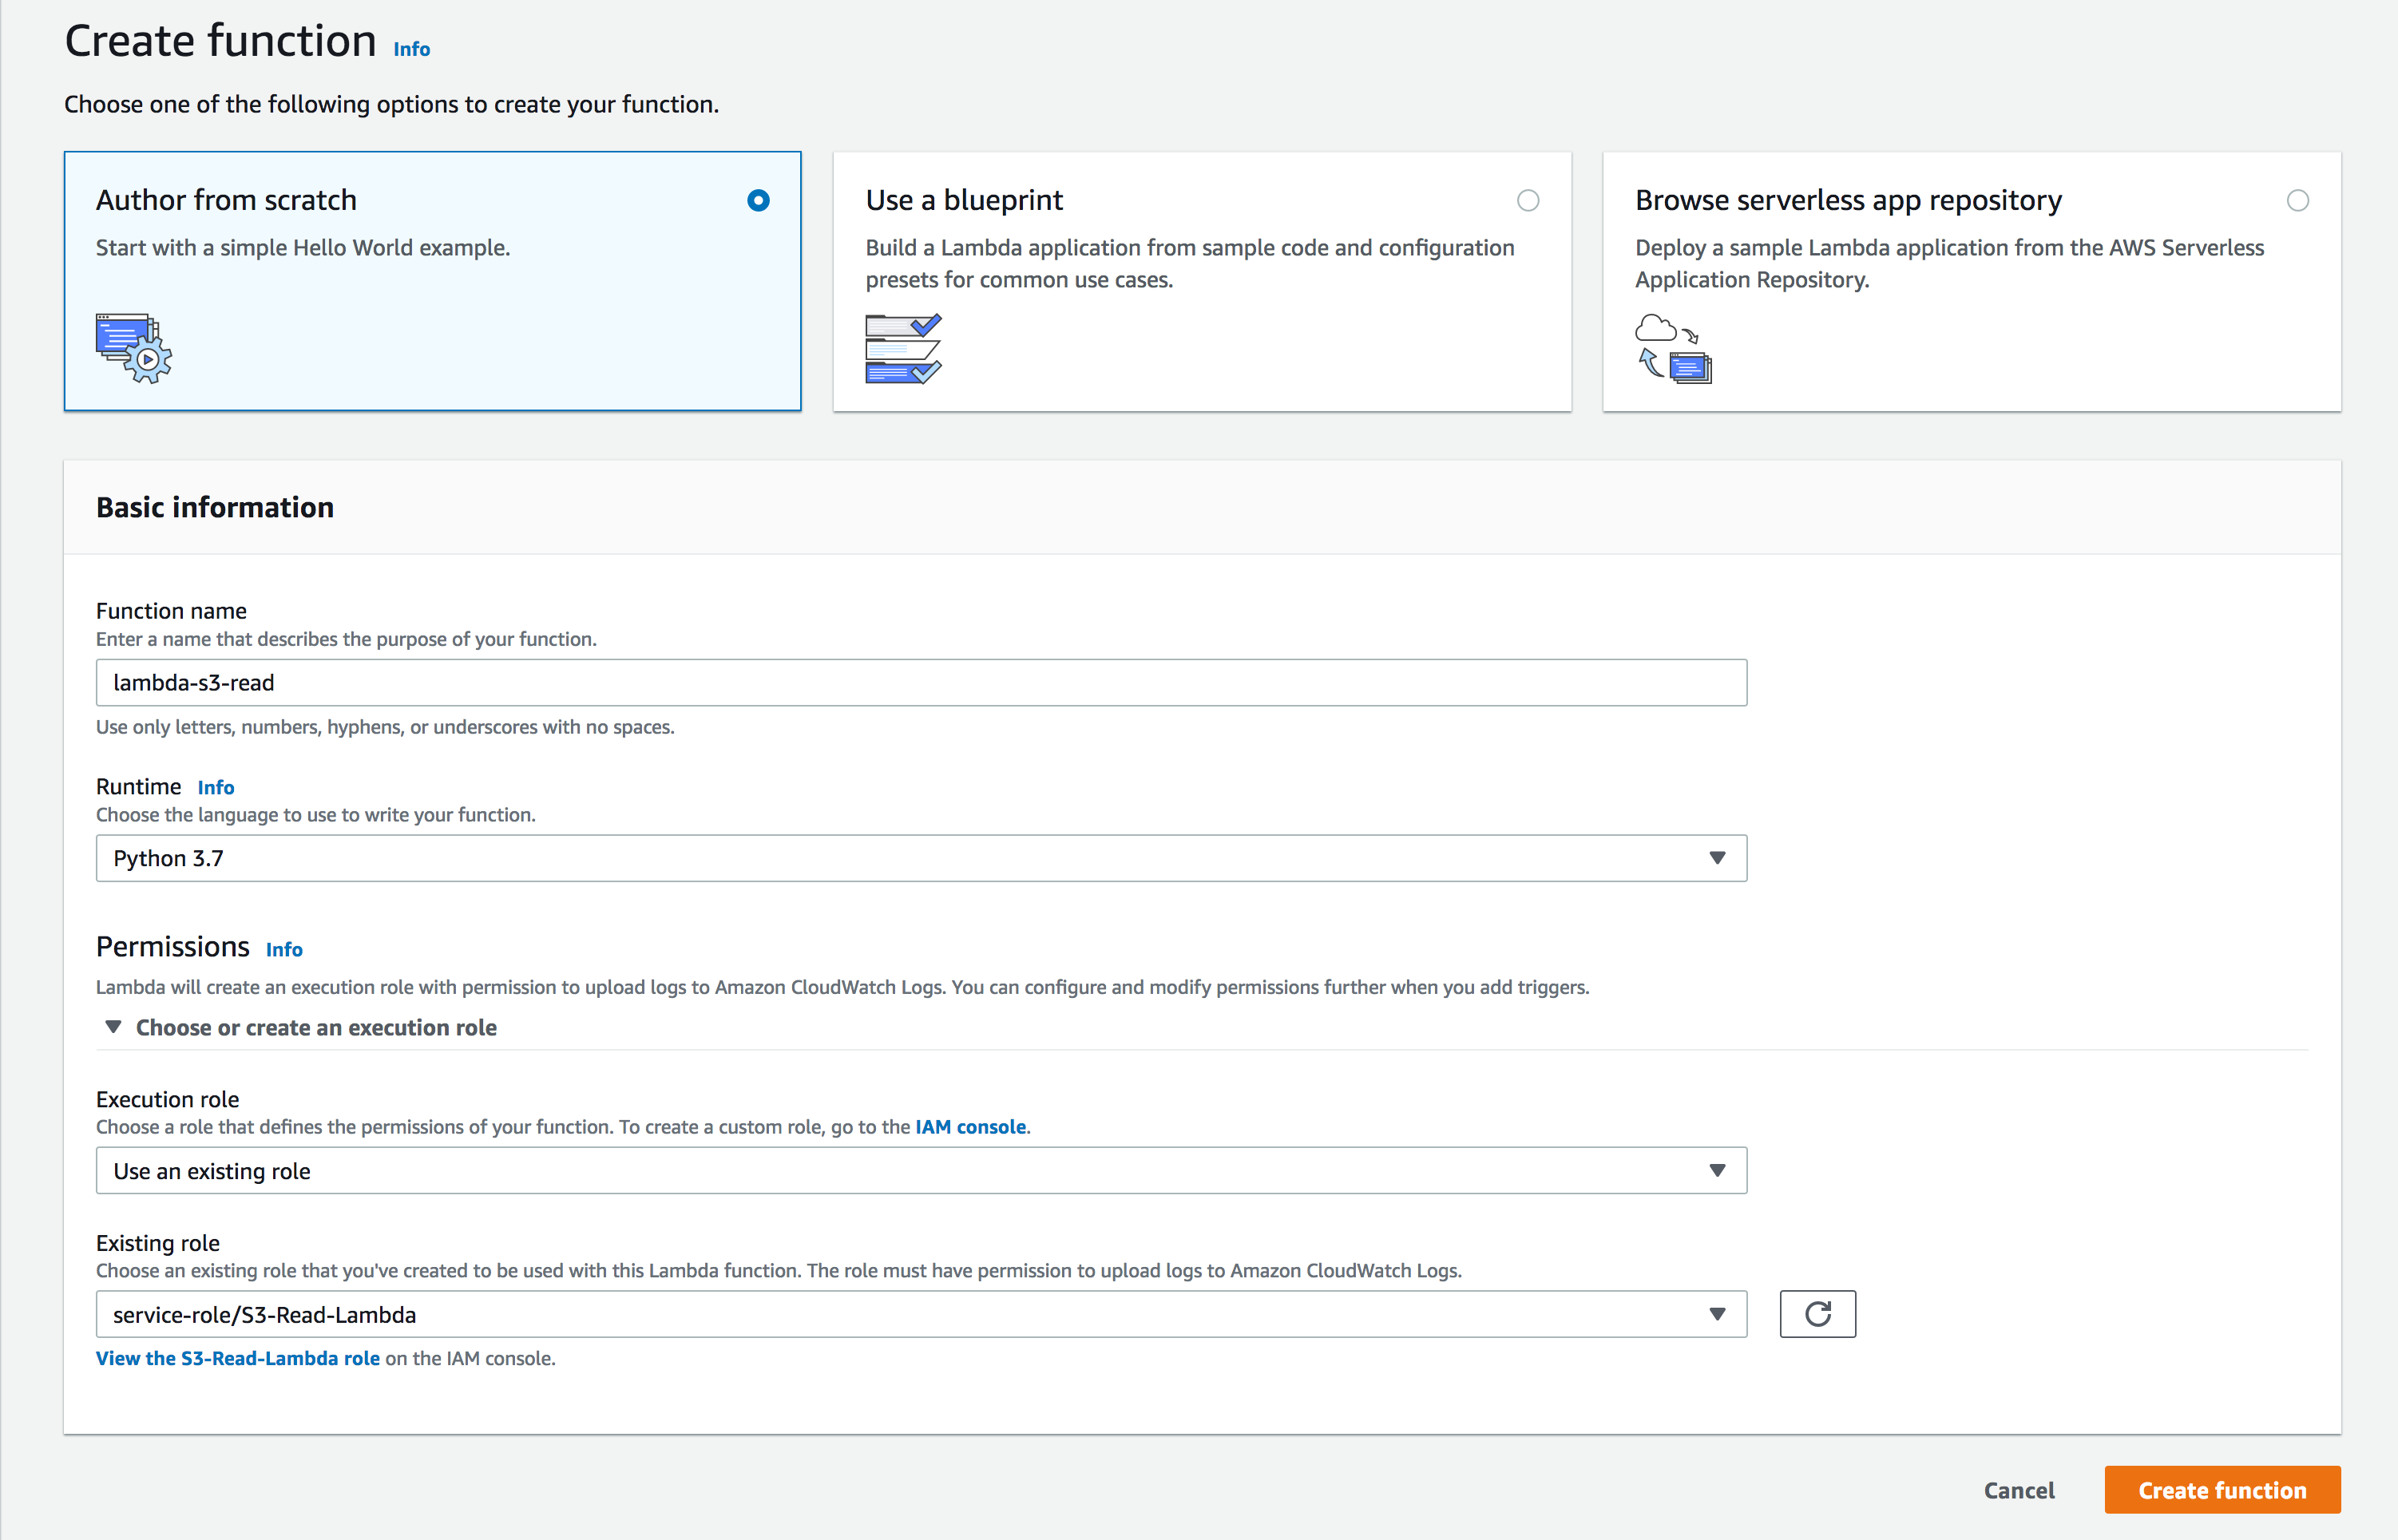
- Permissions: You can choose an existing IAM role or create a new role with basic AWS Lambda permissions. You also have the option to create a new user role and extend permission to other services as well. Click Create Function.
- Verify your function name and click Add trigger.
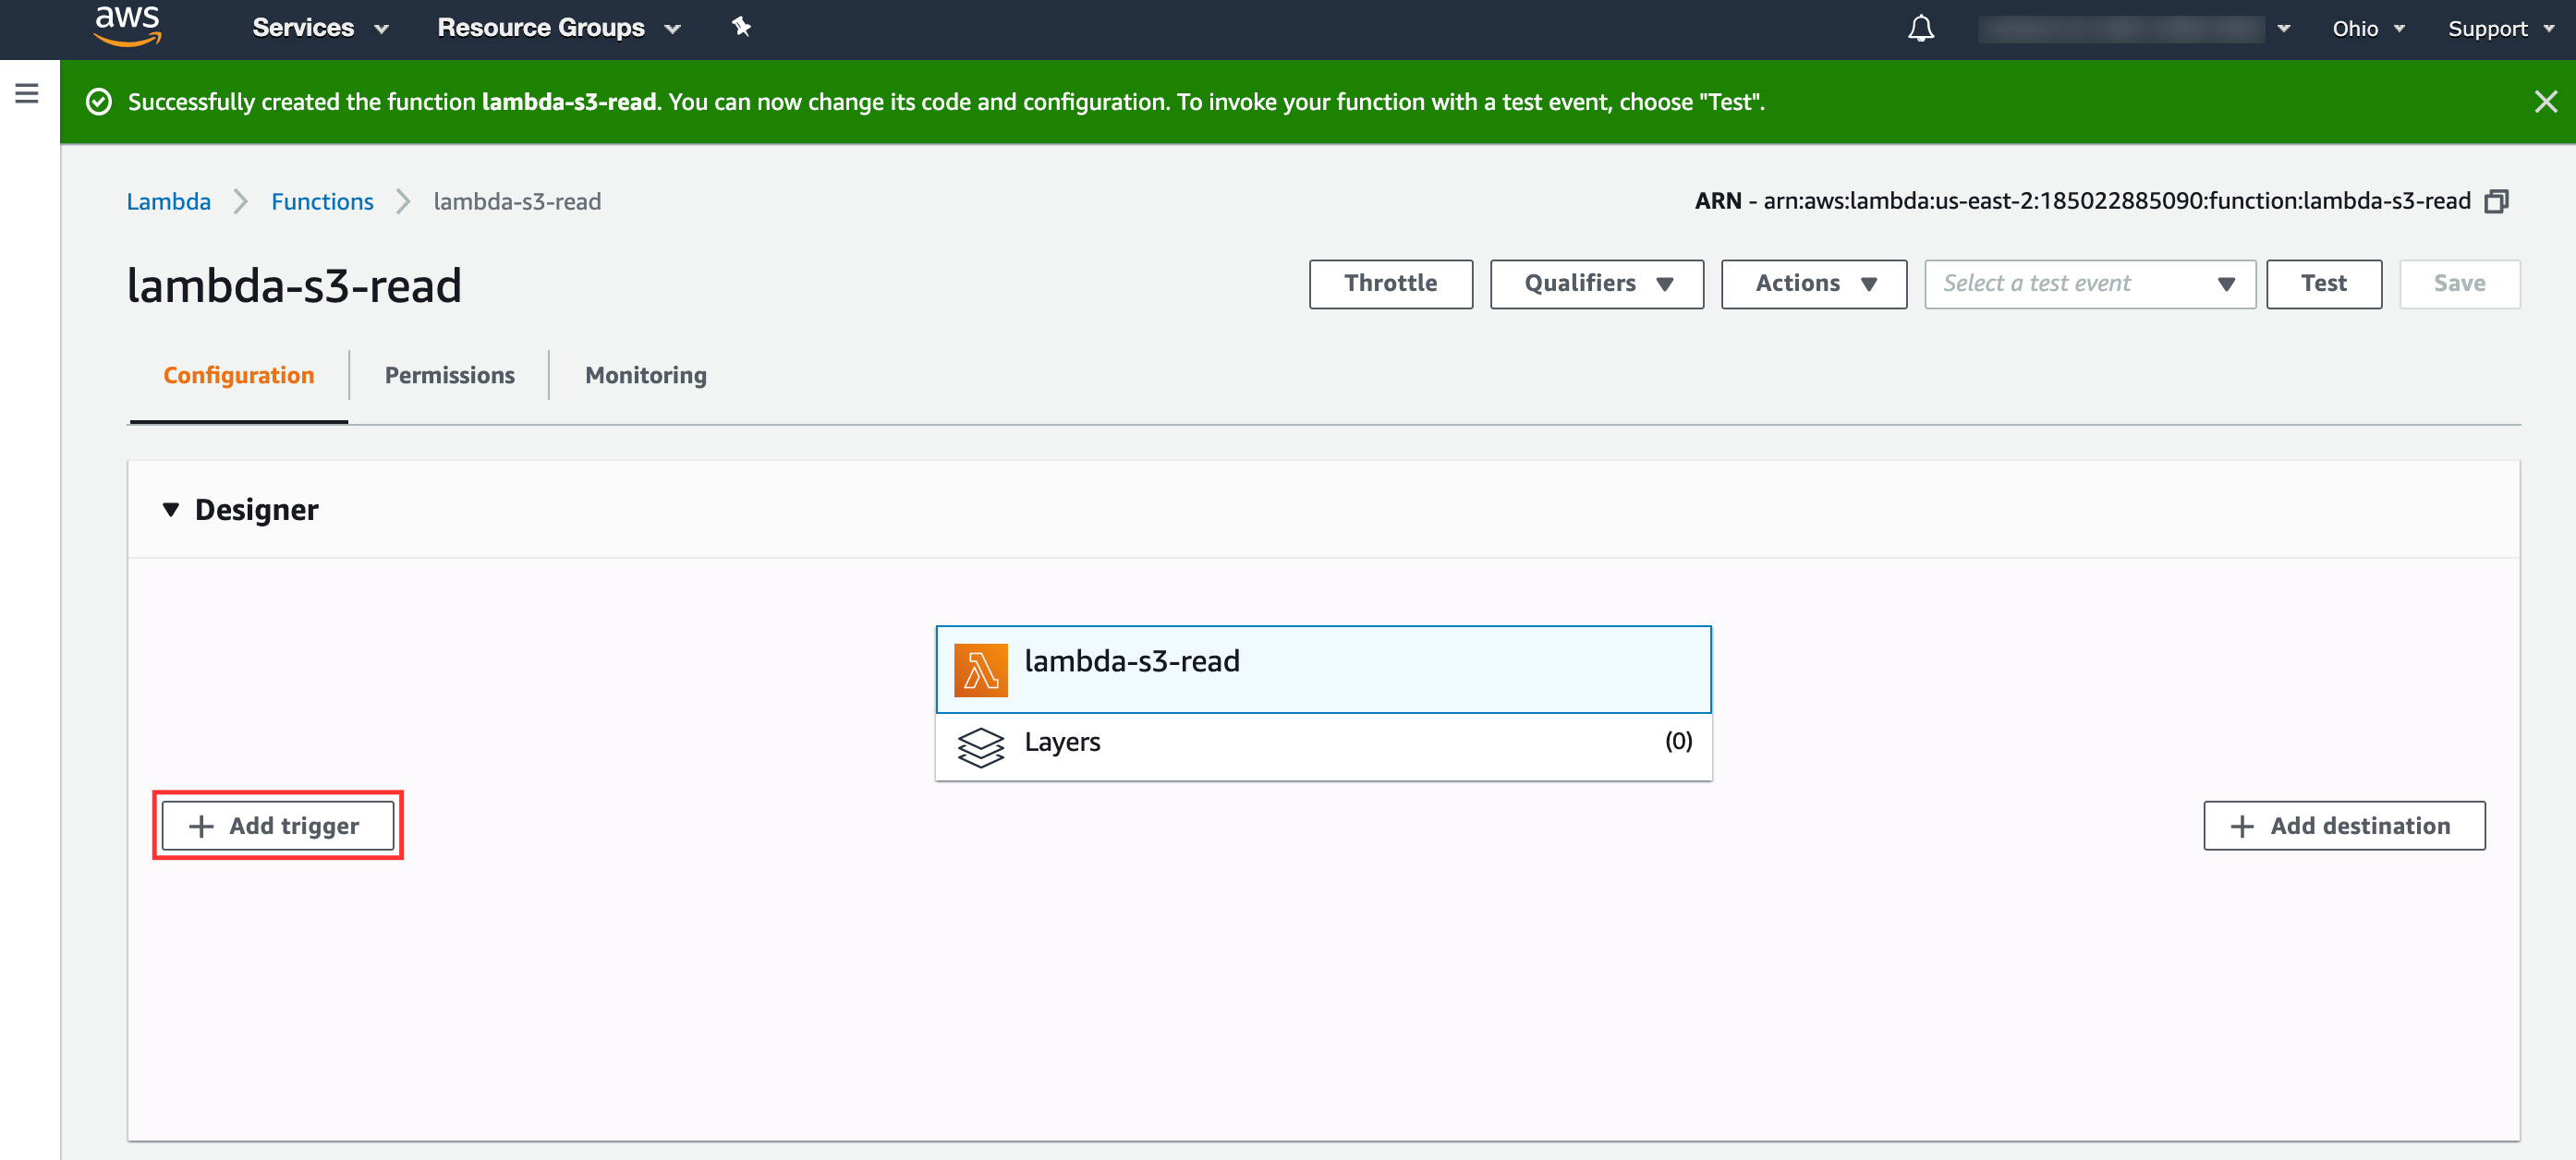
- Trigger Configuration:
- Log group: Select the desired log group as mentioned above.
- Filter name: Choose a name for your filter.
- Check the box for Enable trigger, and click Add.
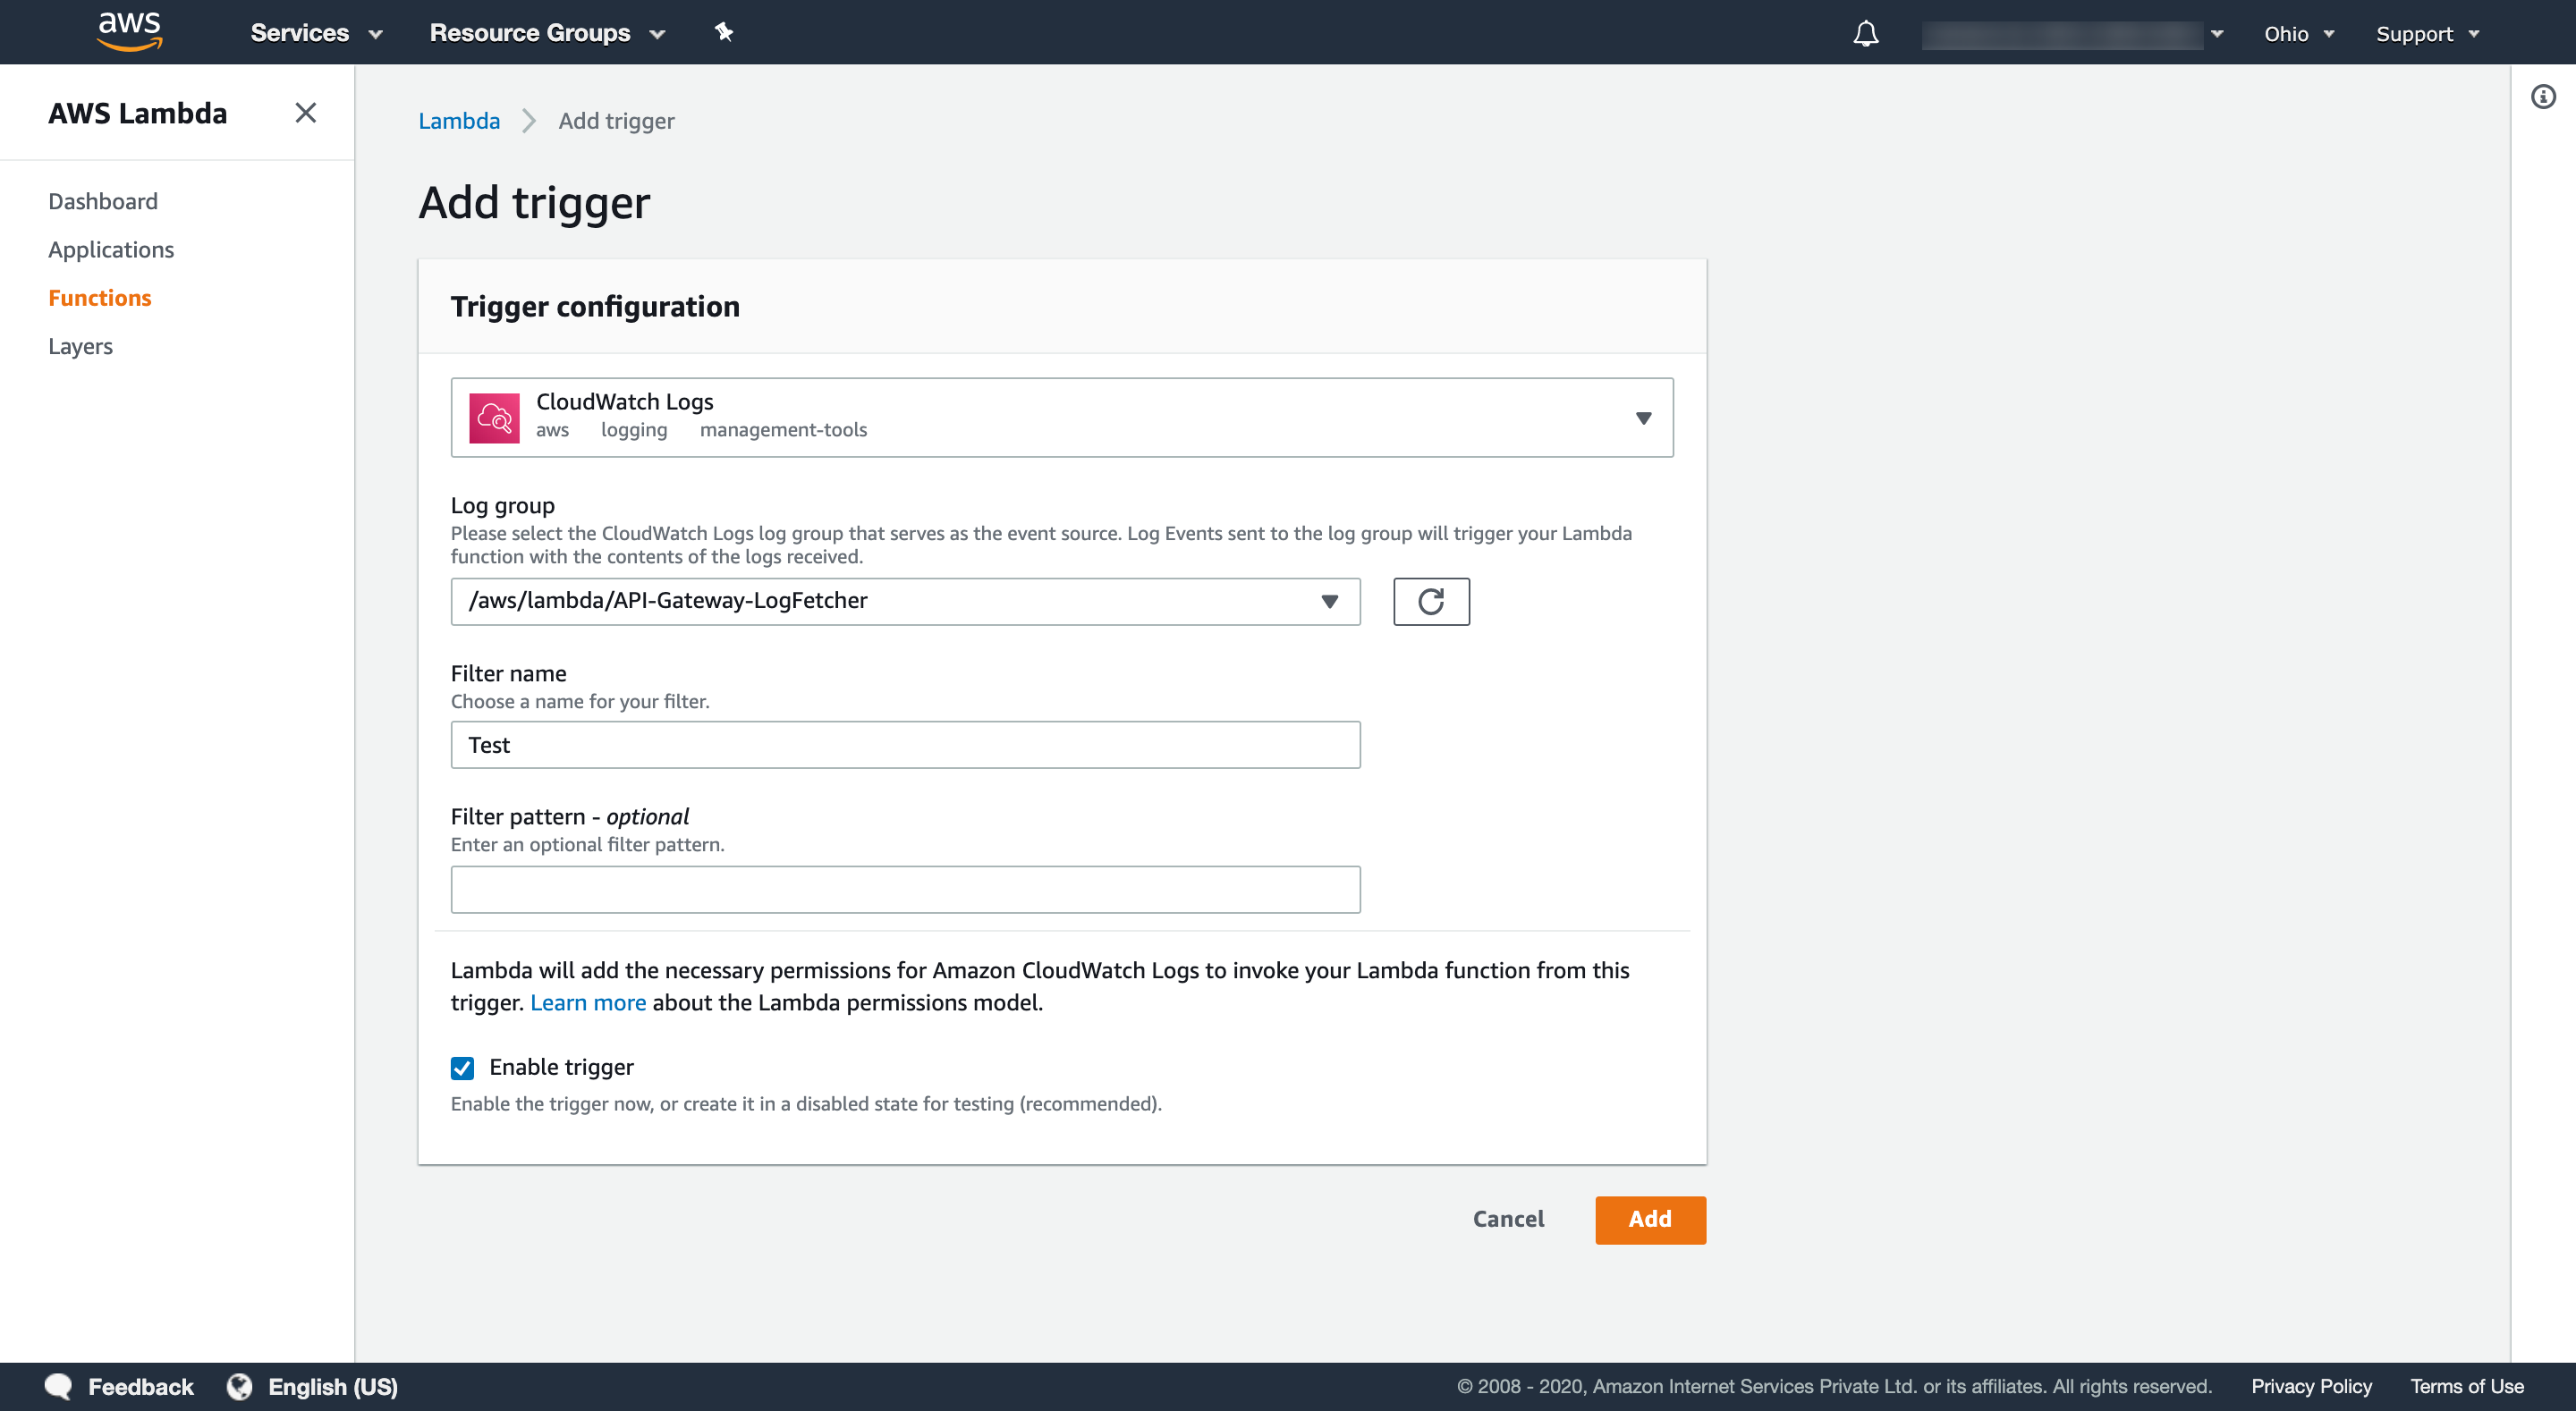
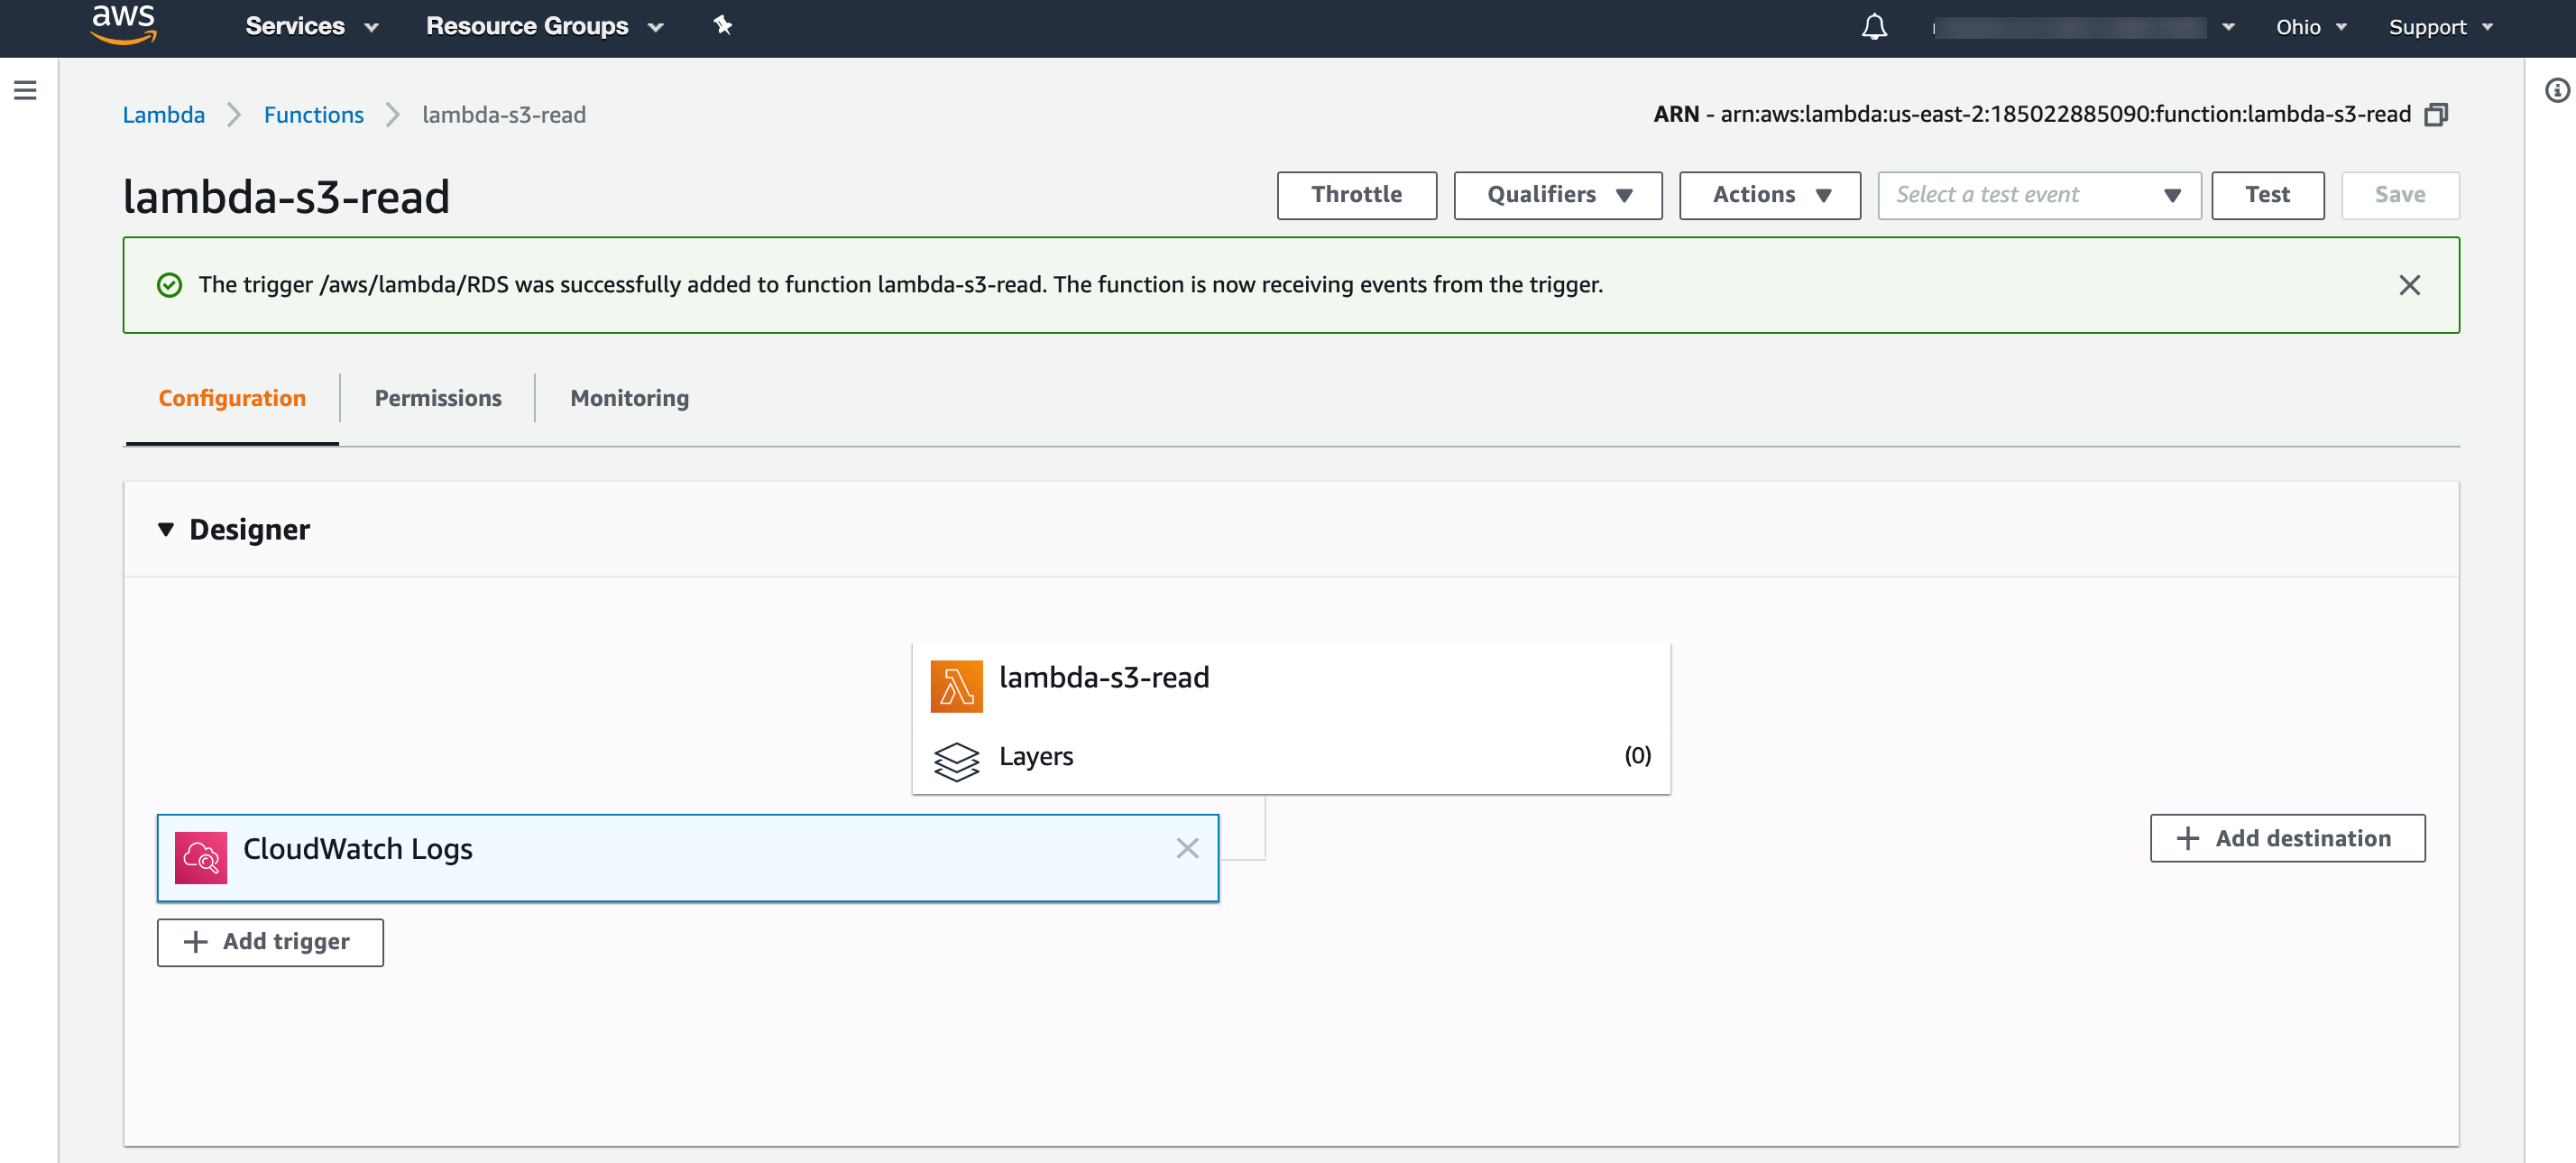
In the window that opens, click on AWS Lambda-s3-Read as shown below:
- Scroll to the editor, and place the code provided in the link below:
https://github.com/site24x7/applogs-aws-lambda/blob/master/cloudwatchlogs/cloudwatch-wineventlog-sender.py - After entering the code, navigate to the Site24x7 web client, select Admin > Applogs > Log Profile, then select the created Log Profile, and copy the code that appears on the screen as the input for the variable logTypeConfig under the field Environment variables.
You can perform a query language search with Windows Event logs as the log type. Click on Dashboard to view different widgets on the same.
Related log types
-
On this page
- Creating a log profile
- AWS setup
- Related log types
