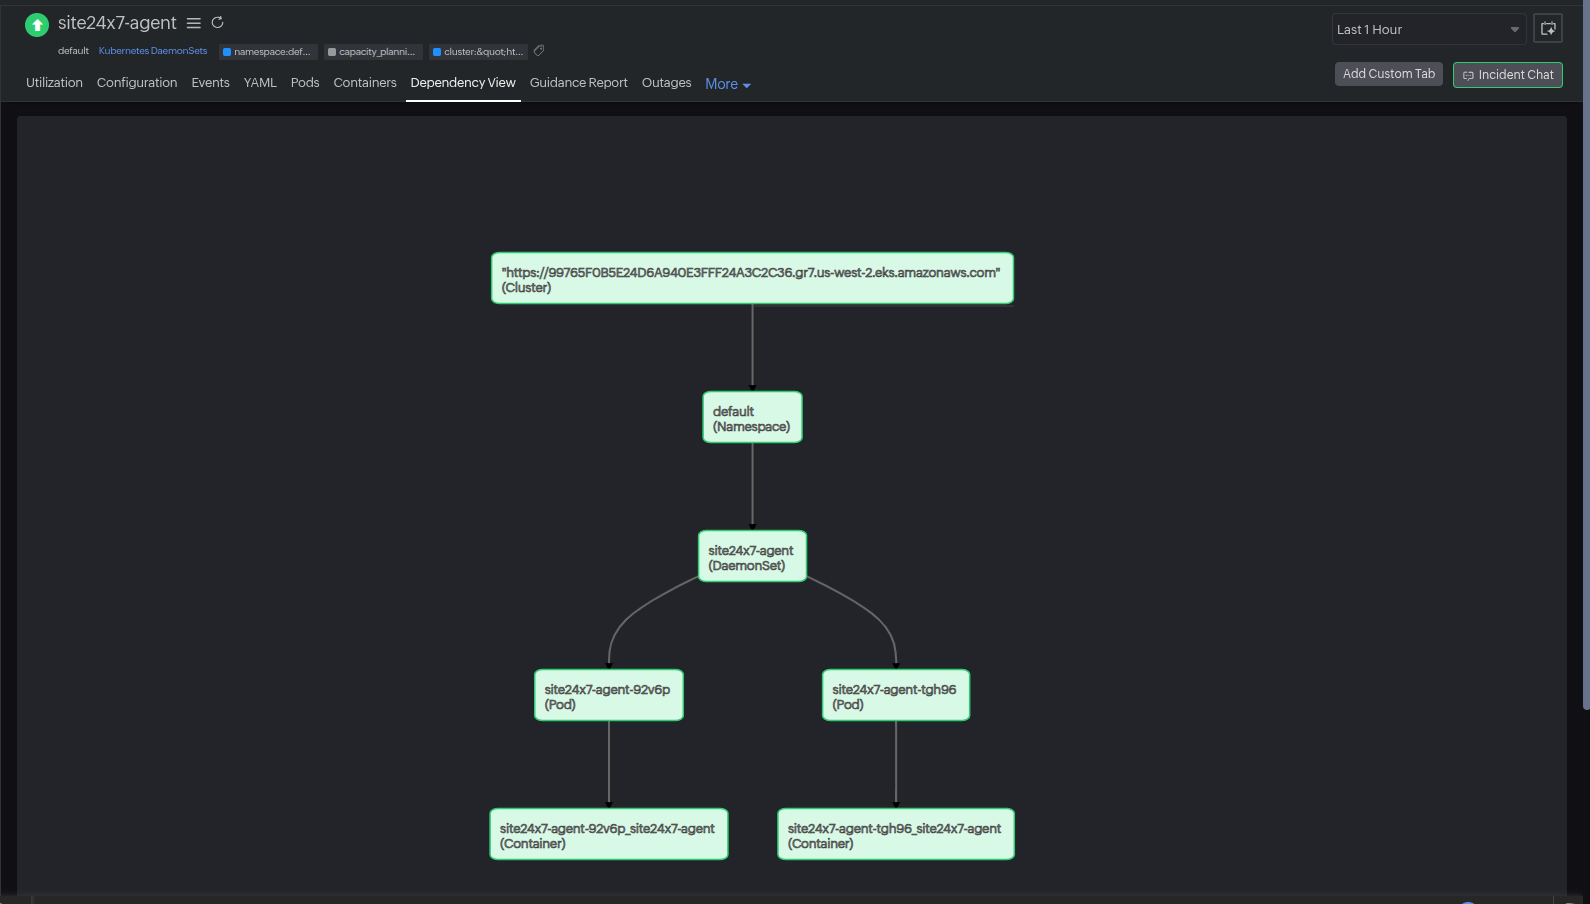
Kubernetes Dependency Tree view
The Dependency Tree view in Site24x7 Kubernetes monitoring offers a visual, hierarchical representation of your cluster's components and their relationships. It helps you understand how various Kubernetes resources are interconnected, making it easier to pinpoint the root cause of issues and optimize resource usage.
What is the Dependency Tree view?
The Dependency Tree view provides a top-down, intuitive map of your Kubernetes environment. It visualizes how high-level components like Deployments, DaemonSets, and StatefulSets relate to lower-level entities such as Pods and Containers, helping you:
-
Understand workload hierarchies and relationships
-
Perform faster root cause analysis
-
Navigate across your cluster visually
-
See contextual metrics and health status in real time
Supported monitor types in the tree view
The following Kubernetes resources are represented in the Dependency Tree view:
-
Namespace
-
Deployments
-
DaemonSets
-
StatefulSets
-
Horizontal Pod Autoscalers (HPA)
-
Ingress
-
Persistent Volumes (PV)
-
Persistent Volume Claims (PVC)
-
Services
-
Pods
-
Containers
Each component in the tree shows basic metrics and status indicators, and you can click on any node to view detailed insights.
Tabular view relationships
For some monitor types, Site24x7 provides a complementary Tabular view showing bidirectional relationships, useful for monitoring the dependent resources.
Tabular mappings
| Parent Resource | Related Resource |
| Pod | Containers |
| Containers | Pods |
| DaemonSets, Deployments, StatefulSets | Pods |
| Nodes | Pods |
| Services | Pods |
Use these views to explore resource-level metrics, identify problematic containers, and analyze how workloads are distributed across your infrastructure.
How to access the Dependency Tree view
-
Log in to your Site24x7 account.
-
Navigate to K8s > select the Cluster.
-
Select the resource and Dependency Tree tab.
From there, you can interactively explore the entire structure of your Kubernetes environment.

Key features
-
Interactive hierarchy: Expand or collapse components to view underlying relationships.
-
Health indicators: Colored icons denote the health of each resource.
-
Real-time metrics: Instantly view CPU, memory usage, and status.
-
Drill-down capability: Click on any component for a detailed resource view, including logs and events.
-
Lookup functionality: Find resources quickly by name.
Benefits
-
Simplified monitoring: View the entire ecosystem at a glance.
-
Faster troubleshooting: Trace service failures from pod to controller or node.
-
Impact analysis: Understand the downstream effect of issues in key workloads.
