Azure Stack Hub monitoring
Azure Stack Hub extends Azure services to your on-premises and hybrid environments. Site24x7's Azure Stack Hub monitor connects to your Stack Hub deployment and tracks the alerts it generates. This gives you a consolidated view of alert volume, severity, and category directly within Site24x7, alongside the rest of your infrastructure and application monitors.
Add an Azure Stack Hub monitor
- Log in to Site24x7 and navigate to Cloud > Azure.
- In the left navigation menu, click the plus + icon next to Azure Stack Hub Monitors. This opens the Add Azure Stack Hub Monitor page.
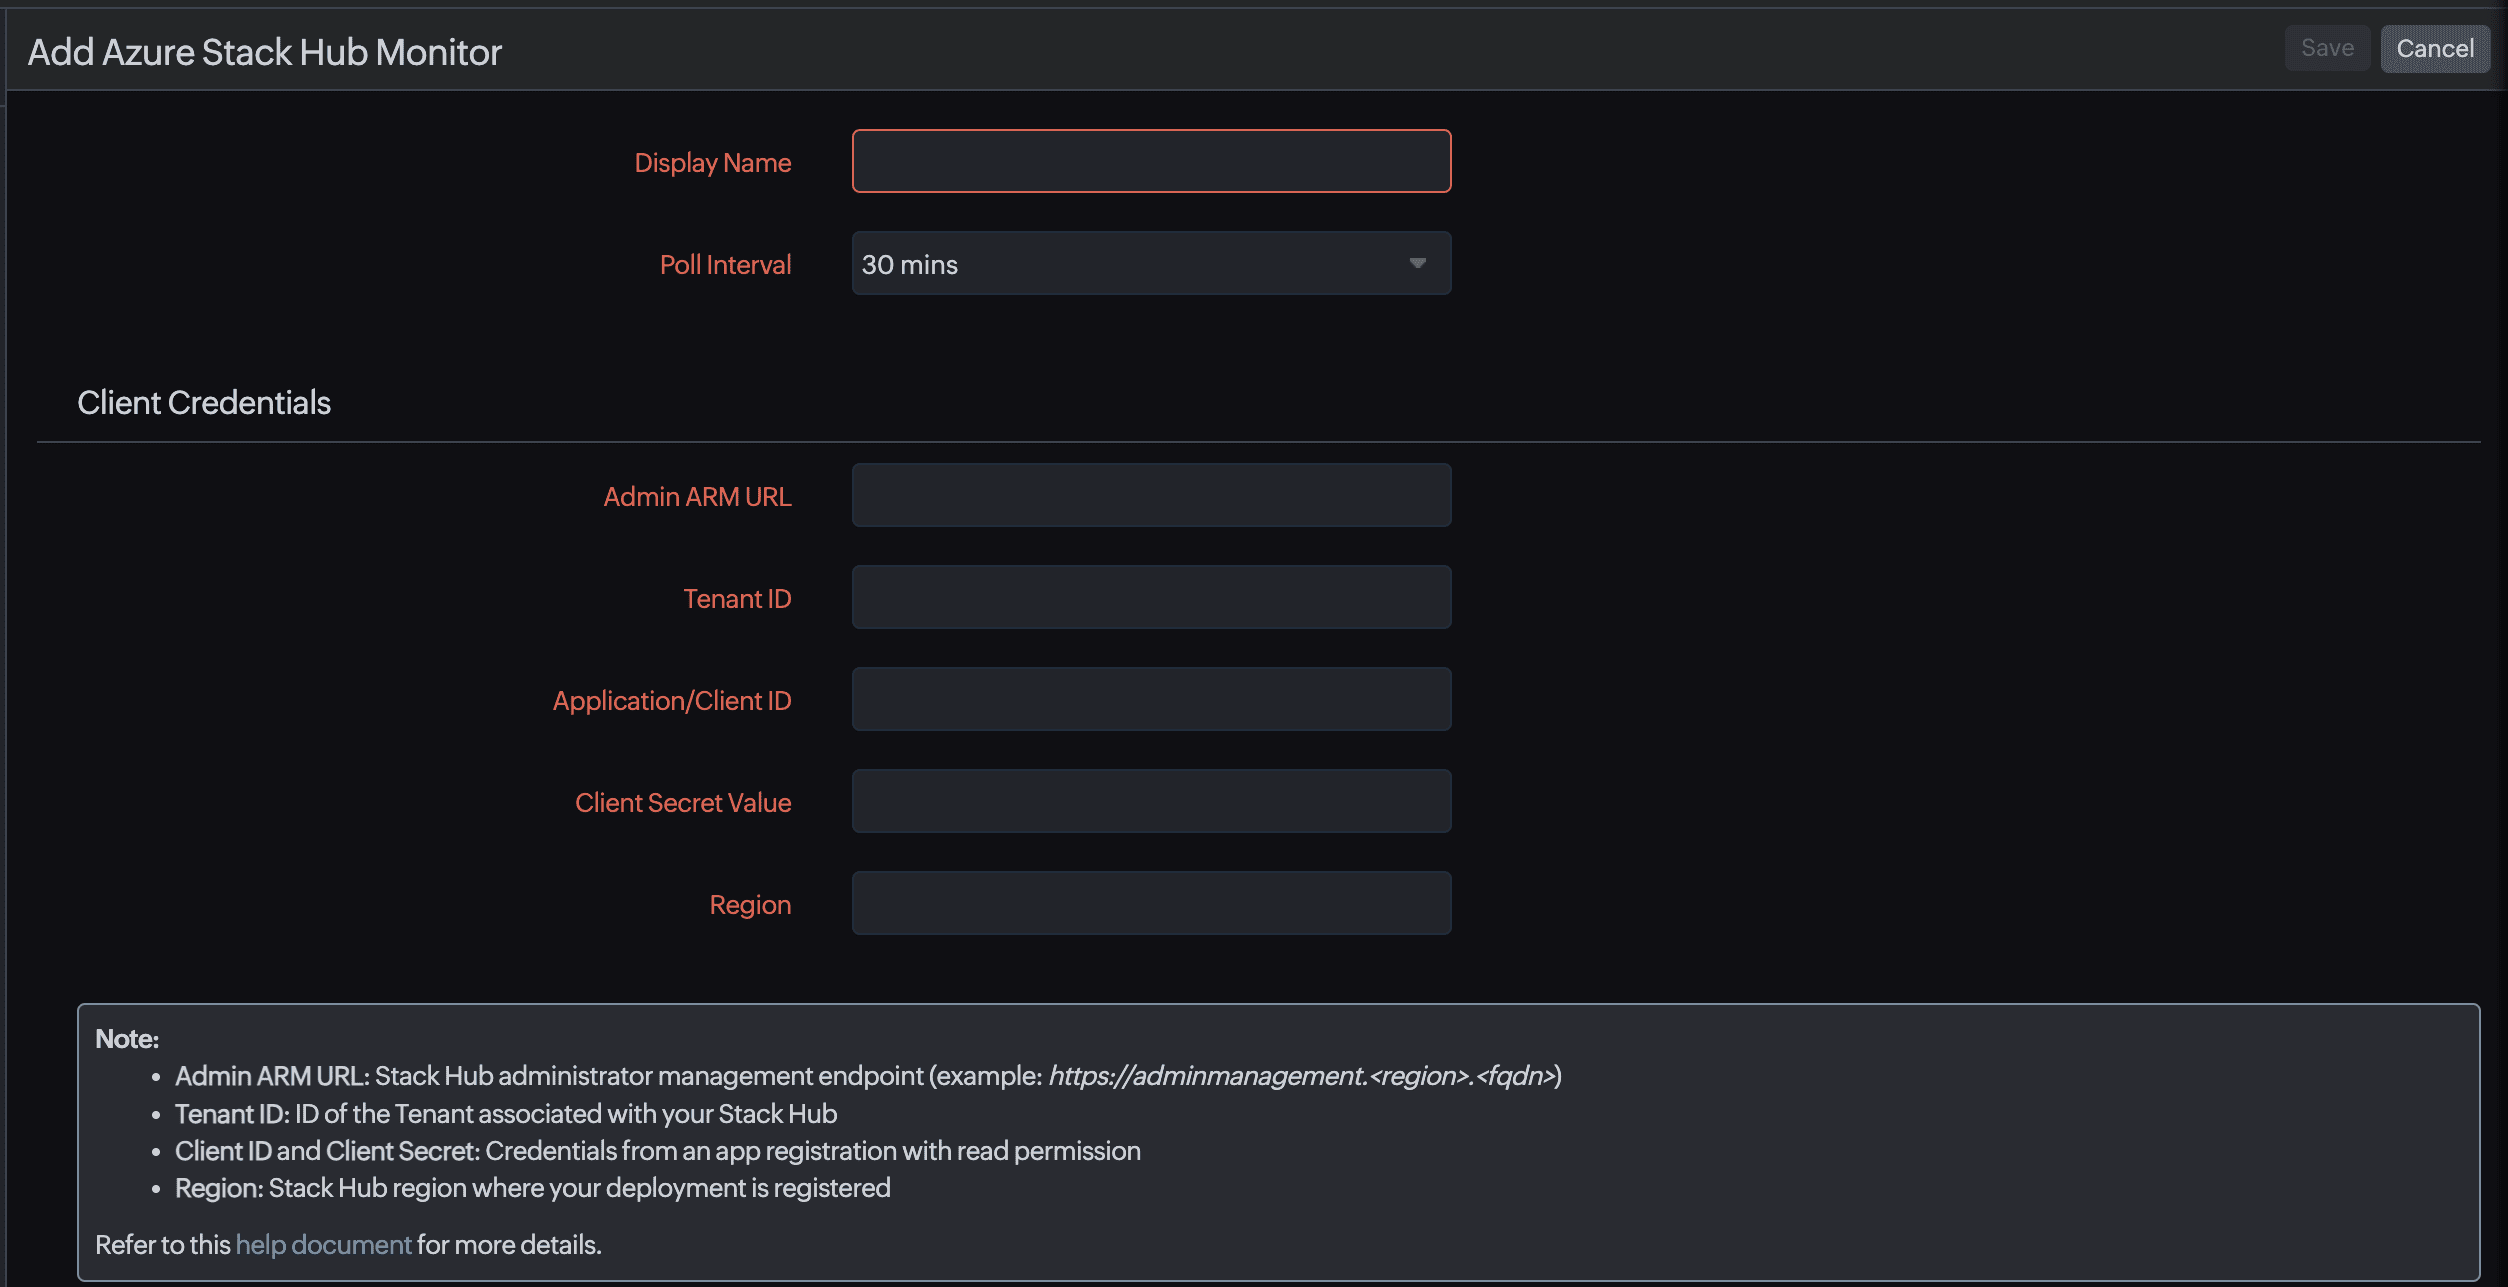
- Enter a Display Name for the monitor.
- Select the Poll Interval. Supported intervals are five, 15, 30 minutes, and 1 hour.
Client Credentials
Provide the following details under the Client Credentials section to connect Site24x7 to your Azure Stack Hub deployment:
| Field | Description |
|---|---|
| Admin ARM URL | The administrator Azure Resource Manager (ARM) endpoint URL for your Azure Stack Hub deployment. |
| Tenant ID | The Azure Active Directory tenant ID associated with your Azure Stack Hub deployment. |
| Application/Client ID | The application (client) ID of the service principal registered to allow Site24x7 to authenticate with Azure Stack Hub. |
| Client Secret Value | The client secret associated with the application (client) ID used for authentication. |
| Region | The region of your Azure Stack Hub deployment. This is auto-fetched based on the Admin ARM URL entered. If the fetched region is incorrect (for example, if the deployment's region was changed), you can manually edit this field. |
The display name, poll interval, and fields under Client Credentials are all that's required to create the monitor. The sections below are optional and can be configured later.
Configuration Profiles
Under the Configuration Profiles section, you can optionally associate the following with the monitor:
- Threshold and availability: Create a new threshold profile or select and edit an existing one to define alerting conditions for this monitor.
- Tags: Associate tags with this monitor to keep it organized and filterable alongside the other monitors across your account.
Alert Settings
Under the Alert Settings section, you can associate the following with the monitor:
- User Alert Group: The group of users to be notified when alerts are triggered.
- On-Call Schedule: The on-call schedule that determines who is notified during specific time windows.
- Notification Profile: The notification profile defining how and where alerts are sent.
Third-party Integrations
Under the Third-Party Integrations section, you can select any existing third-party configurations, such as Jira or Zoho Desk, to automatically raise tickets when alerts occur on this monitor.
Once you've configured the required and any optional fields, click Save to create the monitor.
View Azure Stack Hub monitors
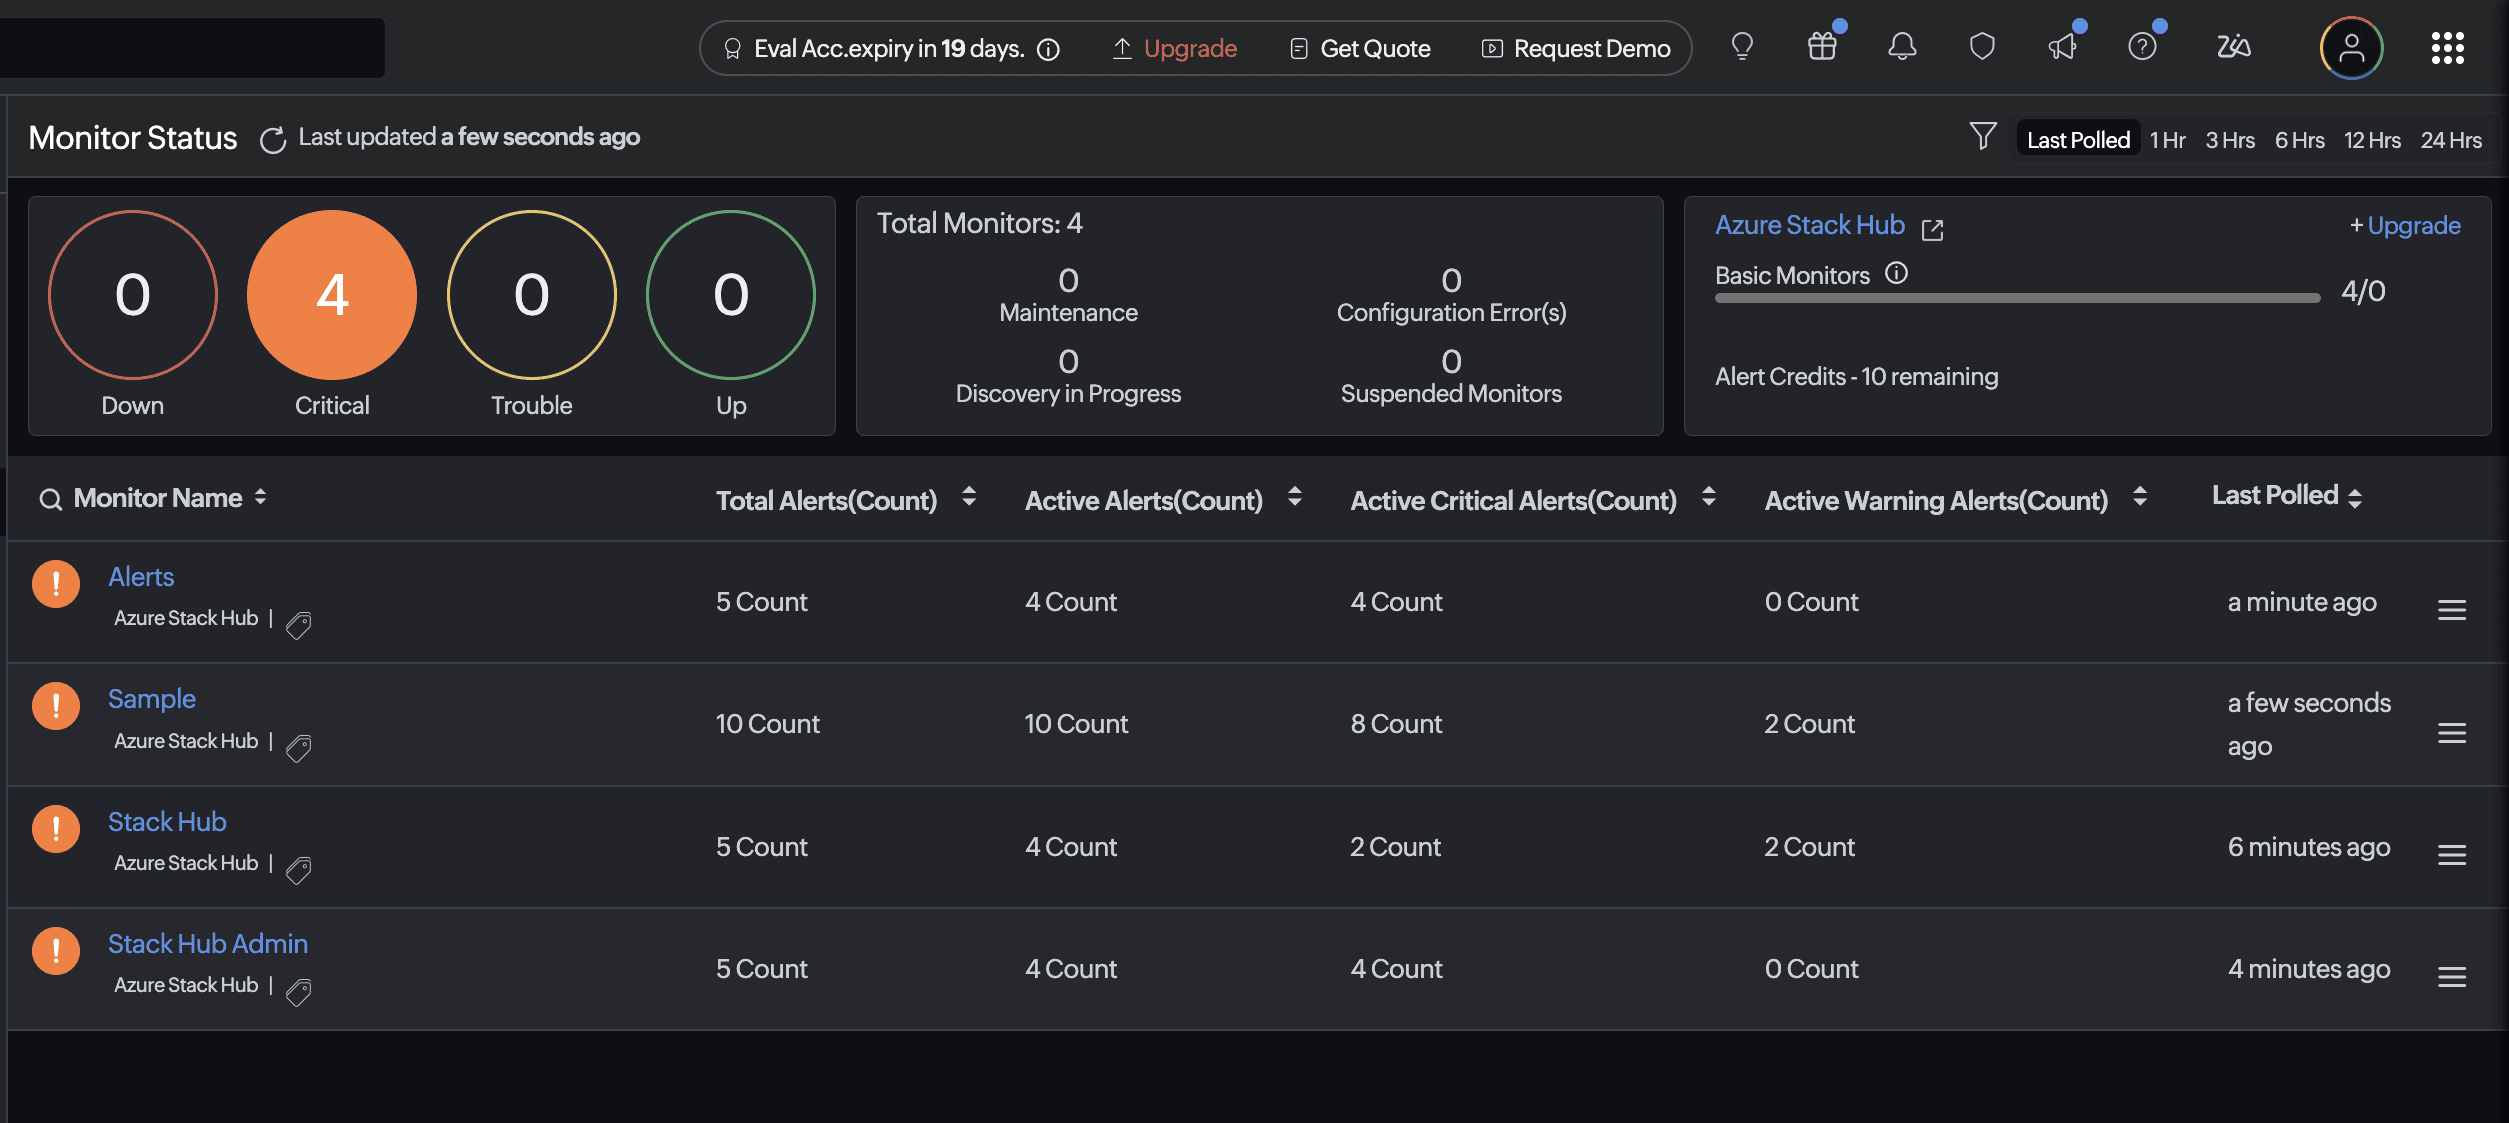
To view all your Azure Stack Hub monitors, navigate to Cloud > Azure > Azure Stack Hub Monitors in the left navigation menu. This lists all configured Azure Stack Hub monitors in your account.
Click a monitor to open it and view its metrics. All listed metrics are organized by widget.
Edit a monitor
To edit a monitor's configuration:
- Open the Azure Stack Hub monitor you want to edit.
- Click the hamburger
 icon next to the monitor's name.
 - Click Edit.
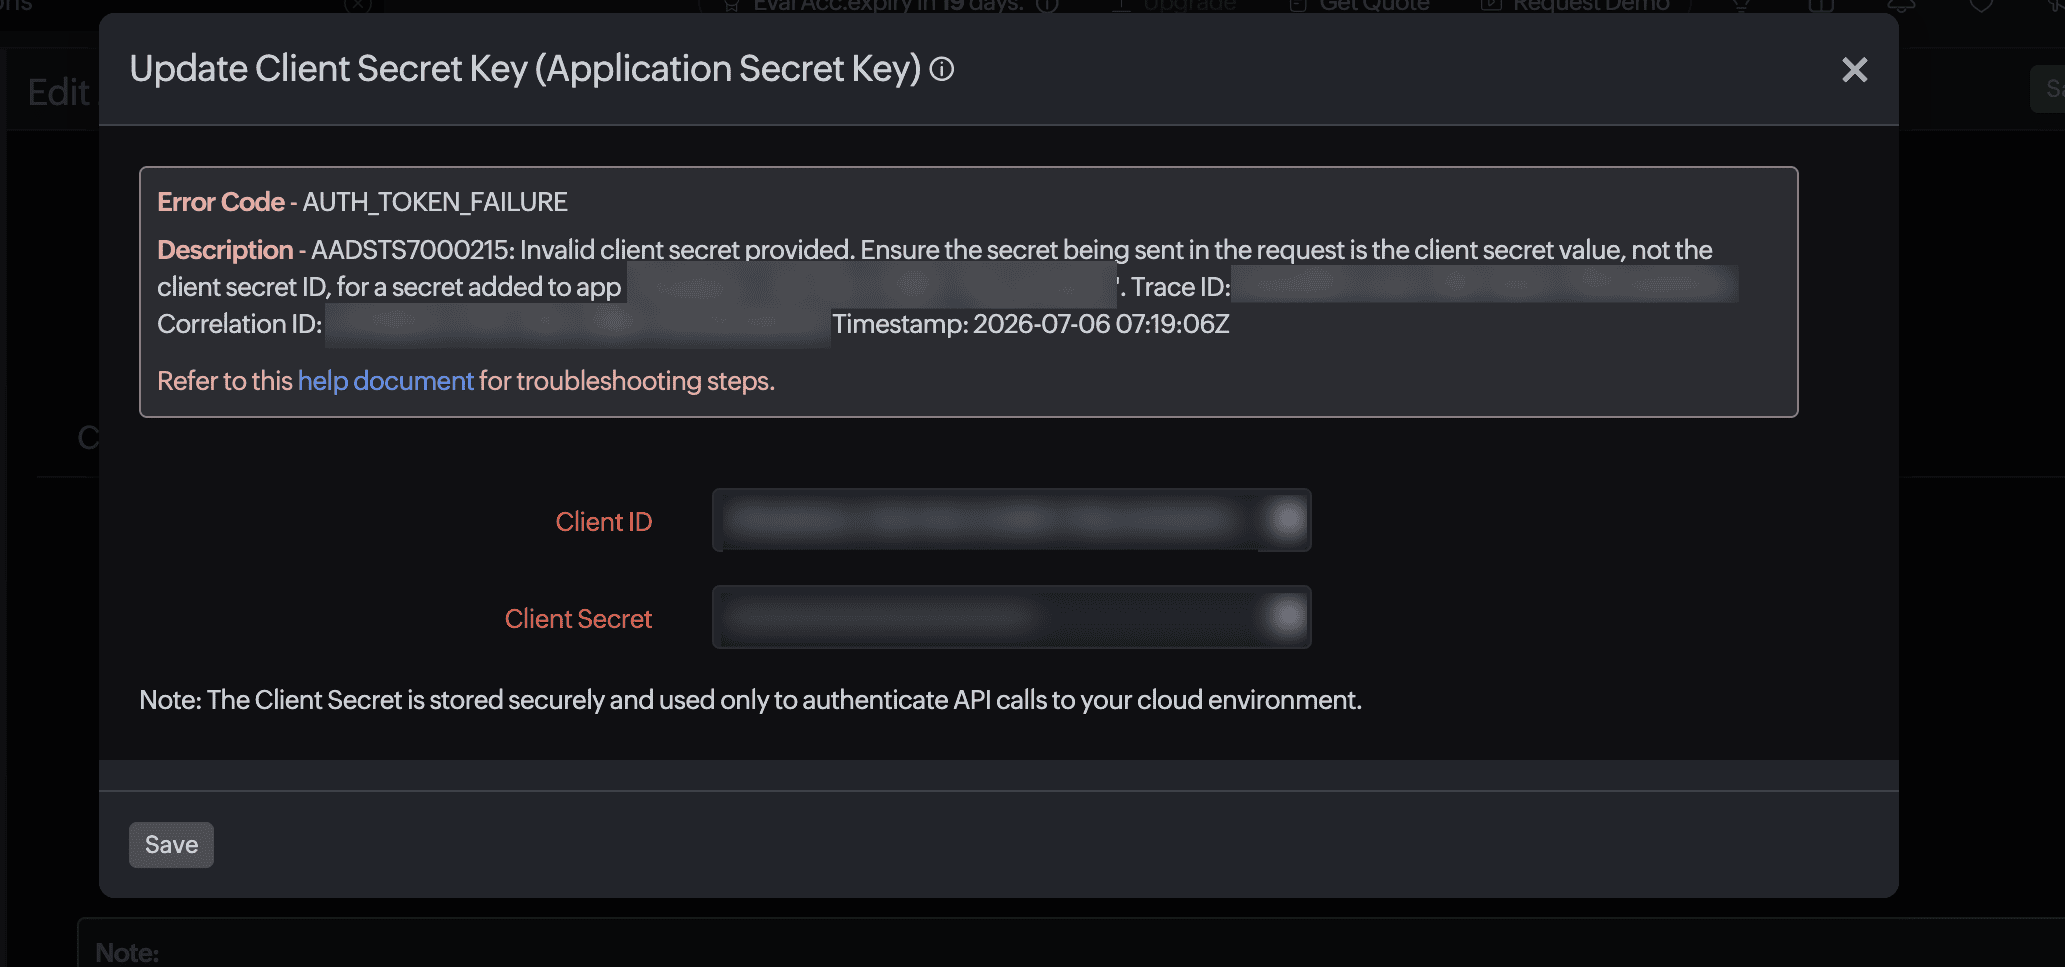
- On the Edit page, the Client Secret value is hidden behind a pencil
 icon next to the Application/Client ID field. This is intentional and protects the confidentiality of the credential. Click the pencil icon only if you need to update the client secret.
Monitored metrics
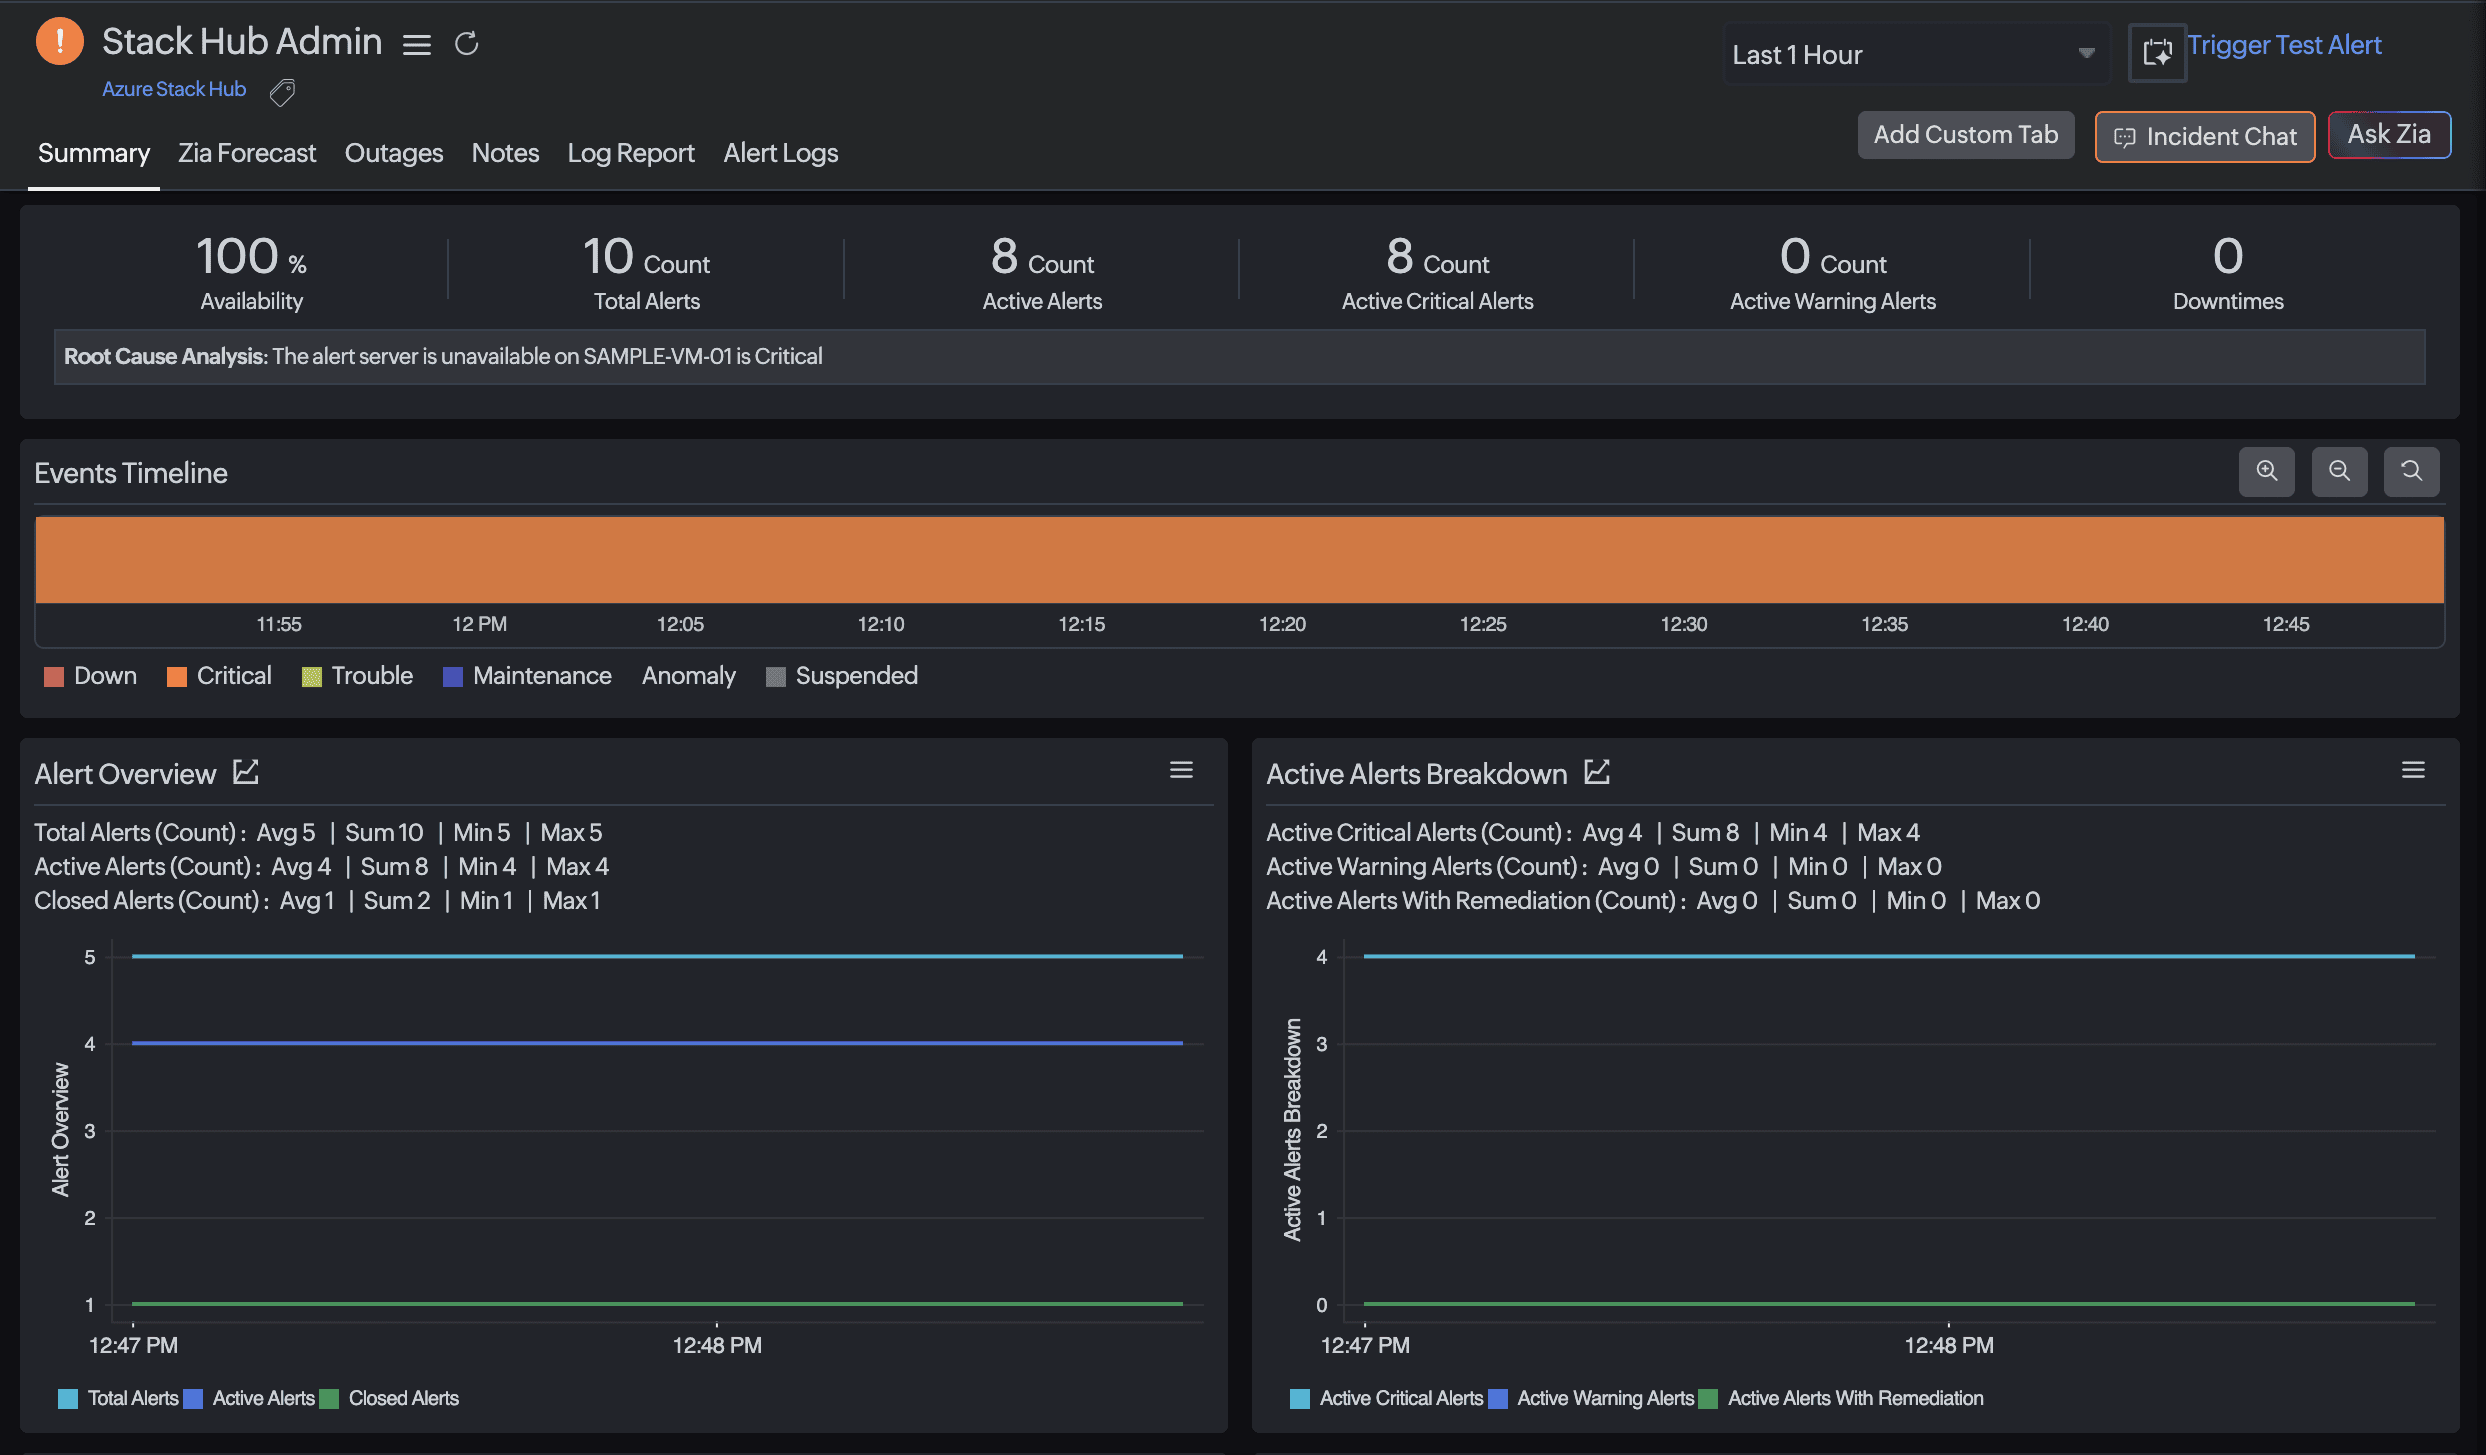
The Azure Stack Hub monitor dashboard organizes alert data into the following widgets:
Alert Overview
| Metric name | Description |
|---|---|
| Total Alerts | The total number of alerts generated by the Azure Stack Hub deployment, regardless of status or severity. |
| Active Alerts | The number of alerts currently in an Active (unresolved) state. |
| Closed Alerts | The number of alerts that have been resolved or closed. |
Active Alerts Breakdown
| Metric name | Description |
|---|---|
| Active Critical Alerts | The number of currently active alerts with a severity of Critical. |
| Active Warning Alerts | The number of currently active alerts with a severity of Warning. |
| Active Alerts with Remediation | The number of currently active alerts for which a remediation action or recommendation is available. |
Category Alerts
| Metric name | Description |
|---|---|
| Backup Related Alerts | The number of alerts related to backup operations within the Azure Stack Hub deployment. |
| Update Related Alerts | The number of alerts related to update operations within the Azure Stack Hub deployment. |
Active Alerts
This widget lists the individual alerts that are currently active on the Azure Stack Hub deployment along with their details as reported by Azure Stack Hub.
Alert Metrics
This widget lists the latest collected value of all the monitored metrics for reporting and threshold configuration purposes:
| Metric name | Unit |
|---|---|
| Total Alerts | Count |
| Active Alerts | Count |
| Closed Alerts | Count |
| Active Critical Alerts | Count |
| Active Warning Alerts | Count |
| Active Alerts with Remediation | Count |
| Backup Related Alerts | Count |
| Update Related Alerts | Count |
Set up alerts
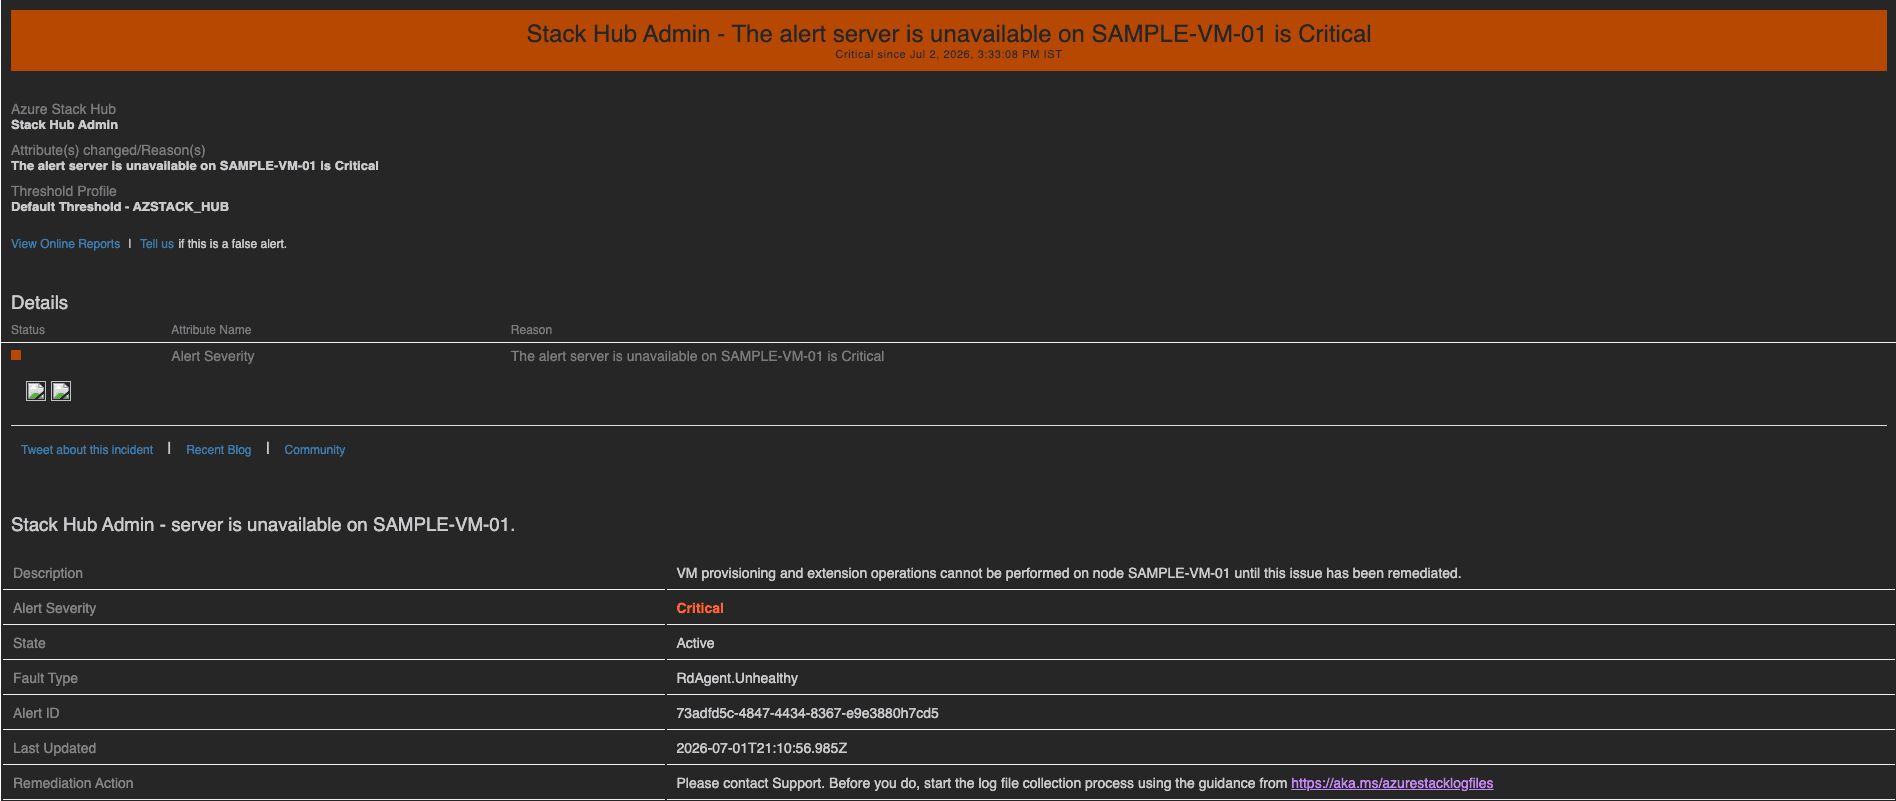
Alerts for an Azure Stack Hub monitor are configured through a threshold profile. The monitor has an associated default threshold profile which lists alert criteria based on industry standards. In addition to threshold breaches, when an alert is cleared in Azure Stack Hub, you'll be notified about that as well. You can access the threshold profile from the Configuration Profiles section while adding or editing a monitor:
- Click the plus + icon to create a new threshold profile.
- Click the pencil icon next to the Default Threshold profile to edit it. In the threshold profile for an Azure Stack Hub monitor, you can:
- Set the alert count threshold for each monitored metric listed under Alert Metrics.
- Trigger an alert based on the Alert Severity parameter: Warning or Critical. This severity value is parsed directly from the alert as reported by Azure Stack Hub itself.
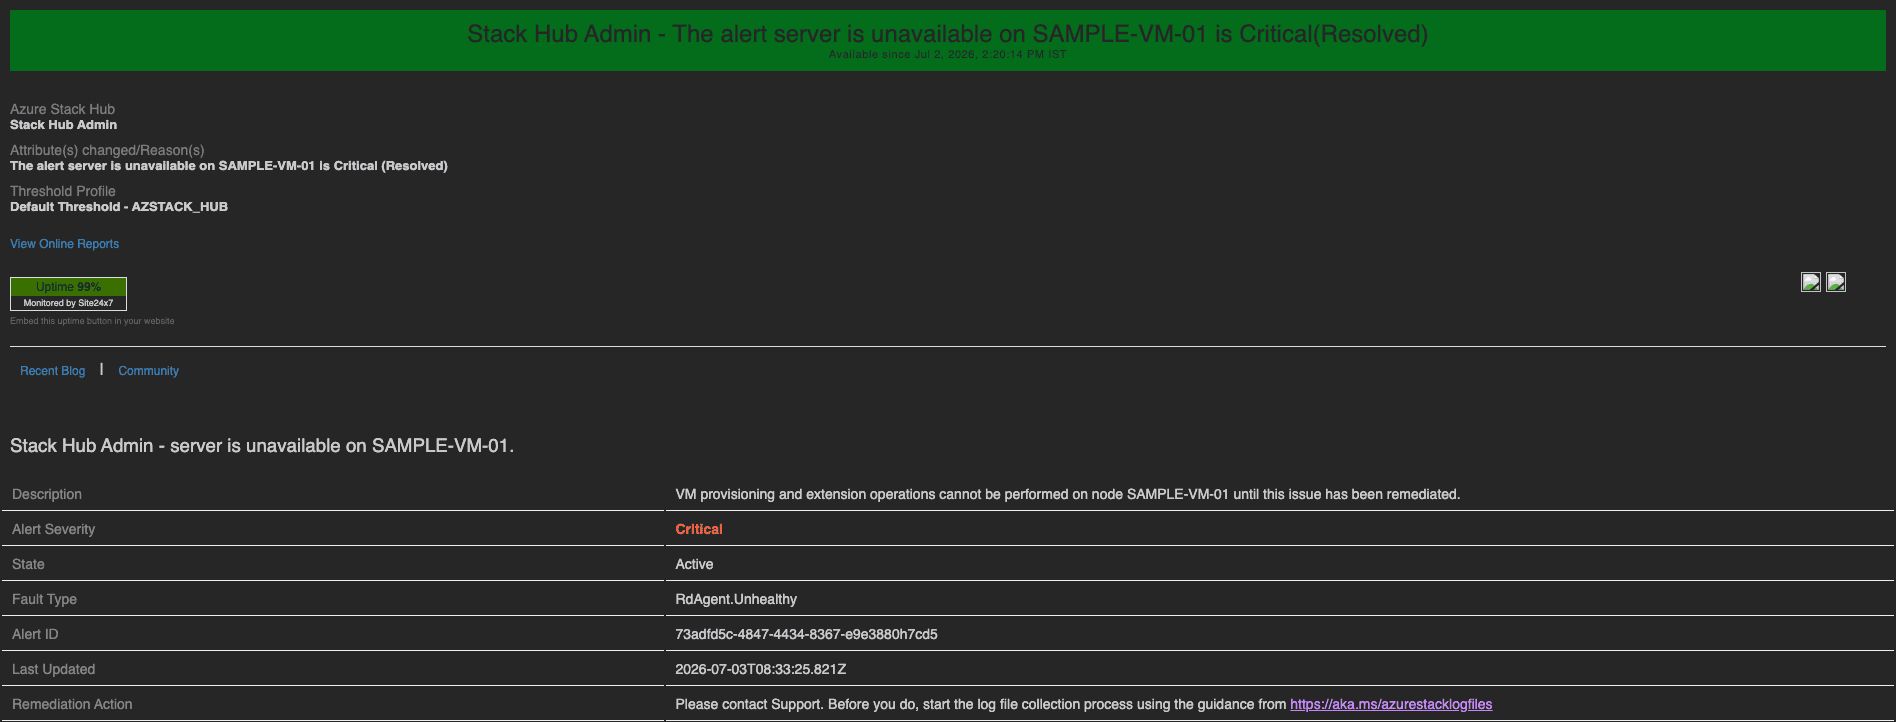
Use the Alert Severity condition alongside count-based thresholds to be notified immediately when a Critical alert occurs while still reserving count-based thresholds for lower-severity, high-volume alert types.