Azure Network Interface Monitoring Integration
An Azure network interface enables an Azure Virtual Machine (VM) to communicate with the Internet, Azure, and on-premises resources.
With Site24x7's integration, you can now monitor your network interfaces, get accurate metrics, configure thresholds, automate tasks, and stay on top of outages.
Set up and configuration
Adding an Azure network interface while configuring a new Azure monitor
If you haven't configured an Azure Monitor yet, add one by following the steps below:
- Log in to your Site24x7 account.
- Choose Cloud from the left navigation pane, select Azure > Add Azure Monitor. You can also follow these steps to add an Azure Monitor.
- During Azure monitor configuration, in the Edit Azure Monitor page, select Azure Network Interface from the Service/Resource Types drop-down.
Adding an Azure network interface to an existing Azure monitor
If you already have an Azure monitor configured for the tenant, you can add the Azure network interface by using the following steps:
- Log in to your Site24x7 account.
- Navigate to the Infrastructure/Inventory/Management Dashboards from the left pane of the Azure monitor for which you wish to add an Azure network interface.
- Click this
 icon and then Edit, which will bring you to the Edit Azure Monitor page.
 - In the Edit Azure monitor page, select the corresponding Subscription and Resource Group from the drop-down menu, select Azure Network Interface from the Service/Resource Types drop-down, and click Save.
After successful configuration, go to Cloud > Azure, select Azure Network Interface from the Azure monitor drop-down. Now you can view the discovered network interfaces.
It will take 15-30 minutes to discover new Azure resources. For immediate discovery of the selected configuration, go to the Infrastructure Dashboard of the Azure monitor and click on Discover Now from the ![]() icon.
icon.
Polling frequency
Site24x7's Azure Network Interface Monitor collects metric data every minute and the statuses from your network interfaces every five minutes.
Supported metrics
The following metrics are collected:
| Metric name | Description | Statistic | Unit |
|---|---|---|---|
| Bytes Received | Number of bytes the network interface received | Average | Bytes |
| Bytes Sent | Number of bytes the network interface sent | Average | Bytes |
| Packets Received | Number of packets the network interface received | Average | Count |
| Packets Sent | Number of packets the network interface sent | Average | Count |
Threshold configuration
Global configuration
- Go to the Admin section on the left navigation pane.
- Select Configuration Profiles from the left pane and choose the Threshold and Availability (+) tab from the drop-down menu.
- Choose the monitor type as Azure Network Interface.
You can also set the threshold values for all the metrics mentioned above.
Monitor-level configuration
- Go to Cloud > Azure and select Azure Network Interface from the drop-down menu.
- Choose a resource for which you would like to set a threshold and then click this
 icon on the top. Choose the Edit option, which directs you to the Edit Azure Network Interface Monitor page.

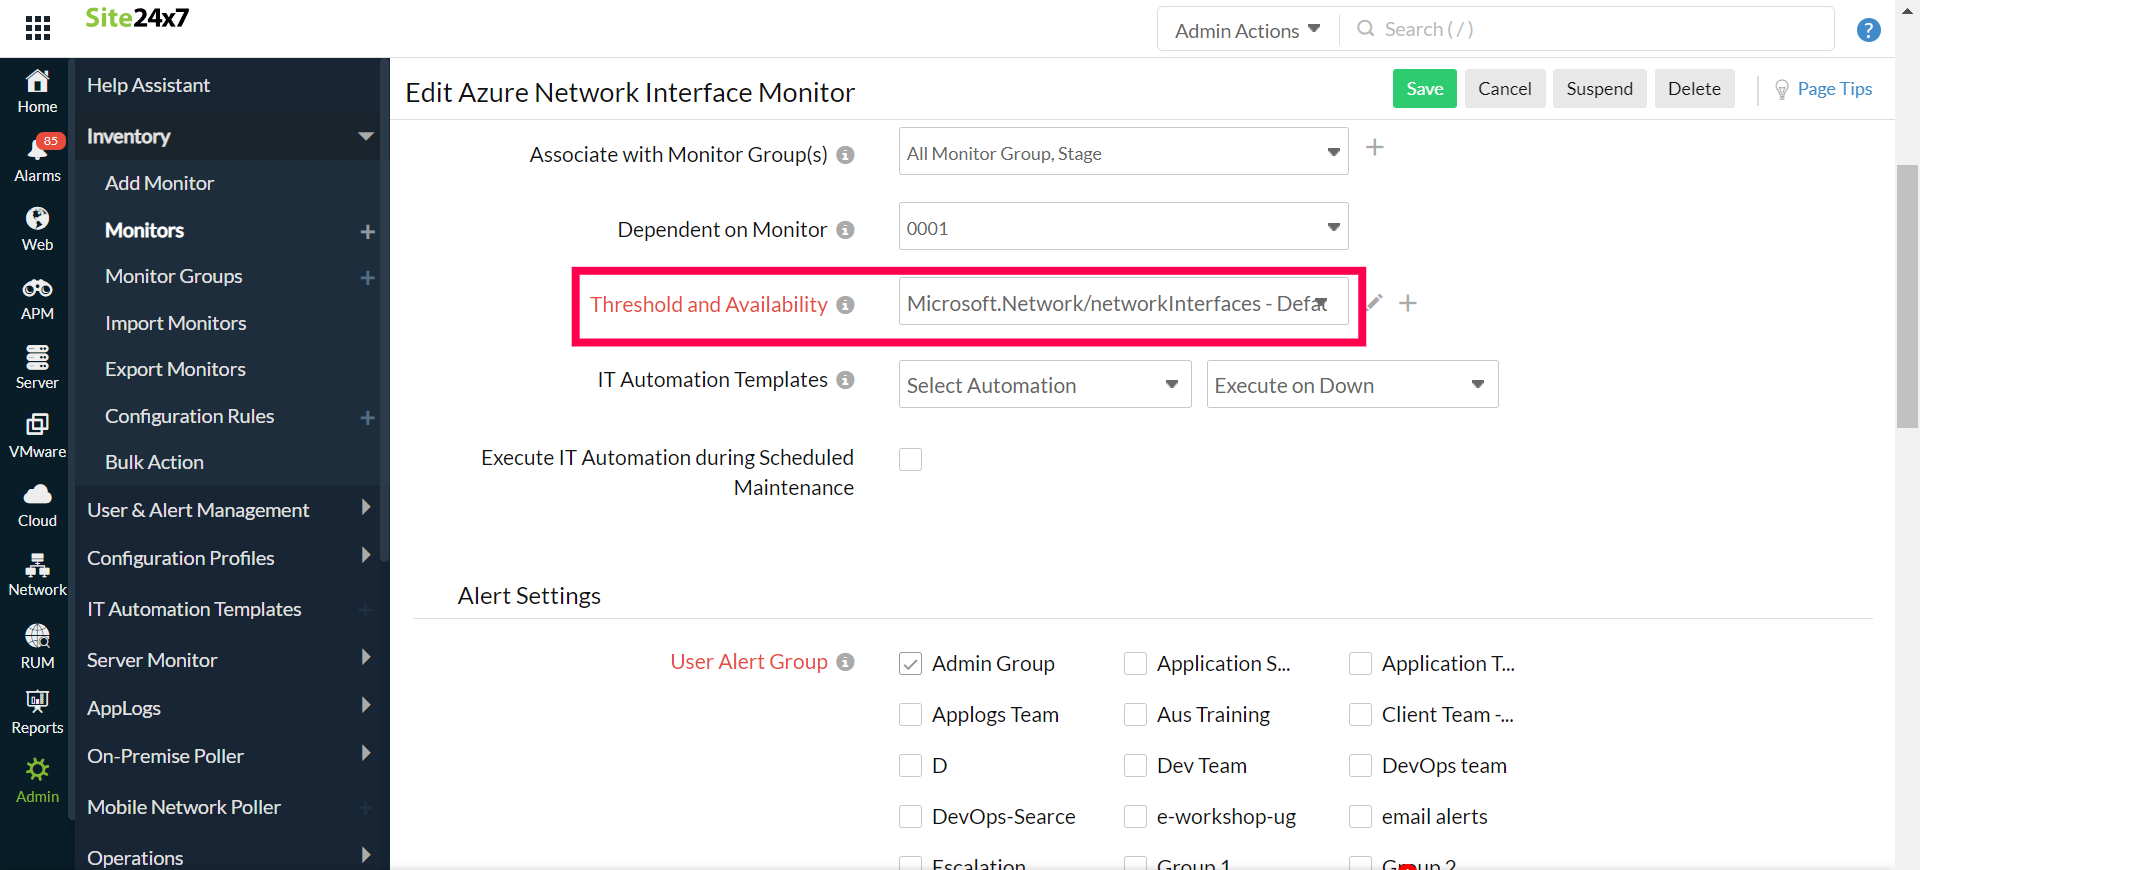
You can set the threshold values for the metrics by selecting the Threshold and Availability option. You can also configure IT automation at the attribute level.
IT automation
Site24x7's IT automation tools helps in auto-resolving performance degradation issues. The alarm engine continually evaluates the system events for which thresholds are set, and executes the mapped automation when there is a breach.
How to configure IT automation for a monitor.
Configuration Rules
Configure Threshold Profile, Notification Profile, Tags, Monitor Group, and other parameters for multiple monitors with Site24x7's Configuration Rules. You can run a scan and associate any of the previously generated rules that suit the monitor configurations while adding new monitors.
How to add a configuration rule.
Summary
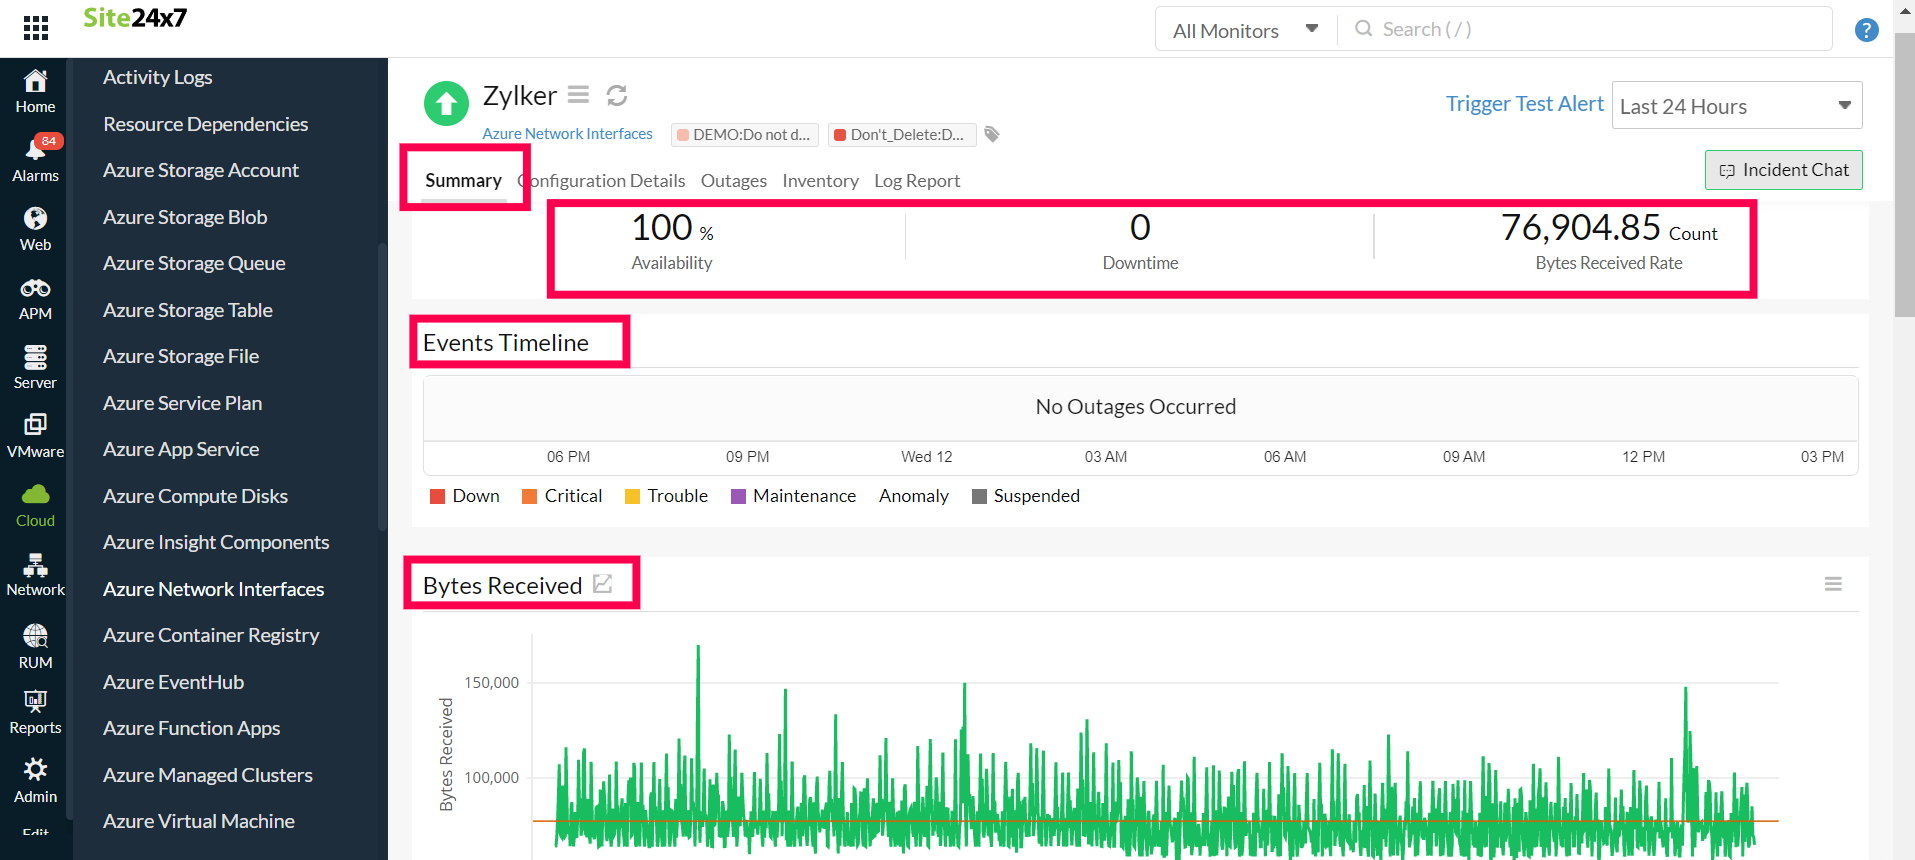
The summary tab will give you the performance data organized by time for the above mentioned metrics.
- To view the summary, go to Cloud > Azure and click the Azure monitor > Azure Network Interface.
- Click a resource and select the Summary tab.
By doing so, you can view the Availability, Downtime, Inbound and Outbound Billable Network, and much more.
Configuration Details
The Configuration Details of an application instance are provided under this tab. Here, you'll find the Pricing Tier, Operational State, IP Configurations, HTTP Port Configurations and so on.
- To get the configuration details, go to Cloud > Azure and click the Azure monitor > Azure Network Interface.
- Click a resource and select the Configuration Details tab.
Reports
Gain in-depth data about the various parameters of your monitored resources and accentuate your service performance using our insightful reports.
To view reports for Azure network interfaces:
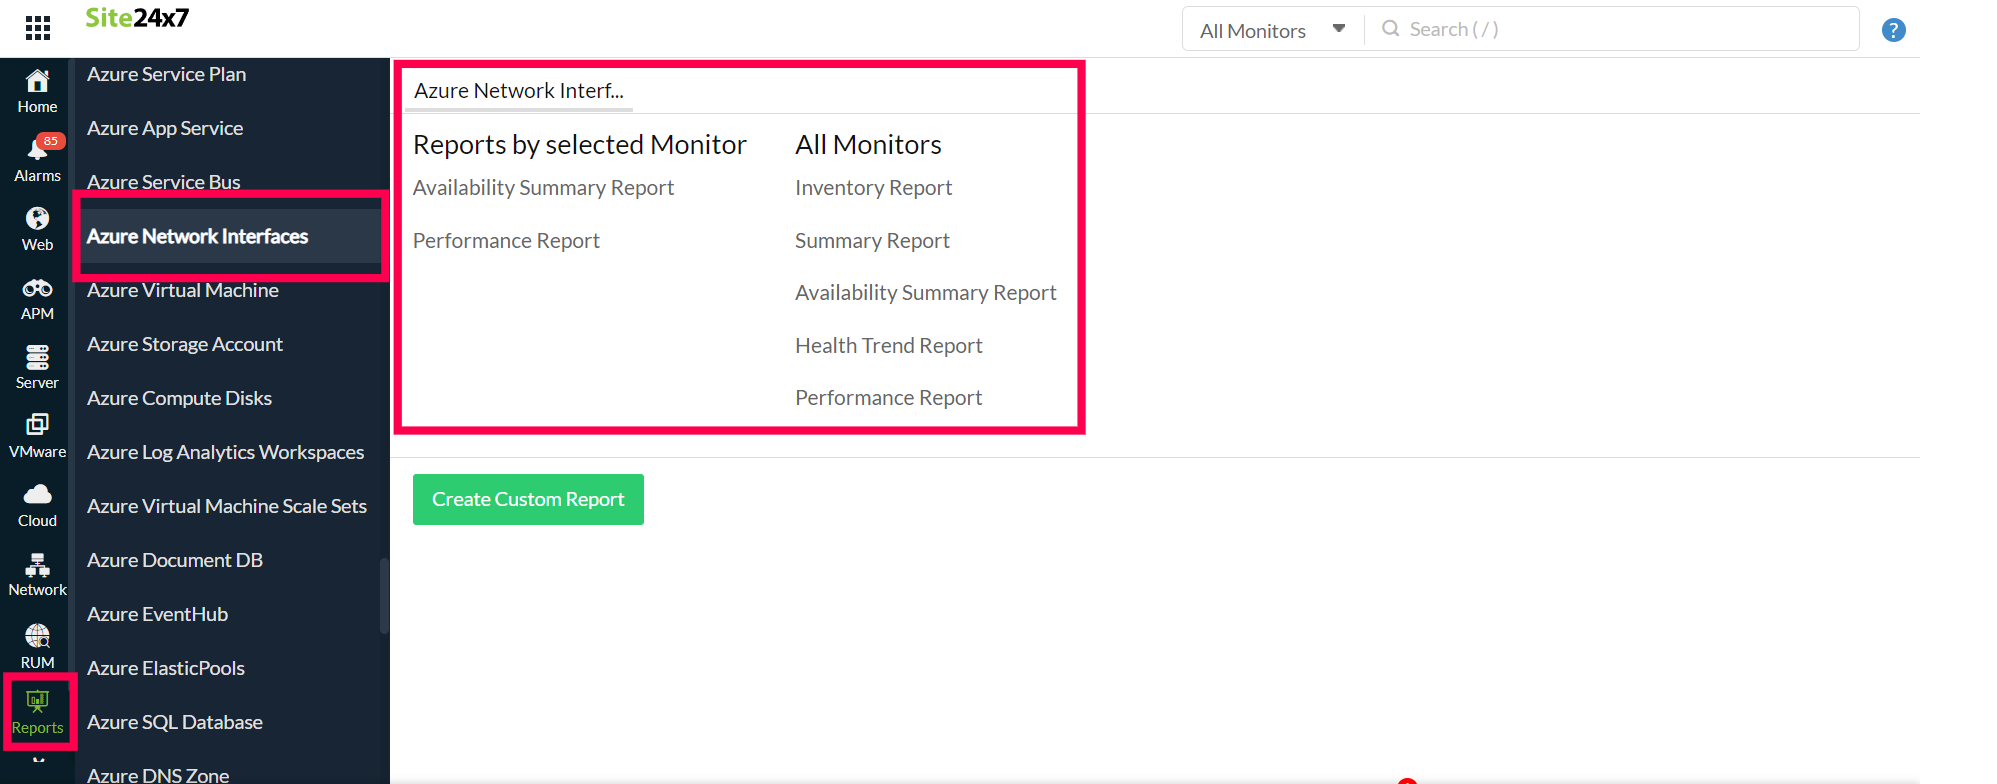
- Navigate to the Reports section on the left navigation pane.
- Select Azure Network Interface from the menu on the left.
You can find the Availability Summary Report and the Performance Report for one selected monitor or you can get the Inventory Report, Summary Report, Availability Summary Report, Health Trend Report, and the Performance Report for all the network interface monitors.

You can also get reports from the Summary tab of the Azure Network Interface Monitor.
- Go to the Summary tab of the Azure Network Interface Monitor, and get the Availability Summary Report of the monitor by clicking on Availability or Downtime.
- You can also find the Performance Report of the monitor by clicking on any chart title.

Related links
How to integrate an Azure App Service monitor
How to integrate an Azure Virtual Machine Monitor
