Azure NetApp File Volume monitoring integration
Azure NetApp File Volume is a metered file storage service that enables you to manage your existing file volumes for compatibility and high performance by editing and deleting them as per your storage needs.
With Site24x7's integration, you can now monitor your NetApp File Volume with reliable metrics, define thresholds, and get alerts when there is a breach.
Setup and configuration
- Adding Azure NetApp File Volume while configuring a new Azure monitor
If you haven't configured an Azure monitor yet, add one by following the steps below:
- Log in to your Site24x7 account.
- Choose Cloud from the left navigation pane, select Azure > Add Azure Monitor. You can also follow these steps to add an Azure monitor.
- During Azure monitor configuration, on the Add Azure Monitor page, select Azure NetApp File Volume from the Service/Resource Types drop-down.
- Adding Azure NetApp File Volume to an existing Azure monitor
If you already have an Azure monitor configured for the tenant, you can add Azure NetApp File Volume by using the following steps:
- Log in to your Site24x7 account.
- Go to Cloud > Azure > your Azure monitor > and then navigate to any of the dashboards from the left pane of your Azure monitor.
- Click the hamburger icon
 and then Edit, which will bring you to the Edit Azure Monitor page.
 - On the Edit Azure Monitor page, select the corresponding Subscription and Resource Group from the drop-down menu, select Azure NetApp File Volume from the Service/Resource Types drop-down, and click Save.
After successful configuration, go to Cloud > Azure, and select Azure NetApp File Volume from the Azure Monitor drop-down. Now you can view the discovered Azure NetApp File Volume.
It will take 15-30 minutes to discover new Azure resources. For immediate discovery of the selected configuration, go to the Infrastructure dashboard of the Azure monitor and click Discover Now from the hamburger icon.
Polling frequency
Site24x7's Azure NetApp File Volume monitor collects metric data every minute, and the minute by minute of your NetApp File Volume is shown.
The following metrics are collected:
| Metric name | Description | Statistic | Unit |
|---|---|---|---|
| Average Read Latency | The average read latency per operation | Average | MilliSeconds |
| Average Write Latency | The average write latency per operation | Average | MilliSeconds |
| Is Volume Backup Suspended | The status of the backup policy suspended for the volume. 0 if yes, and 1 if no | Average | Count |
| Volume Backup Bytes | The total bytes backed up for this volume | Average | Bytes |
| Is Volume Backup Operation Complete | The status if the last volume backup or restore operation completed successfully. 1 if yes, and 0 if no | Average | Count |
| Volume Backup Last Transferred Bytes | The total amount of bytes transferred for last backup or restore operation | Average | Bytes |
| Is Volume Backup Enabled | The status if the backup is enabled for the volume. 1 if yes, 0 if no | Average | Count |
| Other Throughput | The other throughput (not read or write) in bytes per second | Average | Bytes per Second |
| Read IOPS | The read IO operations per second | Average | Count per Second |
| Read Throughput | The read throughput in bytes per second | Average | Bytes per Second |
| Total Throughput | The sum of all throughputs in bytes per second | Average | Bytes per Second |
| Volume Allocated Size | The provisioned size of a volume | Average | Bytes |
| Percentage Volume Consumed Size | The percentage of the volume consumed including snapshots | Average | Percent |
| Volume Cool Tier Data Read Size | The data read in using GET per volume | Average | Bytes |
| Volume Cool Tier Data Write Size | The data tiered out using PUT per volume | Average | Bytes |
| Volume Cool Tier Size | The average volume footprint for cool tier | Average | Bytes |
| Volume Consumed Size | The logical size of the volume (used bytes) | Average | Bytes |
| Volume Snapshot Size | The size of all snapshots in the volume | Average | Bytes |
| Write IOPS | The write input/output (IO) operations per second | Average | CountPerSecond |
| Write Throughput | The write throughput in bytes per second | Average | Bytes per Second |
| Is Volume Replication Status Healthy | The condition of the relationship, 1 or 0 | Average | Count |
| Volume Replication Lag Time | The amount of time in seconds by which the data on the mirror lags behind the source | Average | Seconds |
| Volume Replication Last Transfer Duration | The amount of time in seconds it took for the last transfer to complete | Average | Seconds |
| Volume Replication Last Transfer Size | The total number of bytes transferred as part of the last transfer | Average | Bytes |
| Volume Replication Progress | The total amount of data transferred for the current transfer operation | Average | Bytes |
| Is Volume Replication Transferring | The status if the volume replication is transferring | Average | Count |
| Volume Replication Total Transfer | The cumulative bytes transferred for the relationship | Average | Bytes |
Threshold configuration
- Global configuration
- Go to the Admin section in the left navigation pane.
- Select Configuration Profiles from the left pane and choose the Threshold and Availability (+) tab from the drop-down menu. Click Add Threshold Profile in the top-right corner.
- Choose the monitor type as Azure NetApp File Volume. Now you can set the threshold values for all the metrics mentioned above.
- Monitor-level configuration
- Go to Cloud > Azure and select Azure NetApp File Volume from the drop-down menu.
- Choose a resource for which you would like to set a threshold and then click the hamburger icon
 . Choose the Edit option, which will direct you to the Edit Azure NetApp File Volume Monitor page.
 - You can set the threshold values for the metrics by selecting the Threshold and Availability option. You can also configure IT Automation at the attribute level.
IT Automation
Site24x7's IT Automation tools help auto-resolve performance degradation issues. The alarm engine continually evaluates the system events for which thresholds are set, and executes the mapped automation when there is a breach.
Configuration Rules
Configure parameters like Threshold Profile, Notification Profile, Tags, Monitor Group, and others for multiple monitors with Site24x7's Configuration Rules. You can run a scan and associate any of the previously generated rules that suit the monitor configurations while adding new monitors.
Summary
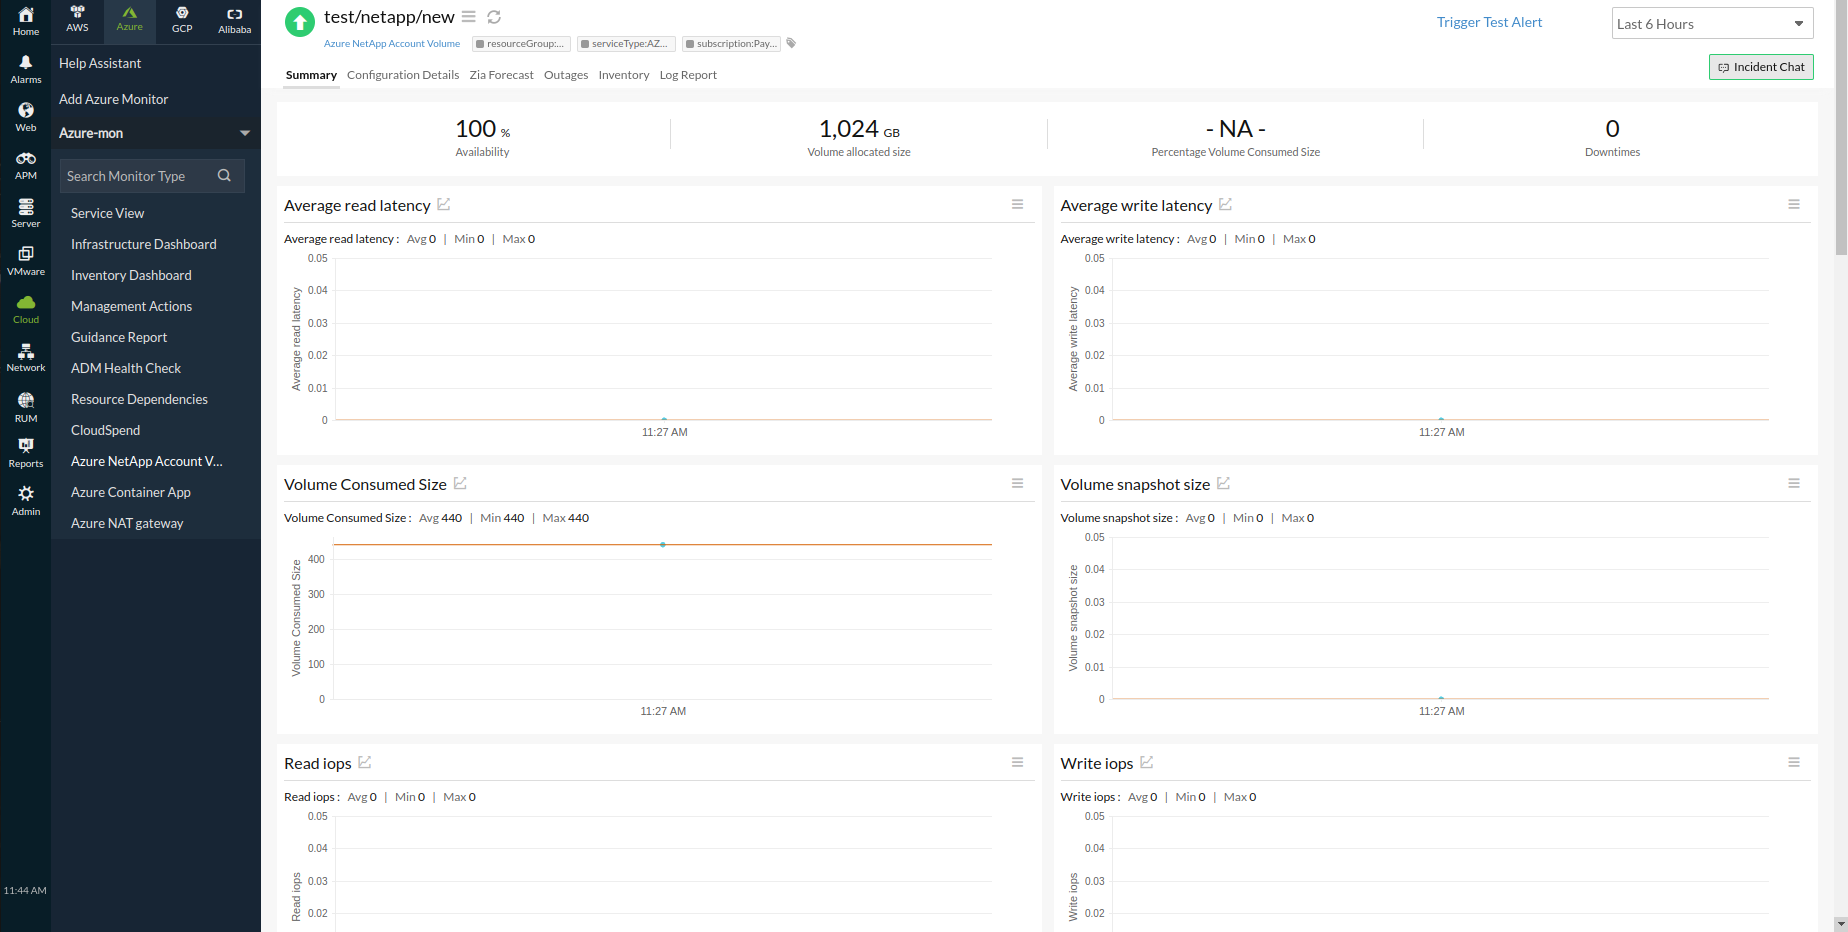
The Summary tab will give you the performance data organized by time for the above-mentioned metrics.
- To view the summary, go to Cloud > Azure and click Azure monitor > Azure NetApp File Volume.
- Click a resource and select the Summary tab.
By doing so, you can view Average Read Latency, Average Write Latency, Is Volume Backup Suspended, Volume Backup Bytes, and much more.
Configuration Details
The Configuration Details of an application instance are provided under this tab. Here, you'll find the File System Id, Service Level, Creation Token, and so on.
- To get the configuration details, go to Cloud > Azure and click Azure monitor > Azure NetApp File Volume.
- Click a resource and select the Configuration Details tab.
Reports
Gain in-depth data about the various parameters of your monitored resources and highlight your service performance using our insightful reports.
To view reports for Azure NetApp File Volume:
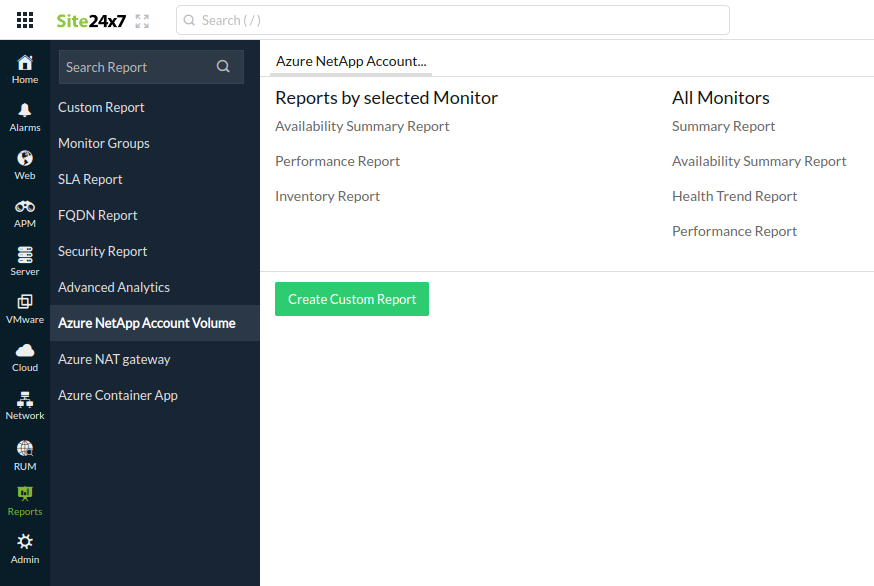
- Navigate to the Reports section in the left navigation pane.
- Select Azure NetApp File Volume from the menu on the left.
You can find the Availability Summary Report and the Performance Report for one selected monitor, or you can get the Inventory Report, Summary Report, Availability Summary Report, Health Trend Report, and the Performance Report for all the Azure NetApp File Volume monitors.

You can also get reports from the Summary tab of the Azure NetApp File Volume monitor.
- Go to the Summary tab of the Azure NetApp File Volume monitor, and get the Availability Summary Report of the monitor by clicking Availability or Downtime.
- You can also find the Performance Report of the monitor by clicking any chart title.

