Azure Container Apps monitoring integration
Azure Container Apps is a fully managed serverless container hosting service that enables you to execute applications in containers.
With Site24x7's integration, you can now monitor your container apps with accurate metrics, configure thresholds, and get instant alerts if there is a breach.
Setup and configuration
- Adding Azure Container Apps while configuring a new Azure monitor
If you haven't configured an Azure monitor yet, add one by following the steps below:
- Log in to your Site24x7 account.
- Choose Cloud from the left navigation pane, and select Azure > Add Azure Monitor. You can also follow these steps to add an Azure monitor.
- During Azure monitor configuration, on the Edit Azure Monitor page, select Azure Container Apps from the Service/Resource Types drop-down.
- Adding Azure Container Apps to an existing Azure monitor
If you already have an Azure monitor configured for the tenant, you can add Azure Container Apps using the following steps:
- Log in to your Site24x7 account.
- Go to Cloud > Azure > your Azure monitor > navigate to any of the dashboards from the left pane of your Azure monitor.
- Click the hamburger
 icon and then Edit, which will bring you to the Edit Azure Monitor page.
 - On the Edit Azure Monitor page, select the corresponding Subscription and Resource Group from the drop-down menu, select Azure Container Apps from the Service/Resource Types drop-down, and click Save.
After successful configuration, go to Cloud > Azure, and select Azure Container Apps from the Azure Monitor drop-down. Now you can view the discovered container apps.
New Azure resources will be auto-discovered in the next discovery cycle. For immediate discovery of the selected configuration, go to the Infrastructure Dashboard of the Azure monitor and click hamburger ![]() icon and then click Discover Now.
icon and then click Discover Now.
Polling frequency
Site24x7's Azure Container Apps monitor collects minute-wise metric data and the statuses of your container apps every five minutes.
Supported metrics
| Metric name | Description | Statistic | Unit |
|---|---|---|---|
| Replica Count | The number of replicas of the container app | Maximum | Count |
| Requests | The total number of requests processed | Total | Count |
| Replica Restart Count | The number of times the container app replicas have restarted | Maximum | Count |
| Network In Bytes | The total amount of network received | Total | Bytes |
| Network Out Bytes | The total amount of network transmitted | Total | Bytes |
| CPU Usage | The average CPU consumed by the container app. 1,000,000,000 nano cores = 1 core. | Average | NanoCores |
| Memory Working Set Bytes | The amount of working set memory used | Average | Bytes |
Threshold configuration
- Global configuration
- Click Admin in the left navigation pane.
- Select Configuration Profiles from the left pane and click Threshold and Availability (+) from the drop-down menu. Click Add Threshold Profile in the top-right corner.
- Choose the monitor type as Azure Container Apps. Now you can set the threshold values for all the metrics mentioned above.
- Monitor-level configuration
- Go to Cloud > Azure and select Azure Container Apps from the drop-down menu.
- Choose the resource for which you would like to set threshold and then click the hamburger
 icon . Choose the Edit option, which will direct you to the Edit Azure Container App Monitor page.
 - You can set the threshold values for the metrics by selecting the Threshold and Availability option. You can also configure IT Automation at the attribute level.
IT Automation
Site24x7's IT Automation tools help auto-resolve performance degradation issues. The alarm engine continually evaluates the system events for which thresholds are set, and executes the mapped automation when there is a breach.
How to configure IT Automation for a monitor
Configuration Rules
Configure parameters like Threshold Profile, Notification Profile, Tags, Monitor Group, and others for multiple monitors with Site24x7's Configuration Rules. You can run a scan and associate any of the previously generated rules that suit the monitor configurations while adding new monitors.
How to add a configuration rule
Summary
The Summary tab will give you the performance data organized by time for the above mentioned metrics.
- To view the summary, go to Cloud > Azure and click the Azure monitor > Azure Container Apps.
- Click a resource and click Summary.
By doing so, you can view Replica Count, Requests, Replica Restart Count, and many more metrics.
Configuration Details
The Configuration Details tab provides details on configurations for application instances. Here, you'll find the Container App ID, which contains the Provisioning State, the FQDN, the Target Port, and so on.
- To get the configuration details, go to Cloud > Azure > click the Azure monitor > Azure Container Apps.
- Click a resource and select the Configuration Details tab.
Reports
Gain in-depth data about the various parameters of your monitored resources and highlight your service performance using our insightful reports.
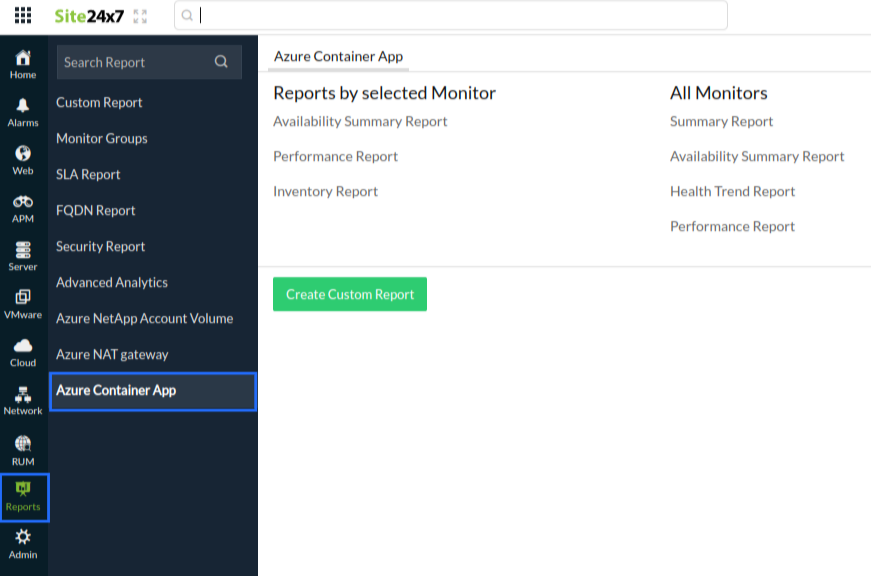
To view reports for Azure Container Apps:
- Navigate to the Reports section on the left navigation pane.
- Select Azure Container Apps from the menu on the left.
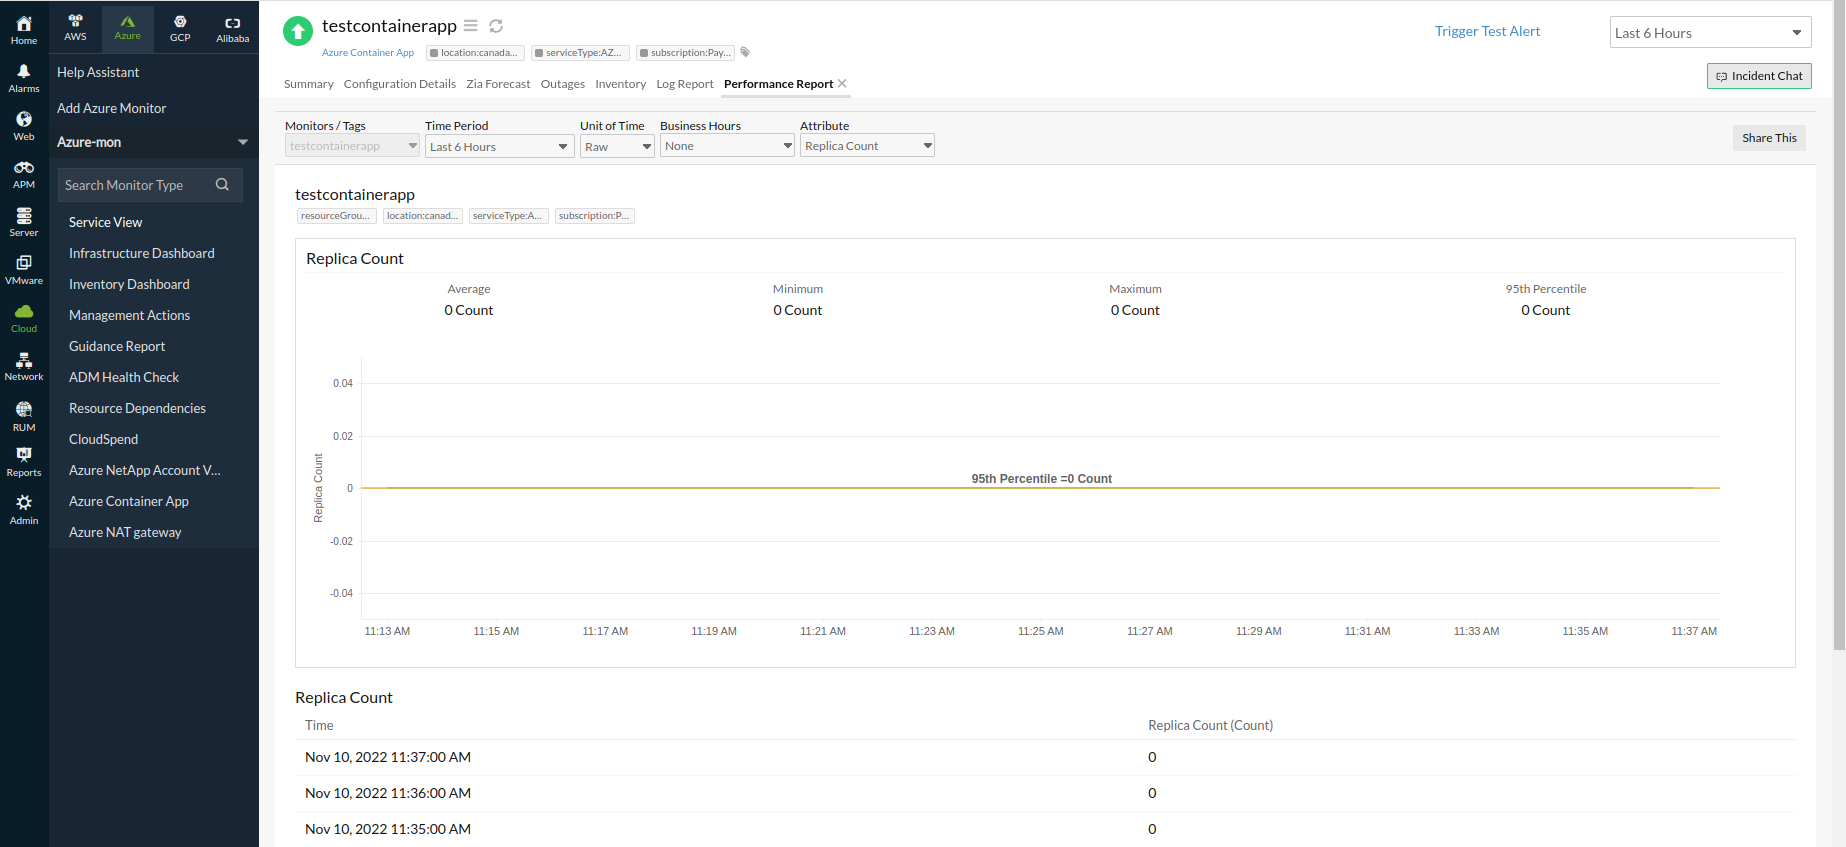
You can find the Availability Summary Report and the Performance Report for one selected monitor, or you can get the Inventory Report, Summary Report, Availability Summary Report, Health Trend Report, and the Performance Report for all the Azure Container Apps monitors.

You can also get reports from the Summary tab of the Azure Container Apps monitor.
- Go to the Summary tab of the Azure Container Apps Monitor, and get the Availability Summary Report of the monitor by clicking on Availability or Downtime.
- You can also find the Performance Report of the monitor by clicking on any chart title.

