AWS Transit Gateway monitoring integration
AWS Transit Gateway helps you to centrally manage the connectivity policies across multiple Amazon Virtual Private Clouds (VPCs) and ensures seamless on-premises connectivity. In this way, Transit Gateway provides ways to simplify network architecture, reduce operational overhead, and centrally manage external connectivity.
Site24x7's integration with Transit Gateway also provides the Transit Gateway Attachment monitor to help you track and stay updated on the attachment performance and ensuring seamless connectivity across your AWS VPCs.
Use case
Consider a scenario where your AWS infrastructure relies on a Transit Gateway connecting multiple VPCs. By incorporating the Transit Gateway Monitor and Transit Gateway Attachment Monitor into Site24x7, you proactively gain insights about and monitor your network's health.
In the event of unusual traffic patterns, disruptions, or attachment issues, Site24x7 promptly alerts you. This capability empowers you to quickly detect, troubleshoot, and resolve issues, ensuring seamless communication between VPCs and maintaining the overall robustness of your AWS environment.
Benefits of the integration between Site24x7 and AWS Transit Gateway
Site24x7's AWS Transit Gateway integration enables you to:
- Monitor Transit Gateway and attachment performance.
- Receive instant alerts for potential disruptions or irregularities.
- Quickly identify and address Transit Gateway issues for improved reliability.
Setup and configuration
- If you have not done so already, enable access to your AWS resources by creating a cross-account IAM role between your AWS account and Site24x7's AWS account.
- On the Integrate AWS Account page, please make sure Transit Gateway is selected in the Services to be discovered field.
- Enable flow logs with Destination type as cloud-watch-logs in your AWS console, at the Transit Gateway or Transit Gateway Attachment level to monitor flow logs metrics in Transit Gateway and Transit Gateway Attachment monitor.
Permissions
Ensure that Site24x7 receives each of these permissions to monitor Transit Gateway and Transit Gateway Attachment:
- "ec2:DescribeTransitGatewayAttachments"
- "ec2:DescribeTransitGateways"
- "ec2:DescribeTransitGatewayPeeringAttachments"
- "ec2:DescribeTransitGatewayVpcAttachments"
- "ec2:DescribeAddresses"
Polling frequency
Site24x7 queries Amazon CloudWatch and other AWS service-level APIs to collect metrics from the Transit Gateway and Transit Gateway Attachment monitors. The poll frequency for the queries can be set from one minute to one day.
Supported metrics
The following metrics are available for both Transit Gateway and Transit Gateway Attachment monitors.
| Metric name | Description | Statistics | Unit |
|---|---|---|---|
| Bytes In | The number of bytes received by the transit gateway. | Sum | MB |
| Bytes Out | The number of bytes sent from the transit gateway. | Sum | MB |
| Packets In | The number of packets received by the transit gateway. | Sum | Count |
| Packets Out | The number of packets sent by the transit gateway. | Sum | Count |
| Packet Drop Count Black hole | The number of packets dropped because they matched a black hole route. | Sum | Count |
| Packet Drop Count No Route | The number of packets dropped because they did not match a route. | Sum | Count |
| Bytes Drop Count Black hole | The number of bytes dropped because they matched a black hole route. | Sum | Count |
| Bytes Drop Count No Route | The number of bytes dropped because they did not match a route. | Sum | Count |
The following metrics are available for Transit Gateway Flow Logs and Transit Gateway Attachment Flow Logs
| Metric name | Description | Statistics | Unit |
|---|---|---|---|
| In Traffic | Total incoming traffic throughput | Sum | bps |
| Out Traffic | Total outgoing traffic throughput | Sum | bps |
| Total Traffic | Total traffic throughput | Sum | bps |
| Average Rx Packet Size | Average incoming packet size | Average | Bytes |
| Average Tx Packet Size | Average outgoing packet size | Average | Bytes |
| Packet Loss MTU Exceeded | The number of packets dropped because the maximum transmission unit (MTU) exceeded the threshold value | Sum | Count |
| Packet Loss TTL Expired | The number of packets dropped because the TTL expired | Sum | Count |
| Packet Loss Rate | The percentage of packets dropped | Sum | Percentage |
| Skipped Records | Total skipped records | Sum | Count |
| No Data Records | Total no data records | Sum | Count |
Threshold configuration
To configure thresholds for your integrated monitor:
- Log in to your Site24x7 account and navigate to Admin > Configuration Profiles > Threshold and Availability.
- Click Add Threshold Profile.
- Select Transit Gateway / Transit Gateway Attachment / Transit Gateway Flow Logs / Transit Gateway Attachment Flow Logs from the Monitor Type drop-down menu and provide an appropriate name in the Display Name field.
The supported metrics are displayed in the Threshold Configuration section. You can set threshold values for all the metrics listed above. Toggle the Notify when route table is modified and Notify as Trouble when route table is disassociated options to Yes to receive notifications.
Licensing
- Each Transit Gateway monitor is considered a basic monitor.
- Each Transit Gateway Attachment monitor with flow log is considered a basic monitor.
- For the Transit Gateway Attachment monitor without flow log, five monitors will consume one basic monitor license.
Forecast
Estimate future values of the following performance metrics and make informed decisions about adding capacity or scaling your AWS infrastructure.
- Bytes In
- Bytes Out
- Packets In
- Packets Out
- Packet Drop Count Black Hole
- Packet Drop Count No Route
- Bytes Drop Count Black Hole
- Bytes Drop Count No Route
Viewing Transit Gateway monitor
To monitor your Transit Gateway, log in to your Site24x7 account and navigate to Cloud > AWS > Transit Gateway.
Monitor data
Transit Gateway
You can view the Transit Gateway monitor data in the below tabs:
Summary
Gain an overview of events occurring within each transit gateway with statuses like Down, Critical, Trouble, Maintenance, Anomaly, and Suspended from the Summary tab. Obtain the time series charts for Throughout in Bytes, Throughout in Packets, Bytes Drop Chart, and Packets Drop Chart. All the time series charts have the average, minimum, and maximum values listed. Additionally, you can also obtain a history outlined for whenever your monitor has a Down or Trouble status, with details like Start Time to End Time, Duration, and comments, if any.
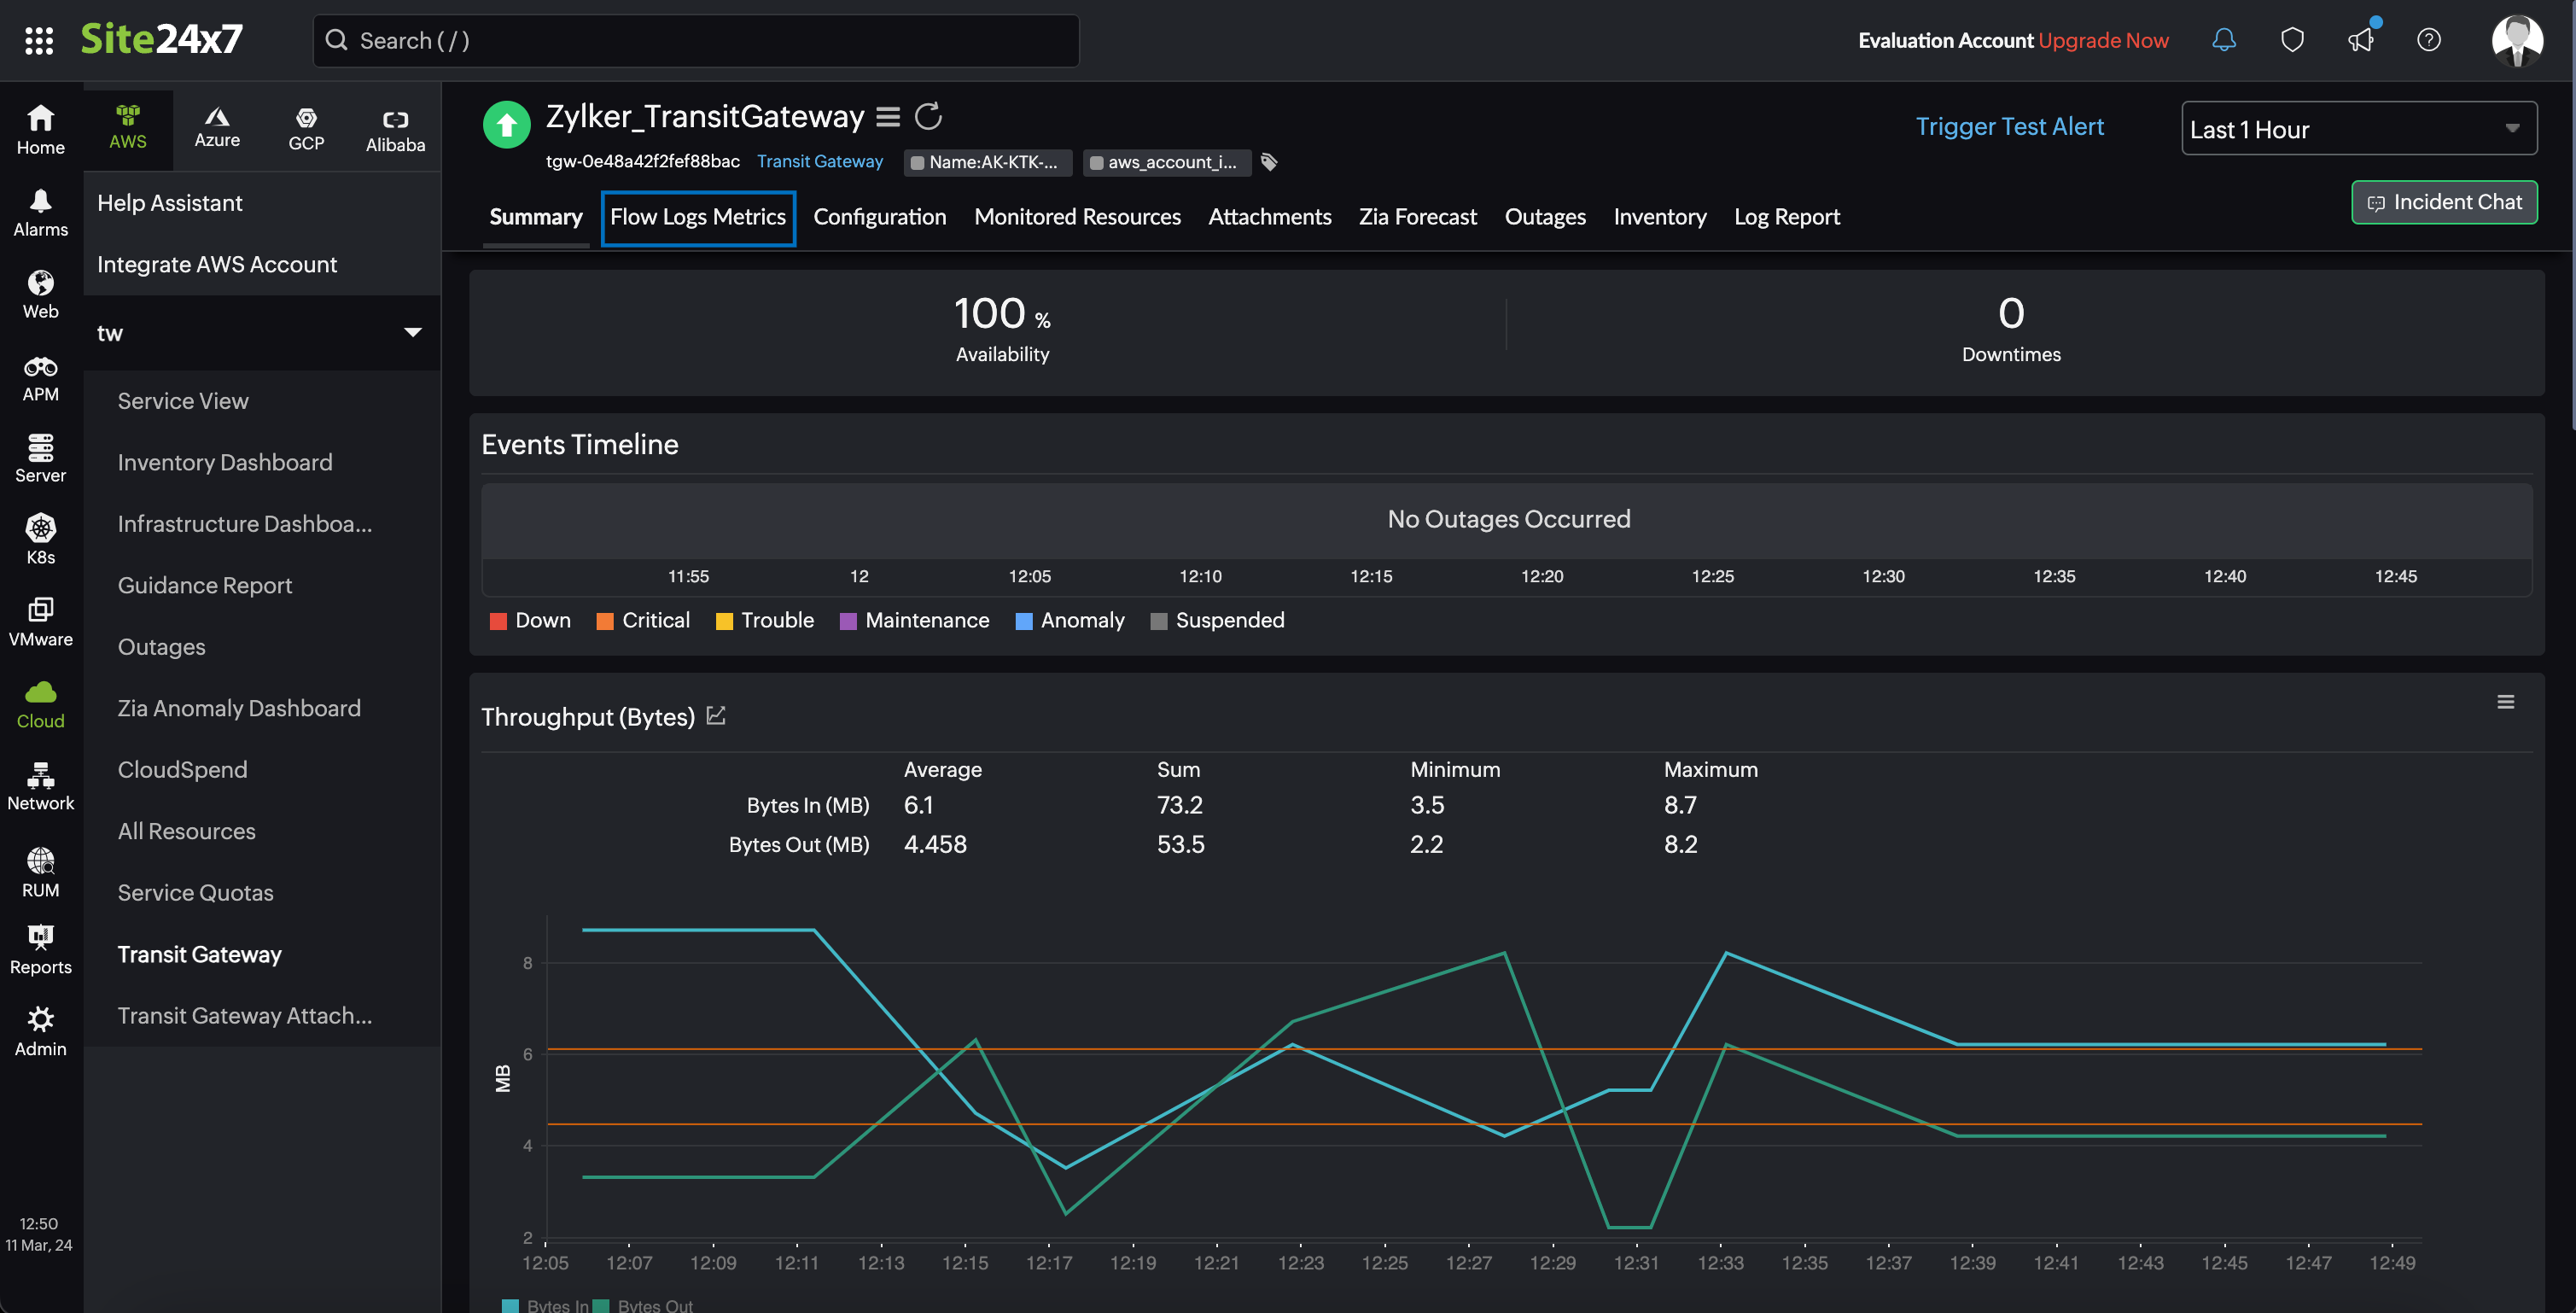
Flow Logs Metrics
Retrieve the time series charts for flow logs metrics such as In Traffic, Out Traffic, Total Traffic, Average Packet Size, and Packet Loss Chart from the Flow Logs Metrics tab. These charts display the average, minimum, and maximum values, providing comprehensive insights into your network performance.
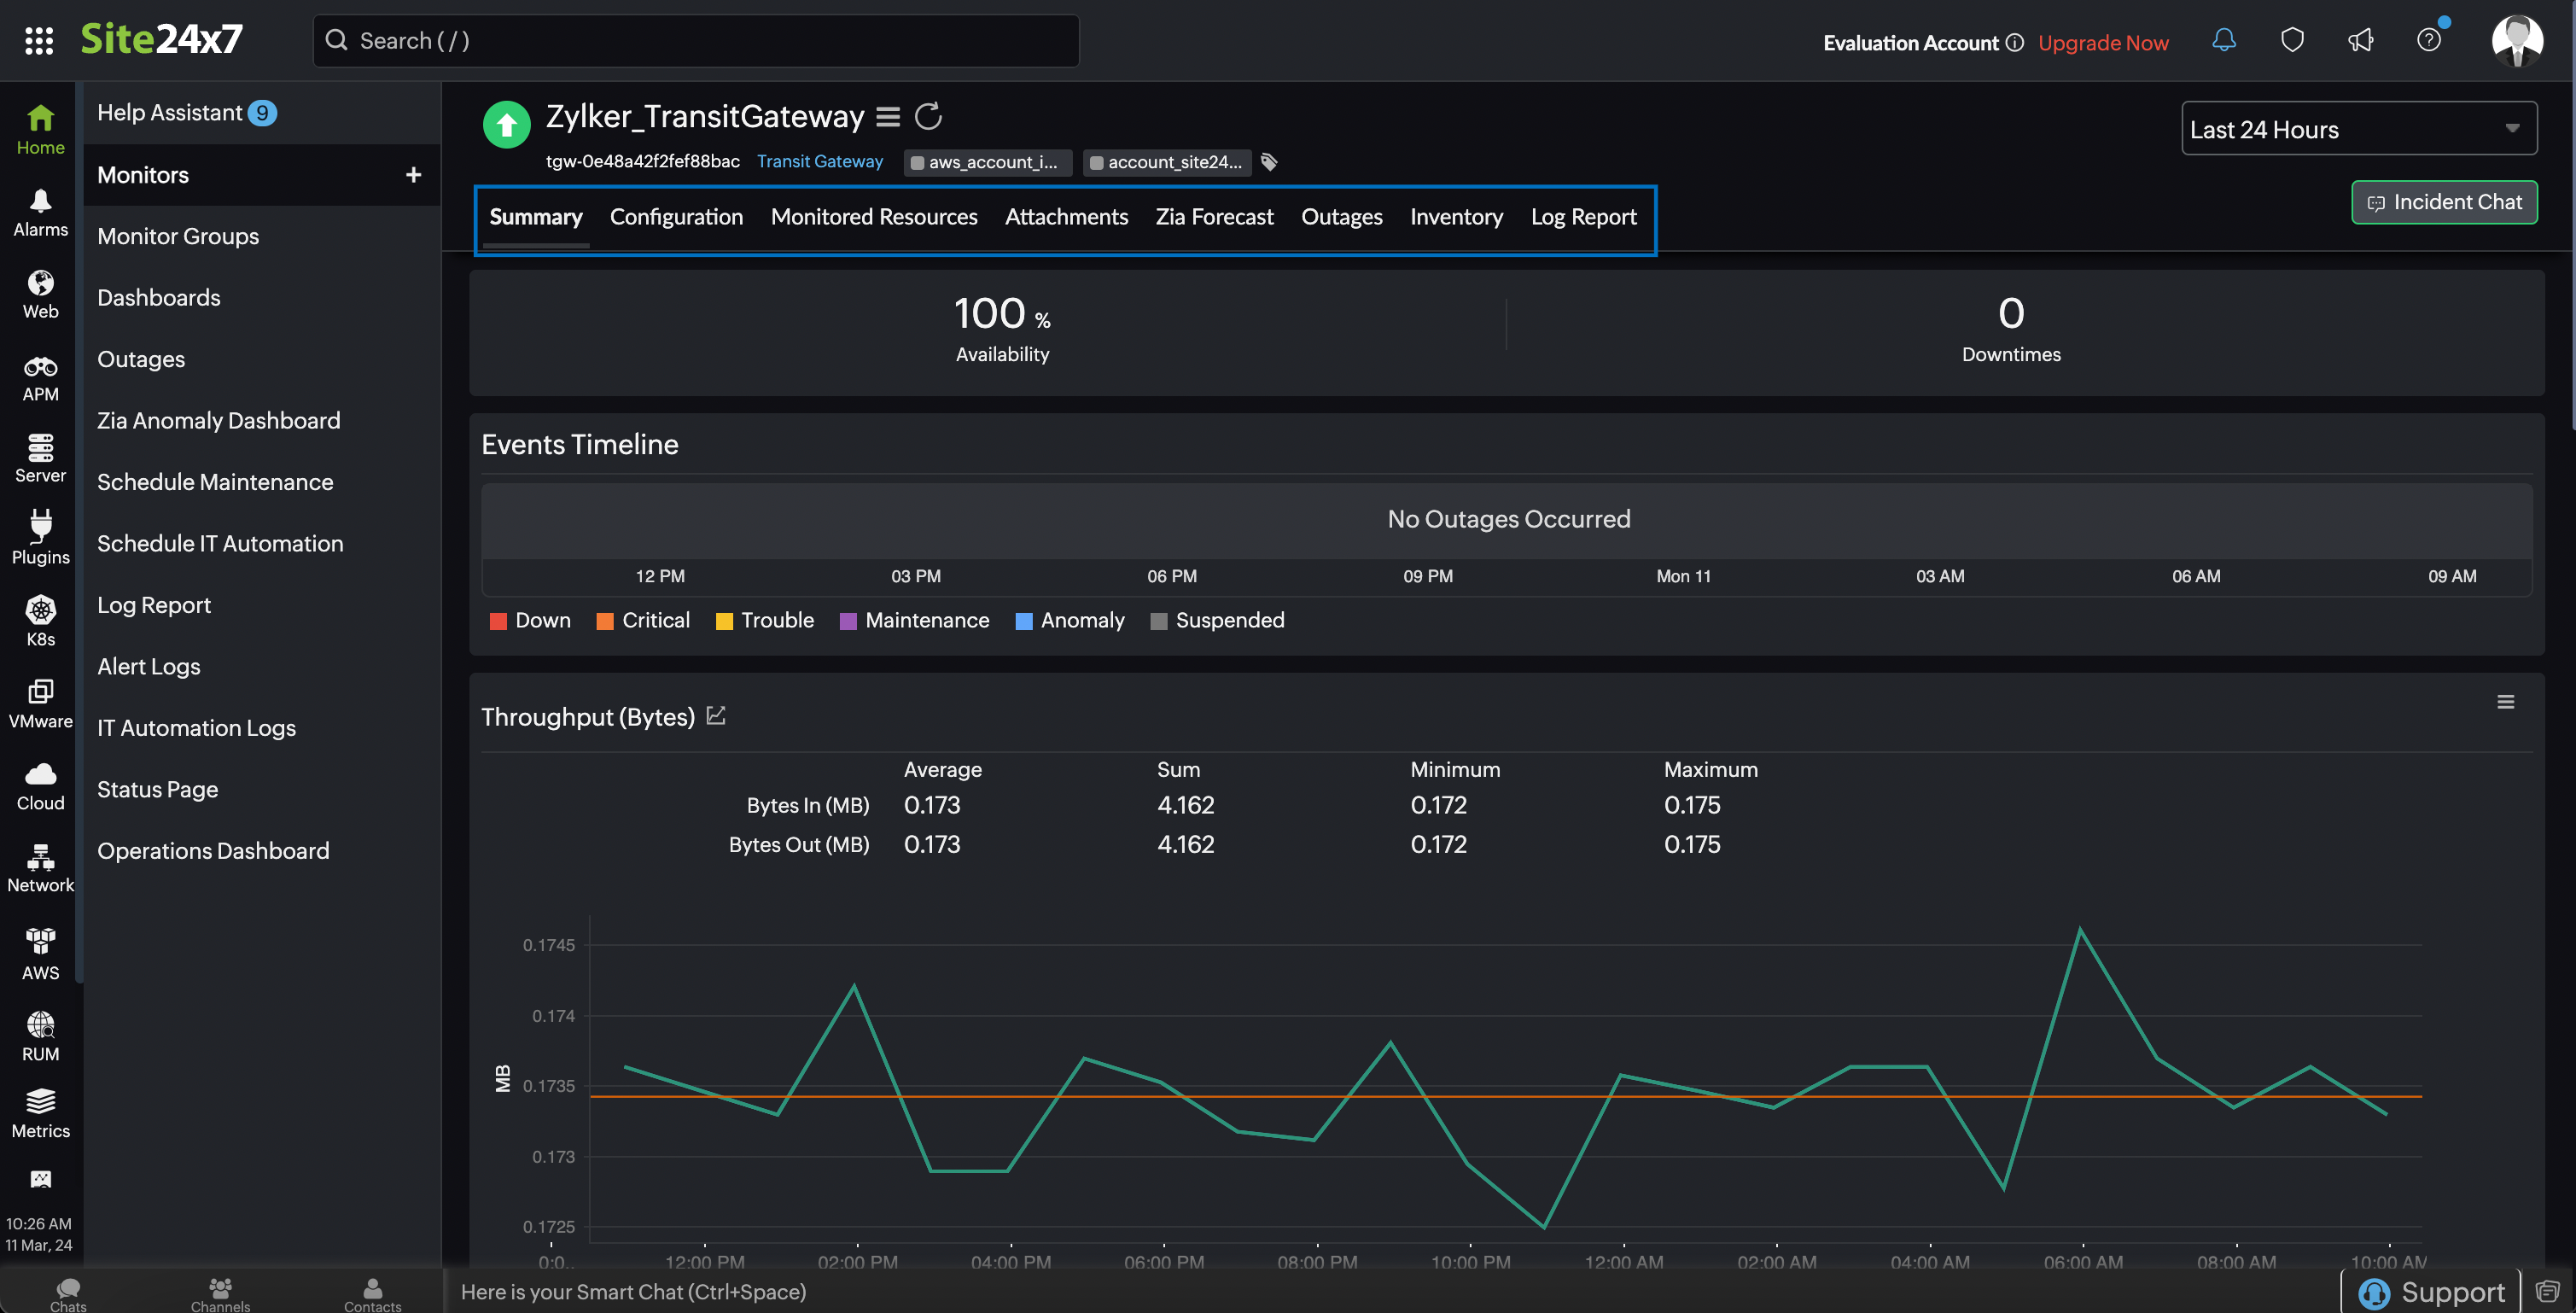
The Flow Logs Metrics tab will be displayed only if you enable flow logs with Destination type as cloud-watch-logs in your AWS console, at the Transit Gateway level.
The below image shows a scenario where the Flow Logs Metrics tab is not displayed because the Destination type as cloud-watch-logs is not enabled in your AWS console.
Configuration
The configuration details of a Transit Gateway are provided under this tab. Details on the Region, Transit Gateway ID, Association Route Table ID, Propagation Route Table ID, and many more are elaborated in this section.
Monitored resources
On the Monitored Resources tab, you can view a list of associated VPC-VPNs, Transit Gateway attachments, and resource names. Click on an individual listing to see performance and resource usage stats associated with that resource. You can also set thresholds and be notified when any of these services fail by clicking the pencil icon under Action.
Attachments
The Attachments tab provides information on the Name, Attachment ID, Resource ID, Availability State, and Type of the Transit Gateway in use.
Outages
The Outages tab displays the Down/Trouble History with the start time and end time of an outage, the duration, and comments (if any). To add an outage, click Add Outage and enter the Start Time, End Time, and Description. Click Save to retain the outage details and view the outage on the Outages tab. You also have the option to share the outage details in CSV, PDF, or email format. To share the outage data, click Share This.
Inventory
View the inventory details, such as the Transit Gateway ID, Region, Monitor Licensing Category, and Check Frequency, on the Inventory tab. You can also add and save a note for your monitor in the Note section of the Inventory tab.
Log report
Here, you can view the status, and polling activities carried out along with a time stamp, for each monitor. According to the metrics you monitor, you can obtain the metric data information for each polled instance as well.
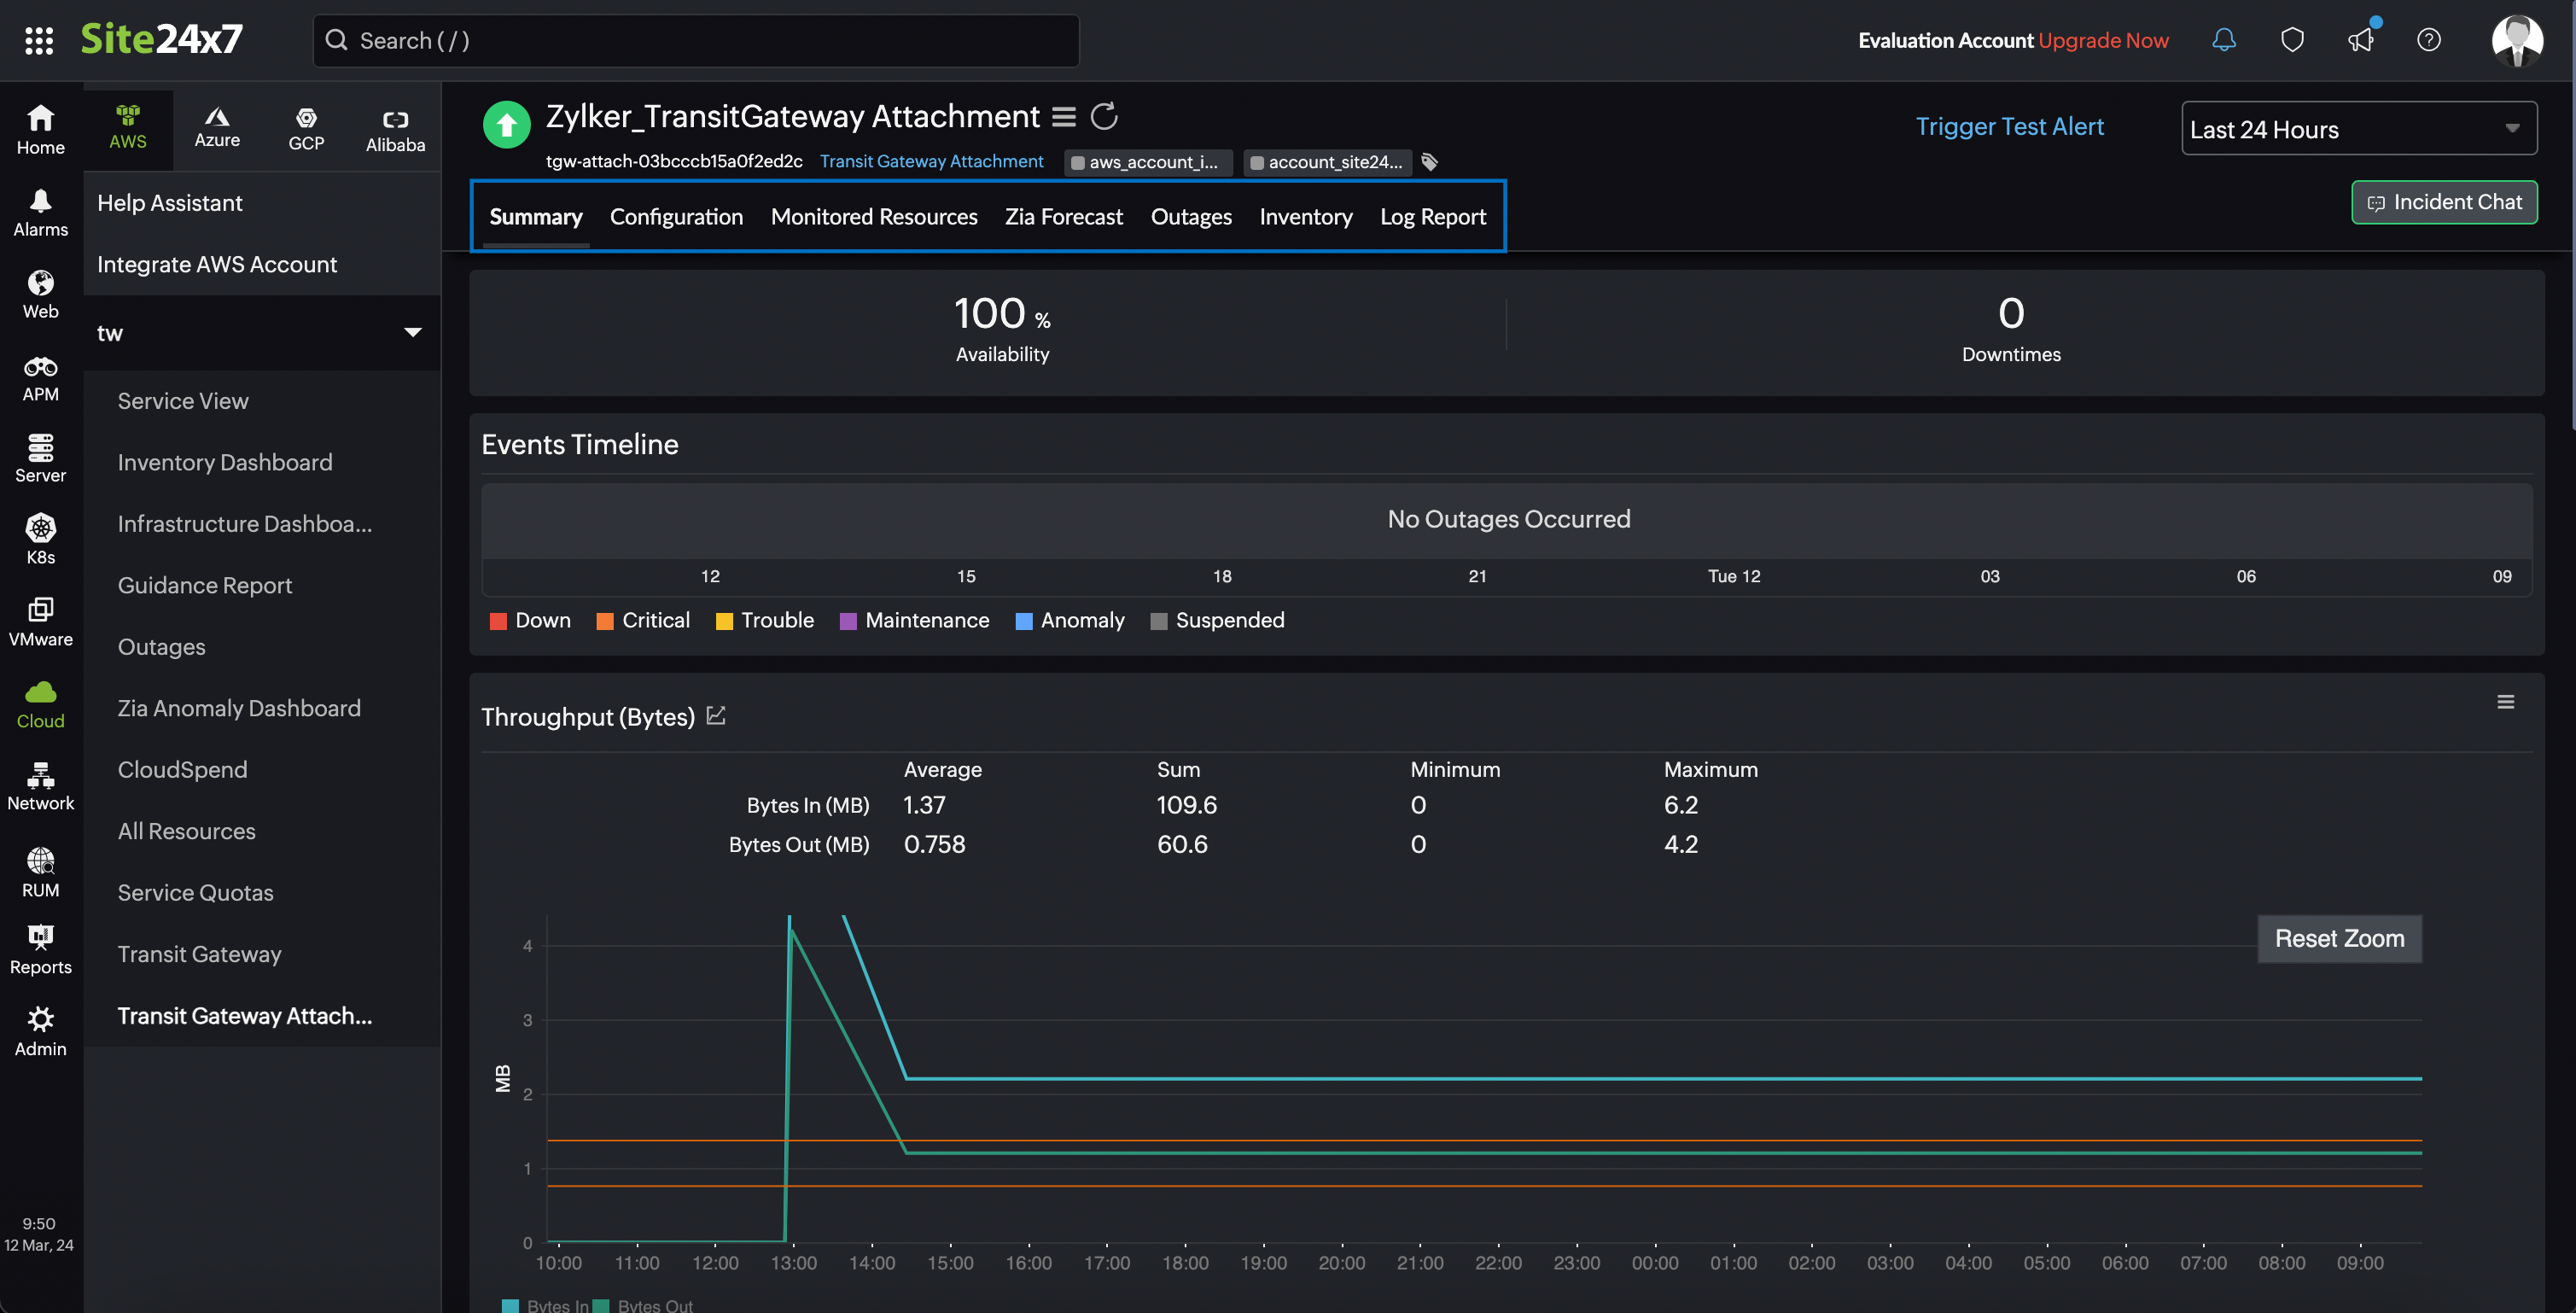
Transit Gateway Attachment
You can view the Transit Gateway Attachment monitor data in the below tabs:
Summary
Gain an overview of events occurring within each transit gateway attachment with statuses like Down, Critical, Trouble, Maintenance, Anomaly, and Suspended from the Summary tab. Obtain the time series charts for Throughput in Bytes, Throughput in Packets, Bytes Drop Chart, and Packets Drop Chart. All the time series charts have the average, minimum, and maximum values listed. Additionally, you can also obtain a history outlined for whenever your monitor has a Down or Trouble status, with details like Start Time to End Time, Duration, and comments, if any.
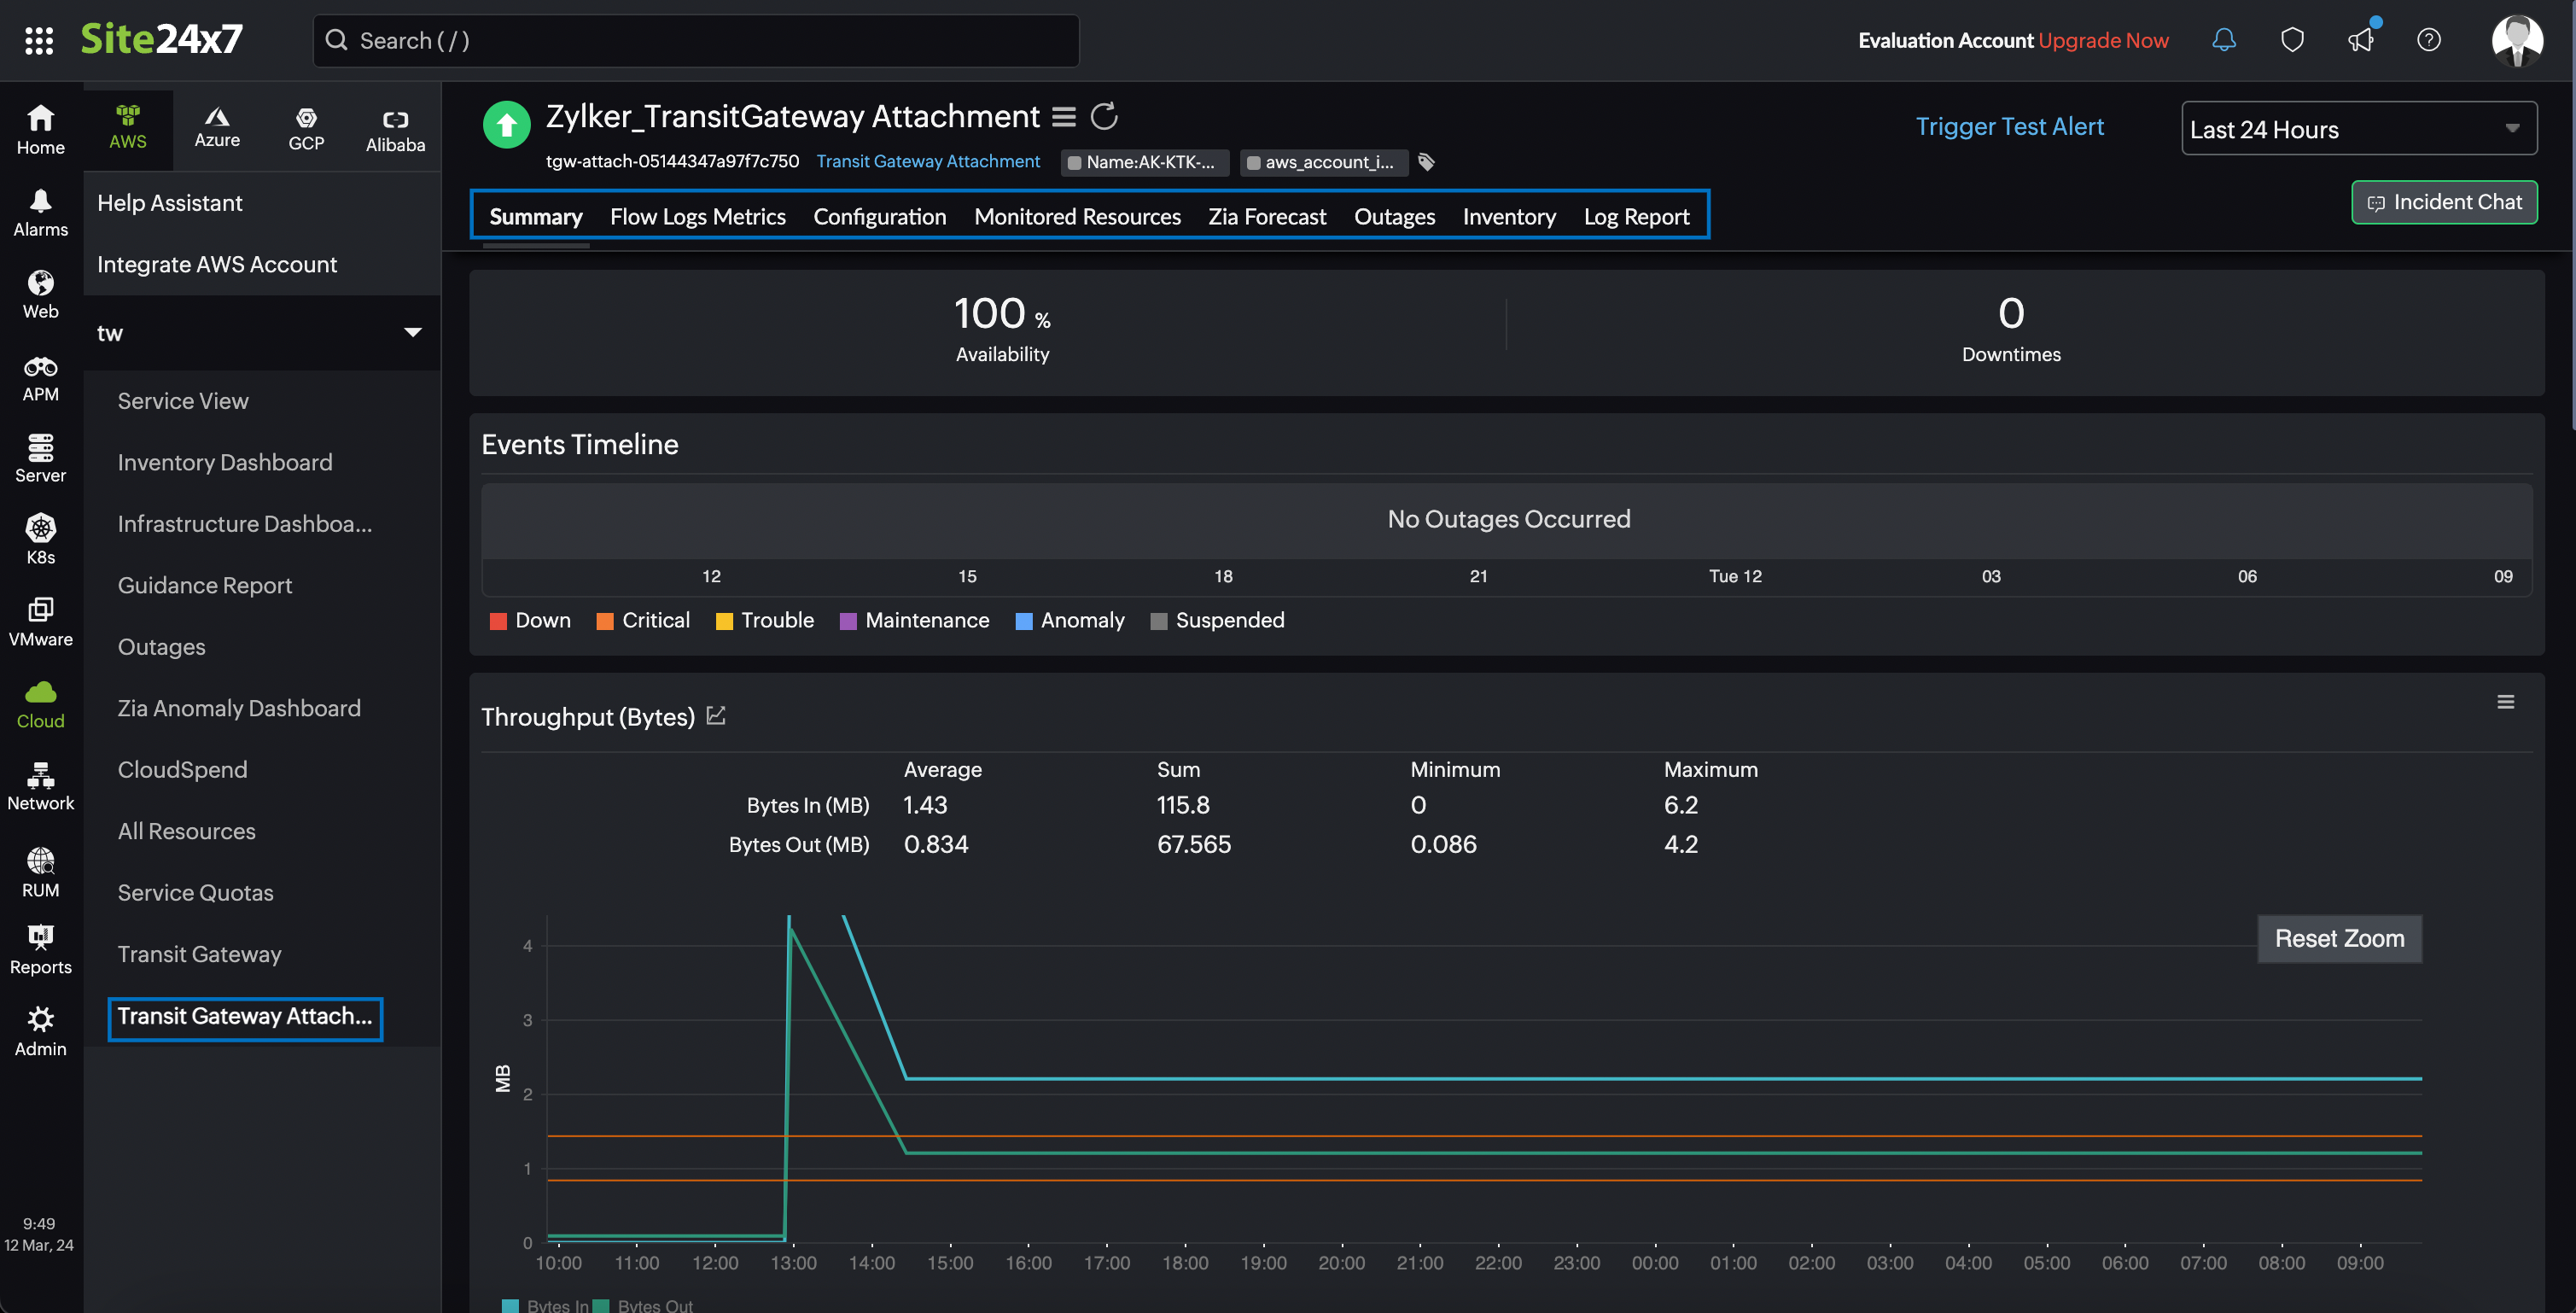
Flow Logs Metrics
Retrieve the time series charts for metrics such as In Traffic, Out Traffic, Total Traffic, Average Packet Size, and Packet Loss Chart from the Flow Logs Metrics tab. These charts display the average, minimum, and maximum values, providing comprehensive insights into your network performance.
The Flow Logs Metrics tab will be displayed only if you enable flow logs with Destination type as cloud-watch-logs in your AWS console, at the Transit Gateway Attachment level.
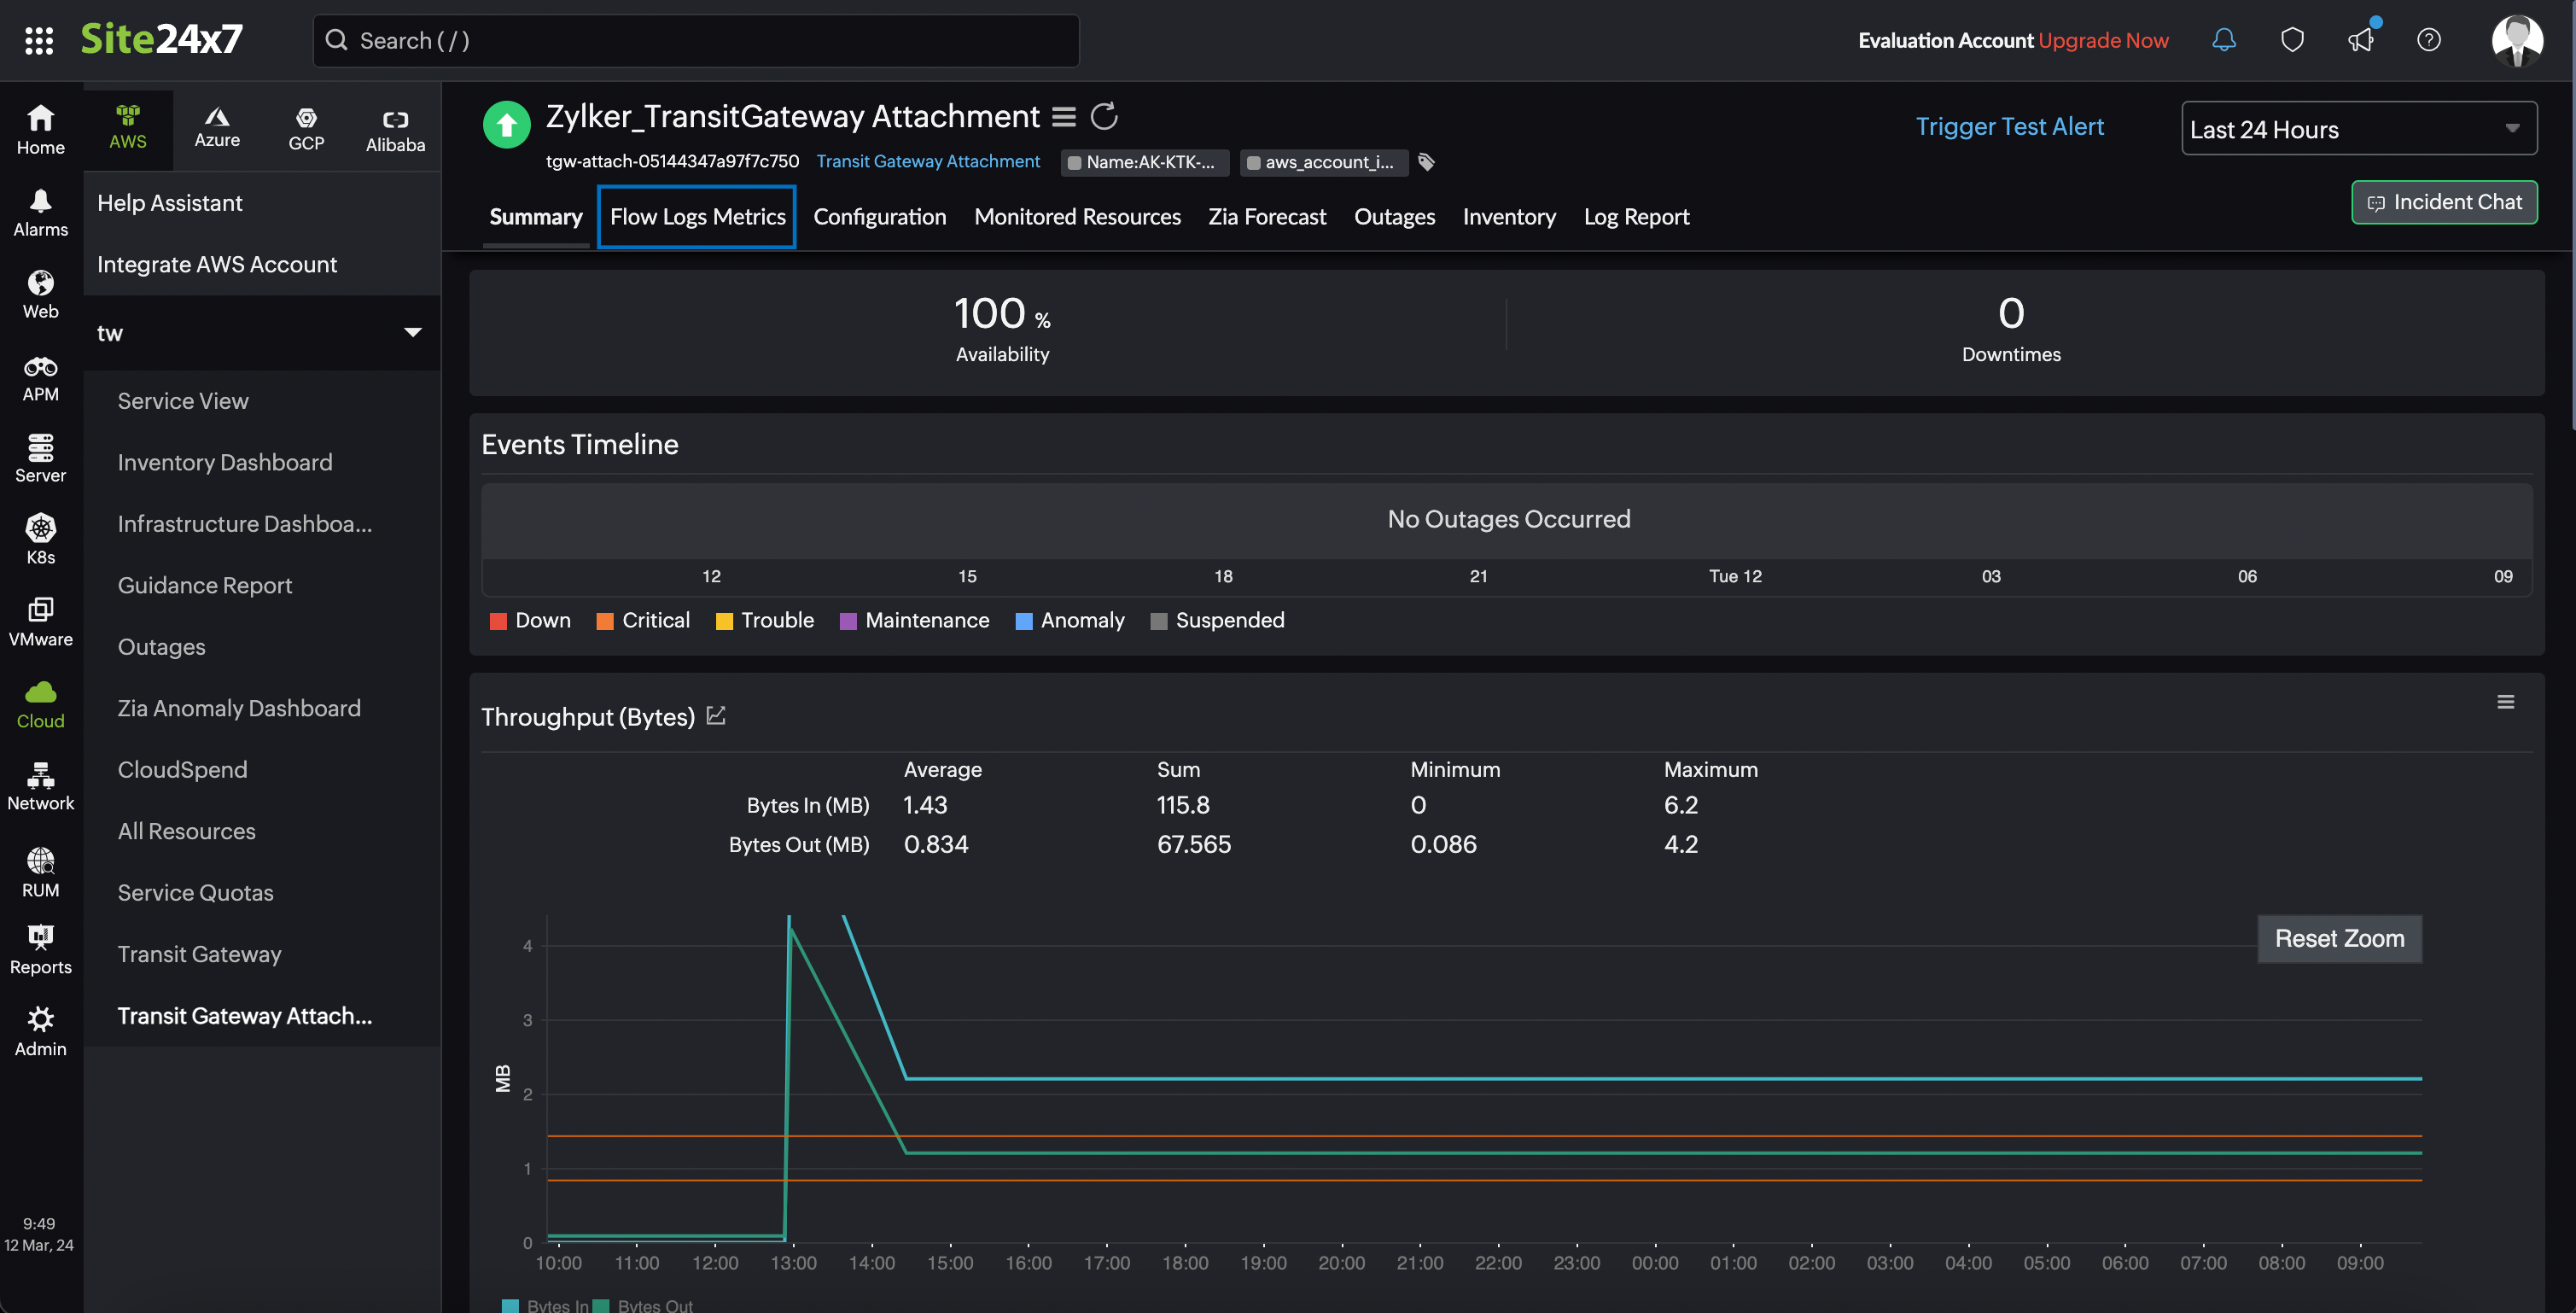
The below image shows a scenario where the Flow Logs Metrics tab is not displayed because the Destination type as cloud-watch-logs is not enabled in your AWS console.
Configuration
The configuration details of a Transit Gateway are provided in the Configuration tab. You can also view configuration details such as Region, Attachment ID, Association State, and Transit Gateway Attachment State from this tab.
Monitored resources
On the Monitored Resources tab, you can view a list of associated Network Interfaces, Subnets, VPCs and resource names. Click on an individual listing to see performance and resource usage stats associated with that resource. You can also set thresholds and be notified when any of these services fail by clicking the pencil icon under Action.
Outages
The Outages tab displays the Down/Trouble History with the start time and end time of an outage, the duration, and comments (if any). To add an outage, click Add Outage and enter the Start Time, End Time, and Description. Click Save to retain the outage details and view the outage on the Outages tab. You also have the option to share the outage details in CSV, PDF, or email format. To share the outage data, click Share This.
Inventory
View the inventory details, such as the Attachment ID, Region, Monitor Licensing Category, and Check Frequency, on the Inventory tab. You can also add and save a note for your monitor in the Note section of the Inventory tab.
Log Report
Here, you can view the status and polling activities carried out along with a time stamp, for each monitor. According to the metrics you monitor, you can obtain the metric data information for each polled instance as well.