Amazon RDS Proxy monitoring integration
Amazon RDS Proxy is a fully managed, highly available database proxy for Amazon Relational Database Service (RDS) that makes applications more scalable, secure, and resilient to database failures.
Site24x7 - RDS Proxy integration provides real-time monitoring of your Amazon RDS Proxy metrics and helps you manage your database connections.
In addition to the RDS Proxy monitor, Site24x7's integration with AWS RDS Proxy provides the following three monitors:
- Endpoints: Monitor all the RDS proxy endpoints, including the default endpoint, and gain insights about supported CloudWatch metrics.
- Targets: The RDS Proxy Target monitors the RDS database instances or Aurora DB cluster that the proxy can connect to.
- Targetrole: Monitor the metrics of each proxy and configure thresholds based on the read/write and read-only traffic to each database.
Use case
Consider that you have an Amazon RDS Proxy monitor integrated with Site24x7, which has multiple RDS proxies associated with an RDS instance. With this integration, you can analyze the performance of your Amazon RDS Proxy, including the number of endpoints and manage your charges for additional endpoints other than the default endpoint.
The integration also helps you to monitor the CloudWatch metrics and sends alerts when threshold breaches occur for your integrated monitor.
Benefits of the integration between Site24x7 and Amazon RDS Proxy
By integrating Site24x7 with Amazon RDS Proxy you can:
- Track RDS Proxy and monitor your resources with greater detail and depth.
- Monitor the endpoints, targets, and targetroles under the same RDS Proxy monitor individually.
- Obtain a bird's-eye view of the CloudWatch metrics for each endpoint, target, and targetrole.
- Get threshold breach alerts when the Amazon RDS Proxy monitor exceed the configured limit.
- Manage your database connections, as well as client connections, by tracking the connections requested and connections established.
- Manage your charges for additional endpoints.
Setup and configuration
- Log in to your Site24x7 account and create Site24x7 as an IAM user, or create a cross-account IAM role to enable access to your AWS resources for Site24x7.
- On the Integrate AWS Account page, check the box next to RDS Proxy in the Services to be discovered field.
Permissions
- rds:DescribeDBProxies
- rds:DescribeDBProxyEndpoints
- rds:DescribeDBProxyTargetGroups
- rds:DescribeDBProxyTargets
Polling frequency
Site24x7 queries AWS service-level APIs per the set polling frequency (from once a minute to once a day) to collect metrics from Amazon RDS Proxy monitor.
Supported metrics for RDS Proxy
| Metric name | Description | Statistics | Unit |
|---|---|---|---|
| Number of endpoints | The total number of endpoints in the RDS proxy. | Sum | Count |
| Client Connections | The current number of client connections, client connections closed, and the client connection requests received. | Sum | Count |
| Database Connections | The current number of database connections, the current number of database connections with Transport Layer Security (TLS), and the maximum number of database connections allowed. | Sum | Count |
| Client Connections Based on TLS | The current number of client connections with TLS and the current number of client connections without TLS. | Sum | Count |
| Client Connections Based on Authentication | The number of client connection attempts that failed due to misconfigured authentication or TLS, and the number of client connections successfully established using any authentication mechanism with or without TLS. | Sum | Count |
| Database Connection Requests | The number of requests to create a database connection and the number of requests to create a database connection with TLS. | Sum | Count |
| Database Connections Borrow Latency | The time that it takes for the proxy being monitored to get a database connection. | Average | Microseconds |
| Database Connections (based on current state) | The current number of database connections in the borrow state, the current number of database connections in a transaction, and the current number of database connections currently pinned because of operations in client requests that change the session state. | Sum | Count |
| Database Connections (based on authentication) | The number of database connection requests that failed and the number of database connections successfully established with or without TLS. | Sum | Count |
| Query Requests | The number of queries received, the number of queries received from non-TLS connections, and the number of queries received from TLS connections. | Sum | Count |
| Query Response Latency | The time, in microseconds, between getting a query request and the proxy responding to it. | Average | Microseconds |
Supported metrics for RDS Proxy Endpoint
| Metric name | Description | Statistics | Unit |
|---|---|---|---|
| Client Connections | The current number of client connections, the number of client connections closed, and the number of client connection requests received. | Sum | Count |
| Client Connections (based on TLS) | The current number of client connections with TLS and the current number of client connections without TLS. | Sum | Count |
| Client Connections (based on authentication) | The number of client connection attempts that failed due to misconfigured authentication or TLS and the number of client connections successfully established with any authentication mechanism with or without TLS. | Sum | Count |
| Database Connections Borrow Latency | The time in microseconds that it takes for the proxy being monitored to get a database connection. | Average | Microseconds |
| Query Requests | The number of queries received, the number of queries received from non-TLS connections, and the number of queries received from TLS connections. | Sum | Count |
| Query Response Latency | The time between getting a query request and the proxy responding to it. | Average | Microseconds |
Supported metrics for RDS Proxy Target
| Metric name | Description | Statistics | Unit |
|---|---|---|---|
| Database Connections | The current number of database connections, the current number of database connections with TLS, and the maximum number of database connections allowed. | Sum | Count |
| Database Connection Requests | The number of requests to create a database connection and the number of requests to create a database connection with TLS. | Sum | Count |
| Database Connections (based on current state) | The current number of database connections in the borrow state, the current number of database connections in a transaction, and the current number of database connections currently pinned because of operations in client requests that change the session state. | Sum | Count |
| Database Connections (based on authentication) | The number of database connection requests that failed and the number of database connections successfully established with or without TLS. | Sum | Count |
| Query Response Latency | The time getting a query request and the proxy responding to it. | Average | Microseconds |
Supported metrics for RDS Proxy Targetrole
| Metric name | Description | Statistics | Unit |
|---|---|---|---|
| Availability Percentage | The percentage of time that the target group was available in the role indicated by the dimension. | Average | Percentage |
| Database Connections | The current number of database connections, the current number of database connections with TLS, and the maximum number of database connections allowed. | Sum | Count |
| Database Connection Requests | The number of requests to create a database connection and the number of requests to create a database connection with TLS. | Sum | Count |
| Database Connections (based on current state) | The current number of database connections in the borrow state, the current number of database connections in a transaction, and the current number of database connections currently pinned because of operations in client requests that change the session state. | Sum | Count |
| Database Connections (based on authentication) | The number of database connection requests that failed and the number of database connections successfully established with or without TLS. | Sum | Count |
| Query Response Latency | The time between getting a query request and the proxy responding to it. | Average | Microseconds |
Threshold configuration
To configure thresholds for RDS Proxy monitor:
- Log in to your Site24x7 account and navigate to Admin > Configuration Profiles > Threshold and Availability.
- Click Add Threshold Profile.
- Select RDS Proxy from the Monitor Type drop-down menu and provide an appropriate name in the Display Name field.
- The supported metrics are displayed in the Threshold Configuration section. You can set threshold values for all the metrics mentioned above.
- Click Save.
To configure thresholds for RDS Proxy Endpoint/Target/Targetrole monitor:
- Log in to your Site24x7 account and navigate to Admin > Configuration Profiles > Threshold and Availability.
- Click Add Threshold Profile.
- Select RDS Proxy Endpoint or RDS Proxy Target or RDS Proxy Targetrole based on your requirement from the Monitor Type drop-down menu and provide an appropriate name in the Display Name field.
- The supported metrics are displayed in the Threshold Configuration section. You can set threshold values for all the metrics mentioned above.
- Click Save.
You can manage all the alerts to ensure that the notifications are sent through the parent monitor with the status propagation feature.
Topology View
The Topology View delivers a live, resource-centric dependency map. It dynamically traces how your RDS Proxy resource is connected to its surrounding AWS infrastructure in real time, enabling faster root cause isolation when alerts fire. If any connected component is in a Critical state, it is marked accordingly within the topology view, along with the outage reason, so you can pinpoint the exact failure point without needing to navigate away from the monitor page. Unlike account-wide topology views, this tab scopes visualization to a single resource, answering the precise question: What does this resource connect to, and what breaks if it does?
The topology also extends to associated child monitors, including RDS Proxy Endpoints, RDS Proxy Target, and RDS Proxy Target Role, allowing you to view dependencies across all related components in one place. You can trace the full dependency chain from the individual resource up through its primary parent entities to the Service type, Region, and AWS account levels.
Licensing
- Each RDS Proxy monitor is considered a basic monitor.
- For the Amazon RDS Proxy Endpoints monitor, five monitors utilize one basic monitor license.
- Each RDS Proxy Target monitor is considered a basic monitor.
- For the Amazon RDS Proxy Targetrole monitor, two monitors utilize one basic monitor license.
Viewing Amazon RDS Proxy data
To monitor your Amazon RDS Proxy, log in to your Site24x7 account and navigate to Cloud > AWS > RDS Proxy.
Amazon RDS Proxy data
You can view your Amazon RDS Proxy data on the following tabs.
Summary
The Summary tab provides an overview of the events timeline and metrics in the form of charts.
Endpoint(s)
The Endpoint(s) tab displays the Endpoints Status along with the list of Endpoint Monitors. Click the edit icon under Actions to configure thresholds for your preferred Endpoint Monitor. Click the applicable monitor from the Endpoint Monitor list to view the monitor details.
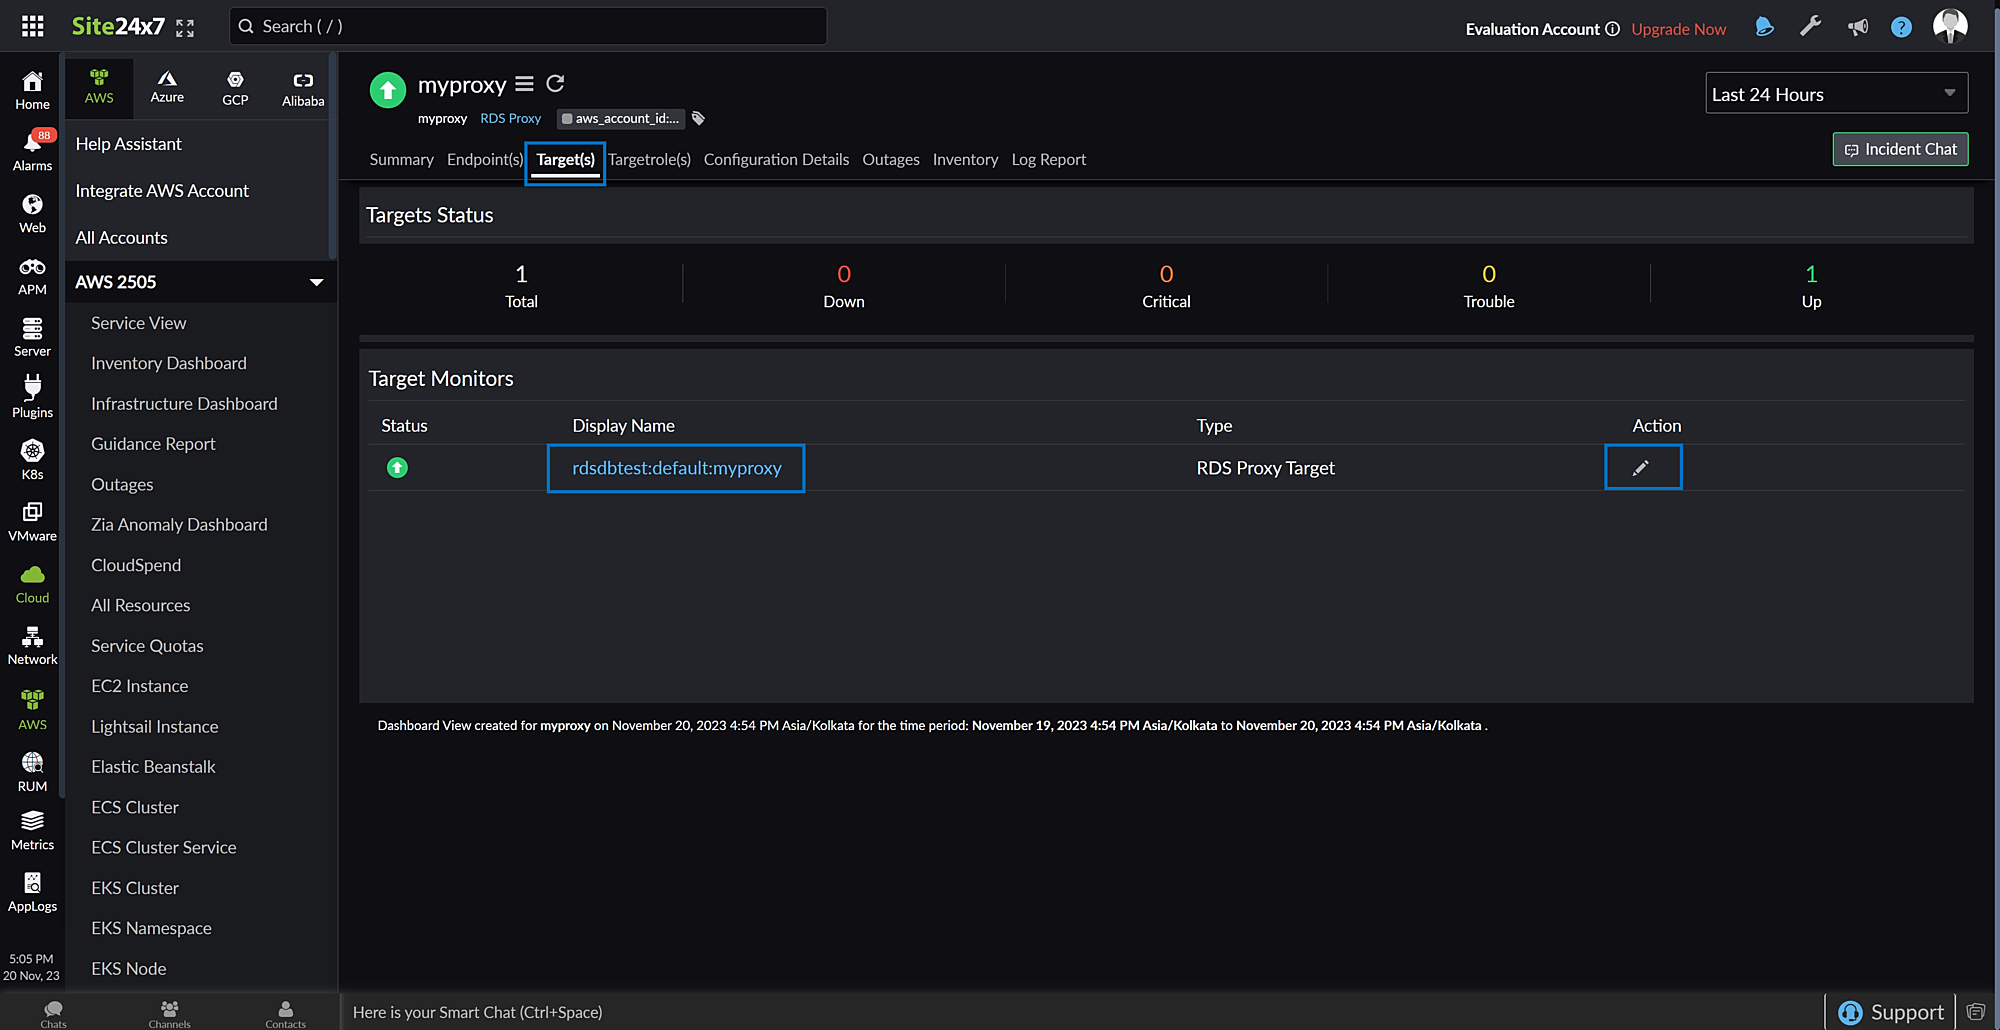
Target(s)
You can view the Targets Status along with the list of Target Monitors in the Target(s) tab. Click the edit icon under Actions to configure thresholds for your preferred Target Monitor. Click the applicable monitor from the Target Monitor list to view the monitor details.
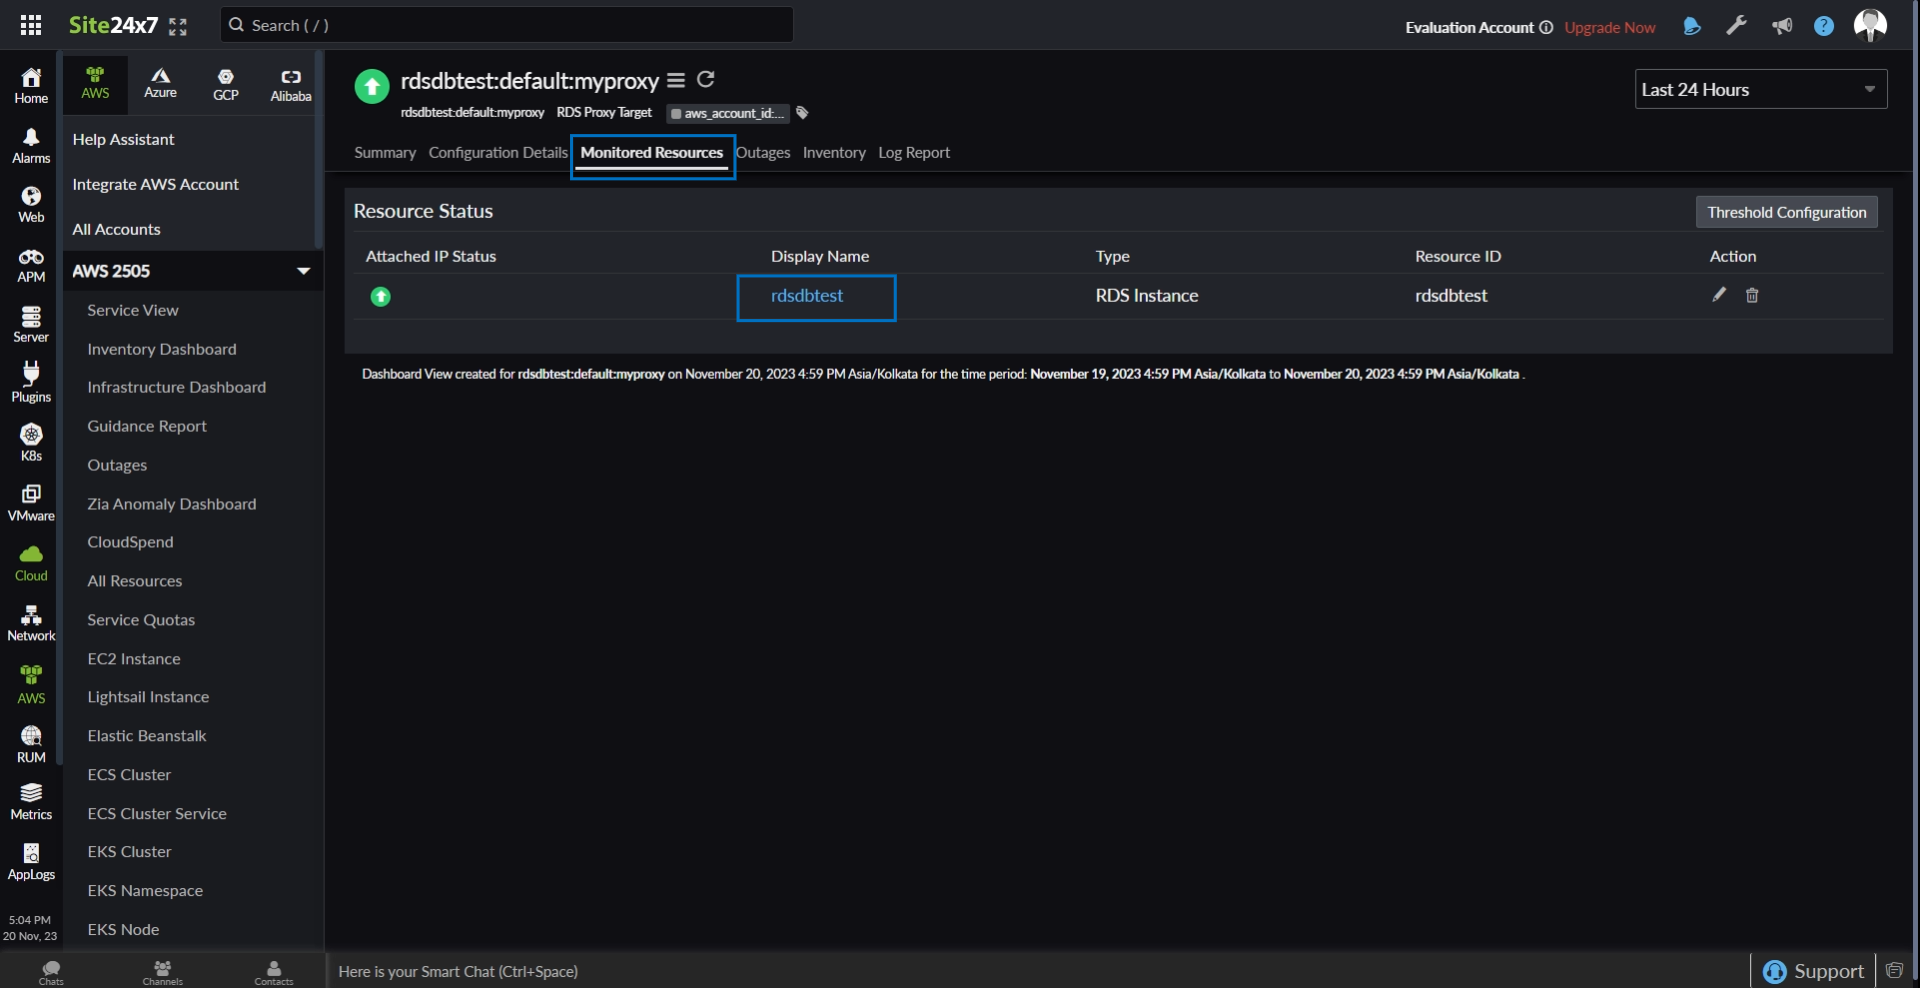
The Monitored Resources tab in the Target monitor provides the monitored resource details of the RDS instance represented by the Target monitor. Click the monitor display name to view the RDS monitor details.
Targetrole(s)
The Targetrole(s) tab shows the Targetroles Status and Targetrole monitors. Click the edit icon under Actions to configure thresholds for your preferred Targetrole Monitor. Click the applicable monitor from the Targetrole Monitor list to view the monitor details.
Topology View
The Topology tab provides a real time, resource level view of how your RDS Proxy is connected to other AWS components, helping you quickly understand dependencies and impact.
Configuration Details
View the configuration details of your RDS Proxy monitor such as Region, Proxy Name, Status, and Endpoint.
Outages
The Outages tab provides details on an outage's start time, end time, duration, and comments (if any).
Inventory
Obtain details like Resource Name, Region, Monitor Licensing Category, and much more from the Inventory tab. The Threshold and Availability Profile and the Notification Profile can be set according to the user and viewed in this tab.
Log Report
This tab offers a consolidated report of the RDS Proxy monitor's log status, which can be downloaded as a CSV file.
-
On this page
- Use case
- Benefits of the integration between Site24x7 and Amazon RDS Proxy
- Setup and configuration
- Permissions
- Polling frequency
- Supported metrics for RDS Proxy
- Supported metrics for RDS Proxy Endpoint
- Supported metrics for RDS Proxy Target
- Supported metrics for RDS Proxy Targetrole
- Threshold configuration
- Topology View
- Licensing
- Viewing Amazon RDS Proxy data
- Amazon RDS Proxy data