Amazon GuardDuty integration
Amazon Web Services (AWS) GuardDuty is a threat detection service that constantly monitors the activity in your AWS network for anomalous behavior, which could indicate cyberattacks or other unauthorized activities. It does this by analyzing and processing data from sources like VPC Flow Logs, AWS CloudTrail Event Logs, and DNS Logs.
With Site24x7's integration with Amazon GuardDuty, your AWS security front is further improved by integrating with the rest of your security and incident response tools to aggregate data.
Setup and configuration
- If you haven't already, enable access to your AWS resources between your AWS account and Site24x7's AWS account by either:
- Creating Site24x7 as an IAM user
- Creating a cross-account IAM role. Learn more.
- On the Integrate AWS Account page, select GuardDuty from the Services to be discovered field. Learn more.
Policy and permissions
Site24x7 uses various AWS GuardDuty APIs to collect information. Assign the AWS managed policy ReadOnlyAccess to the Site24x7 entity (IAM user or IAM role) to help Site24x7 collect metrics and metadata. If you want to assign a custom policy, please make sure the following read-level actions are present in the policy JSON. Learn more.
- "guardduty:ListDetectors"
- "guardduty:ListFindings"
- "guardduty:GetFindings"
Polling frequency
Site24x7 collects the metric data for the GuardDuty according to the poll frequency. The poll interval by default is one hour. Learn more.
Supported metrics
| Metric Name | Description | Statistics | Unit |
|---|---|---|---|
| Finding Count Per Day | Number of findings detected per day | Maximum | Count |
| High Severity Findings | Number of high severity findings detected | Maximum | Count |
| Medium Severity Findings | Number of medium severity findings detected | Maximum | Count |
| Low Severity Findings | Number of low severity findings detected | Maximum | Count |
| Findings Count By Resource Type | Number of findings detected for a resource type | Maximum | Count |
| Findings Count By Region | Number of findings detected for a region | Maximum | Count |
| Findings Count By Action | Number of findings detected for an action type | Maximum | Count |
Threshold configuration
To configure thresholds for your GuardDuty monitor:
- Log in to your Site24x7 account and navigate to Admin > Configuration Profiles > Threshold and Availability.
- Click Add Threshold Profile.
- Select GuardDuty from the Monitor Type drop-down menu.
- Provide an appropriate name in the Display Name field.
The supported metrics are displayed in the Threshold Configuration section. You can set threshold values for all the metrics listed above.
Mute alert for all archived findings
By default, down alert will be sent and the monitor will be suspended if all findings of a particular GuardDuty monitor are archived in AWS console. If you require to mute alerts in such cases, then navigate to the attached threshold profile and toggle the Mute alert for all archived findings option to Yes.
Licensing
Each GuardDuty Finding Type monitor is considered a basic monitor. Learn more.
Site24x7's AWS GuardDuty monitoring interface
When you navigate to the GuardDuty monitoring interface, you'll find various details based on categories like Behavior, Persistence, Policy, Recon, Stealth, Unauthorized Access, Trojan, and other categories supported in the AWS console.
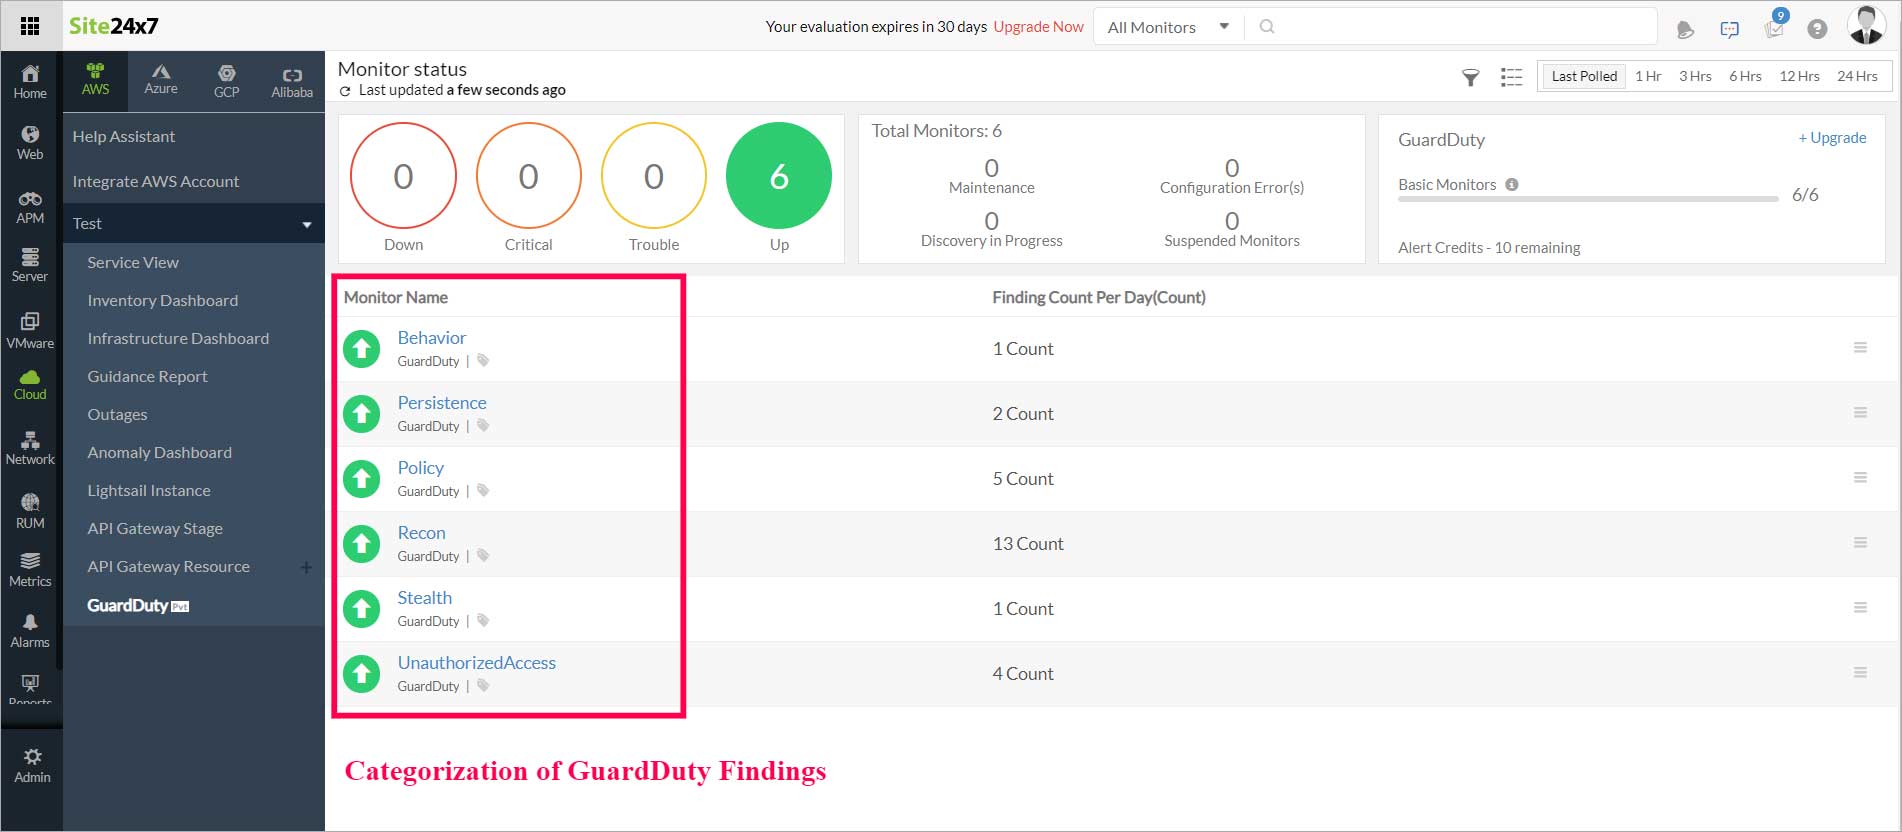
Each GuardDuty Finding Type is considered a Monitor Name in the Site24x7 console, and provides information on Finding Count Per Day. On clicking each Monitor Name, the following tabs appear:
GuardDuty Summary
Receive an overview of the Events Timeline, Top Findings, and a bar chart of the Finding Count Per Day. The Events Timeline provides a timeline of different events that have occurred for a monitor like Down, Critical, Trouble, Maintenance, Anomaly, and Suspended. The Top Findings section provides information on the Finding ARN, Resource Type, Severity, Region, and Number of Occurrences that have been detected by GuardDuty.
Regions
Information on Region Details, Findings Count (current and archived) By Region, and Regions Count Per Day is displayed here. The Region Details section includes information on Regions, Finding Type, Current Findings, Archived Findings, and Action. The Regions section helps in obtaining a region-wise overview of a particular category, i.e. Trojan, and analyzing which regions this threat has been detected in.
Resource Types
Information on Resource Type Details, Findings Count By Type, and Resource Count Per Day is displayed here. The Resource Type Details section includes information on Resource Name, Finding Type, Finding Count (current and archived), and Action. A pie chart of Findings Count by Type is provided to help with a resource-wise overview of each resource type and its associated count.
Action Types
Details on why a particular Finding Type (current and archived) has occurred will be displayed in Action Type, along with the Finding Count, in the Action Details section. Under the Actions column, the edit option lets you take any actions or add automation based on the Action Type, e.g., notifying you when the network connection is the reason for a particular finding to occur more than ten times.
Threshold Configuration lets you add or edit bulk thresholds for various child monitors that you have chosen, according to the Finding Count configuration you set. The threshold setting is available only for current findings.
Outages
A list of statuses like Down, Trouble, Critical, as well as the maintenance history of a monitor are displayed in the Outages tab. Details on start time to end time of an outage, duration, and comments (if any) are also provided in this section.
If all findings in a particular GuardDuty monitor are archived in the AWS console, they will be suspended in Site24x7. Once they are moved back as current findings in the AWS console, the monitor(s) will be Up again in Site24x7. This is to avoid unnecessary license usage in Site24x7.

Inventory
The configuration details of the threshold for each GuardDuty monitor are set here. The various threshold parameters that can be set include High Severity Findings, Medium Severity Findings, Findings Count By Resource Type, Findings Count Per Day, and more. The polling frequency and the Notification Profile can be set according to the user and viewed here.
Log Report
A consolidated report of the log status of various GuardDuty findings, can be downloaded from this tab in CSV format.