Uptime Monitoring for AWS Resources
Site24x7 offers uptime monitoring for its AWS monitors, providing the availability status and configuration for each monitor. The main advantage of enabling uptime monitoring is that it helps you avoid consuming CloudWatch API calls to fetch metrics, thereby cutting down your CloudWatch costs. Since the CloudWatch metrics are not fetched, the time series charts will not be available for each monitor.
Few pointers to keep in mind:
- Uptime monitoring can not be enabled for Amazon KMS and Amazon Certificate Manager, since they inherently do not consume CloudWatch API's.
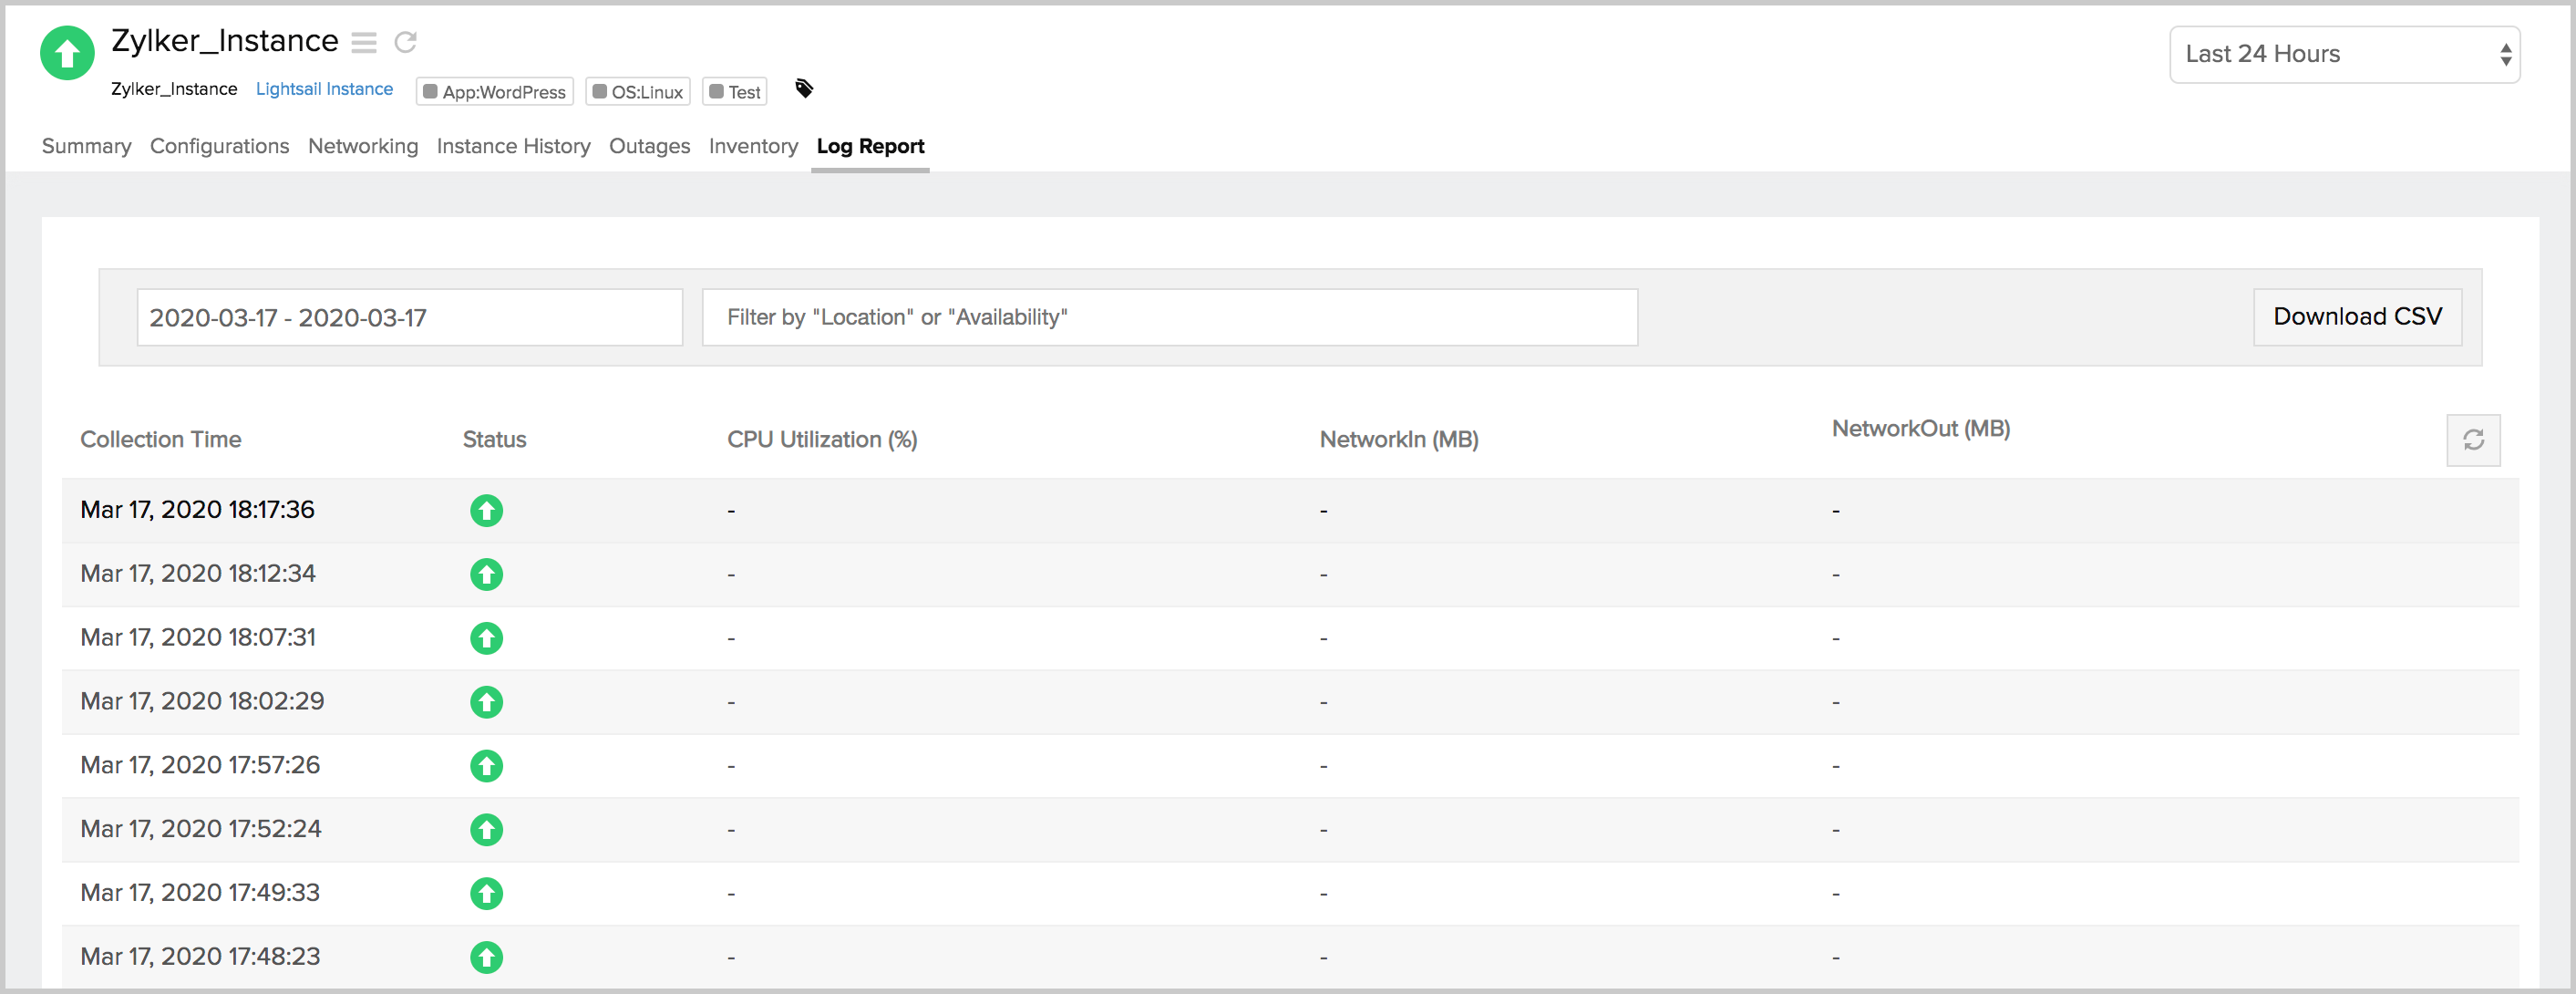
- With uptime monitoring enabled, the log report displays only the status of your monitor for each polled frequency.
Video
Here's a quick video that explains how AWS uptime monitoring works and the metrics that come with it:
Configure Uptime Monitoring
Uptime monitoring can be configured in three different ways:
Editing a monitor
To configure uptime monitoring by editing a monitor, follow the steps below:
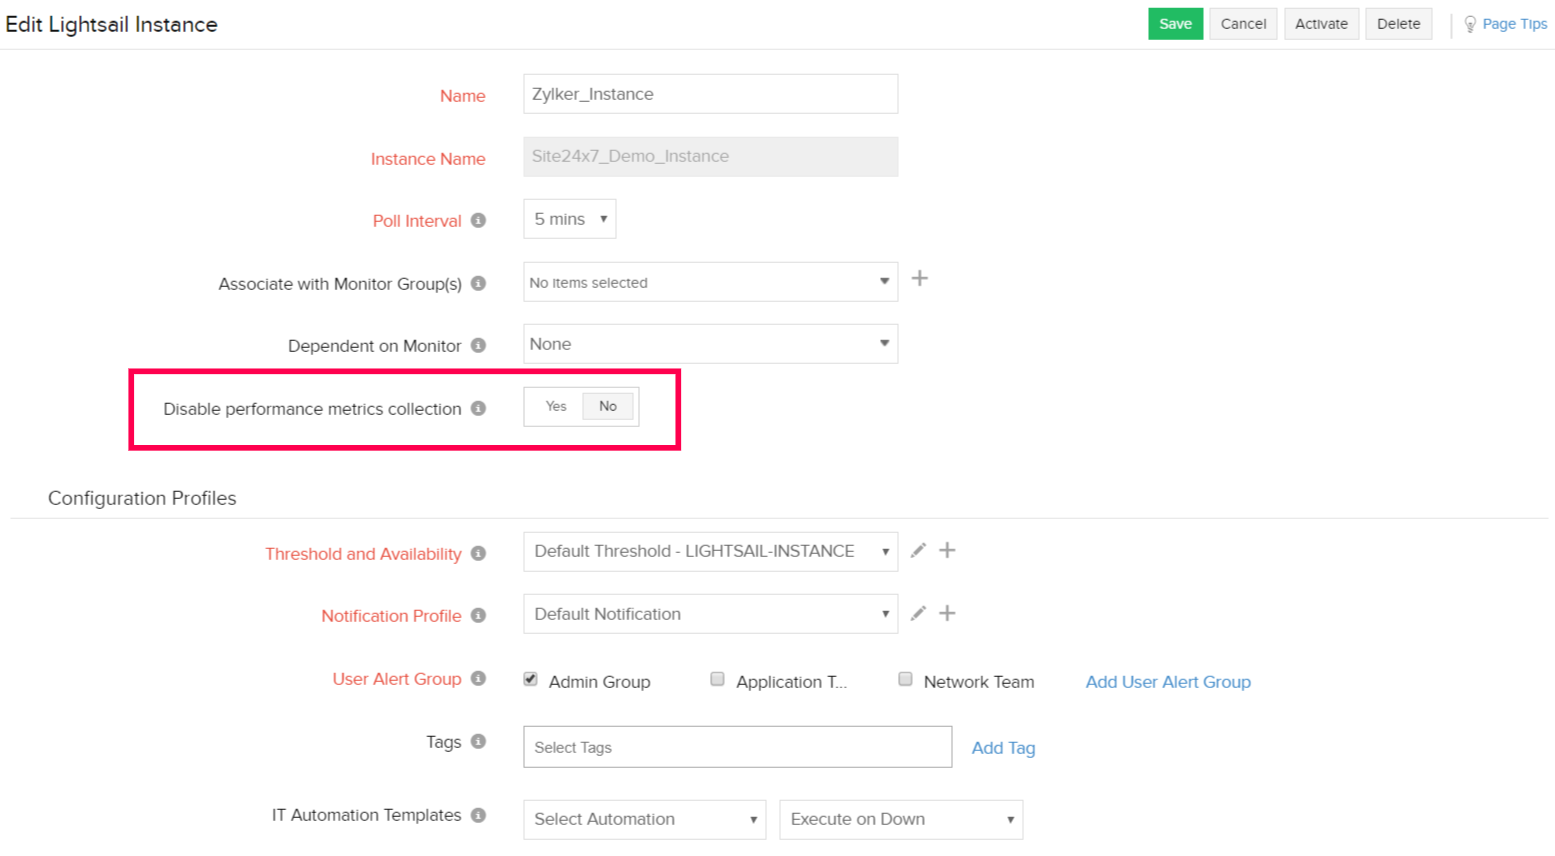
- In the Site24x7 console, navigate to the Edit Monitor Details page of a monitored AWS resource.
- Toggle the Disable performance metrics collection option according to your preference.
Defining an action as a configuration rule
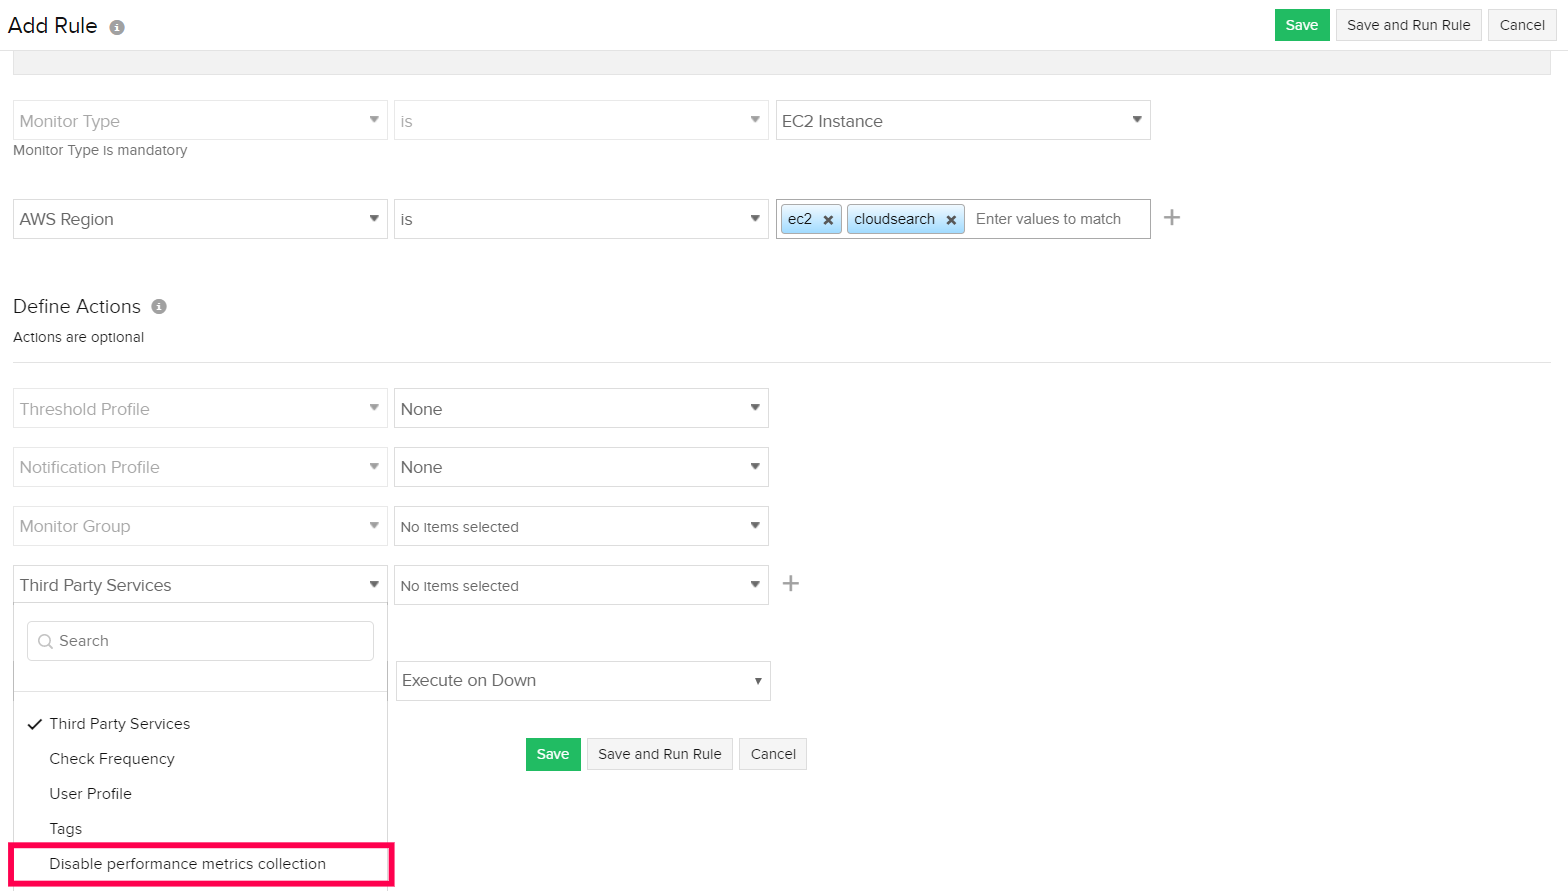
Follow the initial steps for adding a configuration rule listed here. When you define an action from the drop-down, select Disable performance metrics collection and set the value as True. Upon enabling Uptime Monitoring, the changes will be reflected.
Using Tags
Configure uptime monitoring efficiently for resources using tags. Set the tag "uptime_site24x7" as True, so that the respective AWS resource(s) is considered for uptime monitoring during discovery or at the next data collection.
Threshold Configuration
The set of thresholds that can be configured and notified with uptime monitoring enabled, are listed below.
| Threshold Name | Monitor Type | Possible Status Changes |
|---|---|---|
| Notify for Agent Failures | EC2 Instance, Lightsail Instance | Down, Trouble, Critical |
| Notify for Status Check Failures | EC2 Instance | Down, Trouble, Critical |
| Notify for Auto-Scaling Instance Termination | EC2 Instance, Lightsail Instance | Down, Trouble, Critical |
| Notify for Spot Instance Termination | EC2 Instance | - |
| Notify for Scheduled Instance Termination | EC2 Instance | - |
| Notify for EMR instance termination | EC2 Instance | - |
| Notify for Volume Status Check Failures | EC2 Instance | - |
| Notify as Trouble when a monitored resource is Down/Trouble/Critical. | Elastic Beanstalk, Lightsail LoadBalancer, EC2 Autoscaling, StepFunction, EMR, Neptune Cluster, AMQ, Storage Gateway | Trouble |
| Notify as Trouble when a monitored node is Down/Trouble/Critical. | EKS Cluster | Trouble |
| Notify as Trouble when a monitored namespace is Down/Trouble/Critical. | EKS Cluster | Trouble |
| Notify as Trouble when the instances not in healthy state. | Lightsail LoadBalancer | Trouble |
| Notify for Environment Health Failures | Elastic Beanstalk | Down, Trouble, Critical |
| Notify for Environment Health Status Warning | Elastic Beanstalk | Down, Trouble, Critical |
| Notify for Virtual Interface Failure | Direct Connect | Down, Trouble, Critical |
| Notify for Tunnel State Failure | VPC-VPN | - |
| Accepted Routes | VPC-VPN | Trouble, Critical |
| Active Services | ECS Cluster | Trouble, Critical |
| Pending Tasks | ECS Cluster, ECS Cluster Service | Trouble, Critical |
| Running Tasks | ECS Cluster, ECS Cluster Service | Trouble, Critical |
| Container Instances | ECS Cluster | Trouble, Critical |
| EC2 Pending Tasks | ECS Cluster | Trouble, Critical |
| EC2 Running Tasks | ECS Cluster | Trouble, Critical |
| Memory Available | ECS Cluster | Trouble, Critical |
| CPU Available | ECS Cluster | Trouble, Critical |
| Service - Pending Tasks | ECS Cluster | Trouble, Critical |
| Service - Running Tasks | ECS Cluster | Trouble, Critical |
| File Metered Size | EFS | Trouble, Critical |
| Steps Failed | EMR | Trouble, Critical |
| Number of Debug Events | Elastic Beanstalk | Trouble, Critical |
| Number of Error Events | Elastic Beanstalk | Trouble, Critical |
| Number of Fatal Events | Elastic Beanstalk | Trouble, Critical |
| Number of Info Events | Elastic Beanstalk | Trouble, Critical |
| Number of Trace events | Elastic Beanstalk | Trouble, Critical |
| Number of Warn Events | Elastic Beanstalk | Trouble, Critical |
| Instances Degraded (Health) | Elastic Beanstalk | Trouble, Critical |
| Instances Info (Health) | Elastic Beanstalk | Trouble, Critical |
| Instances No Data (Health) | Elastic Beanstalk | Trouble, Critical |
| Instances OK (Health) | Elastic Beanstalk | Trouble, Critical |
| Instances Pending (Health) | Elastic Beanstalk | Trouble, Critical |
| Instances Severe (Health) | Elastic Beanstalk | Trouble, Critical |
| Instances Unknown (Health) | Elastic Beanstalk | Trouble, Critical |
| Instances Warning (Health) | Elastic Beanstalk | Trouble, Critical |