RUM Dashboard
Get a holistic view about the status of your RUM applications with RUM dashboard. RUM dashboard lists all your active, inactive applications along with the ones that are in Trouble, Critical or Suspended state.
The RUM dashboard view and the various application status along with their inference is explained below.
- Dashboard View and List View
- Application Status
- Pageviews Consumption
Dashboard View and List view
You can add a new application by clicking on " Add Application" button, placed beneath the Search monitor bar.
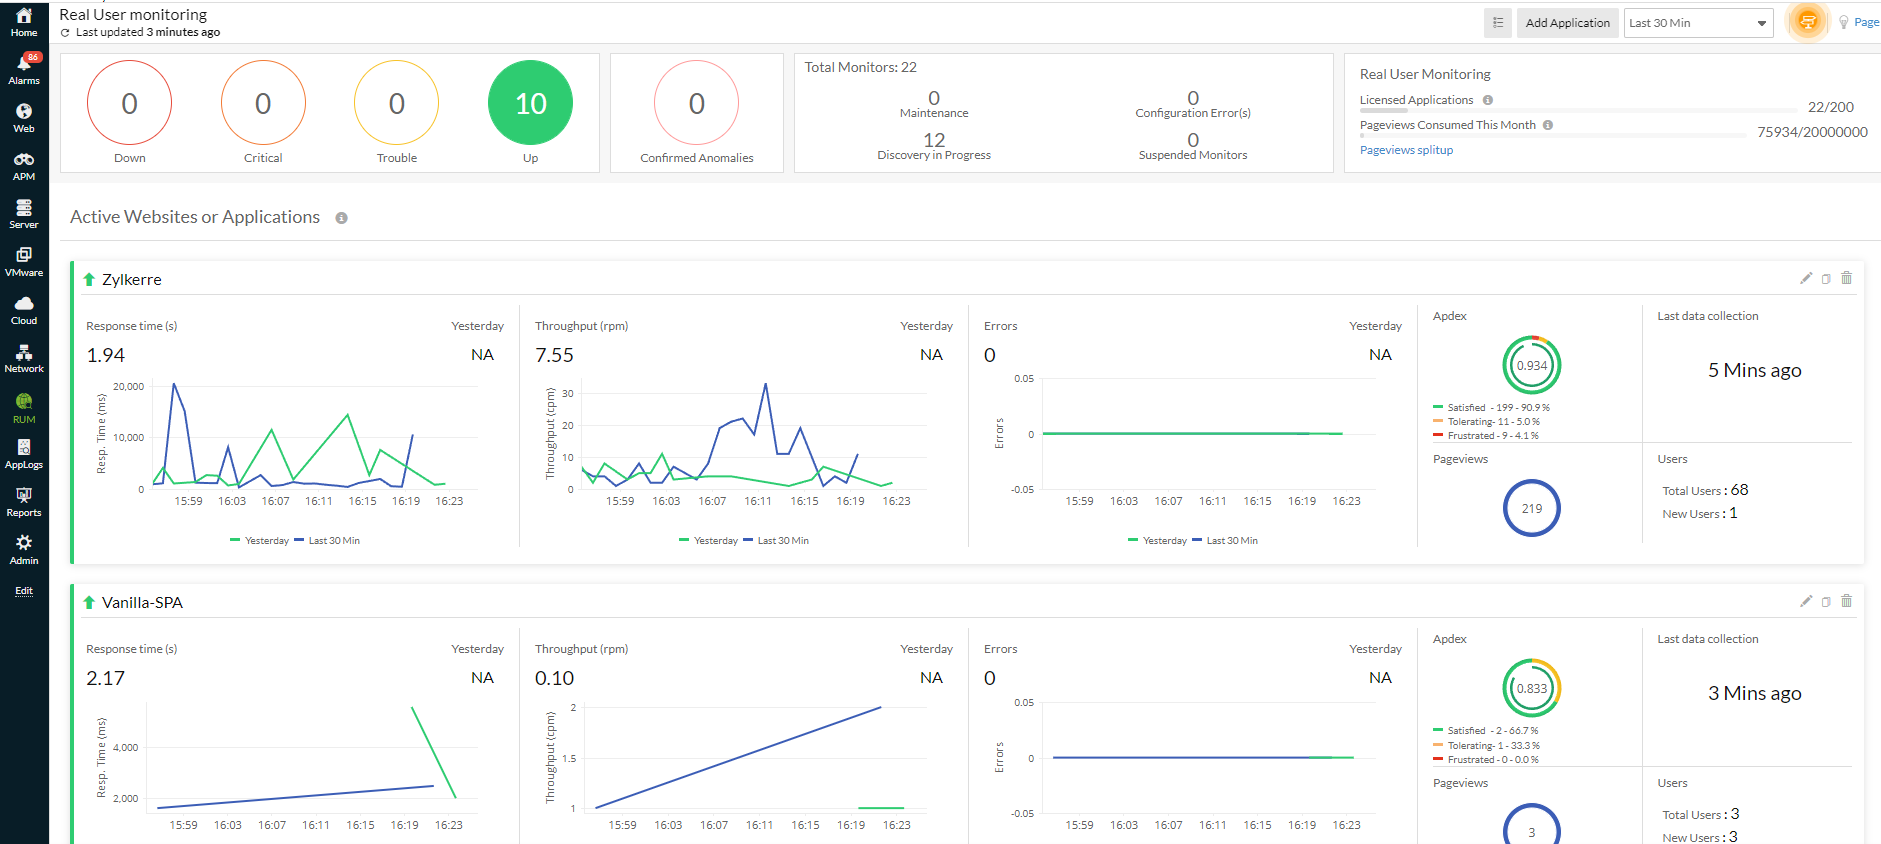
Dashboard View
List View
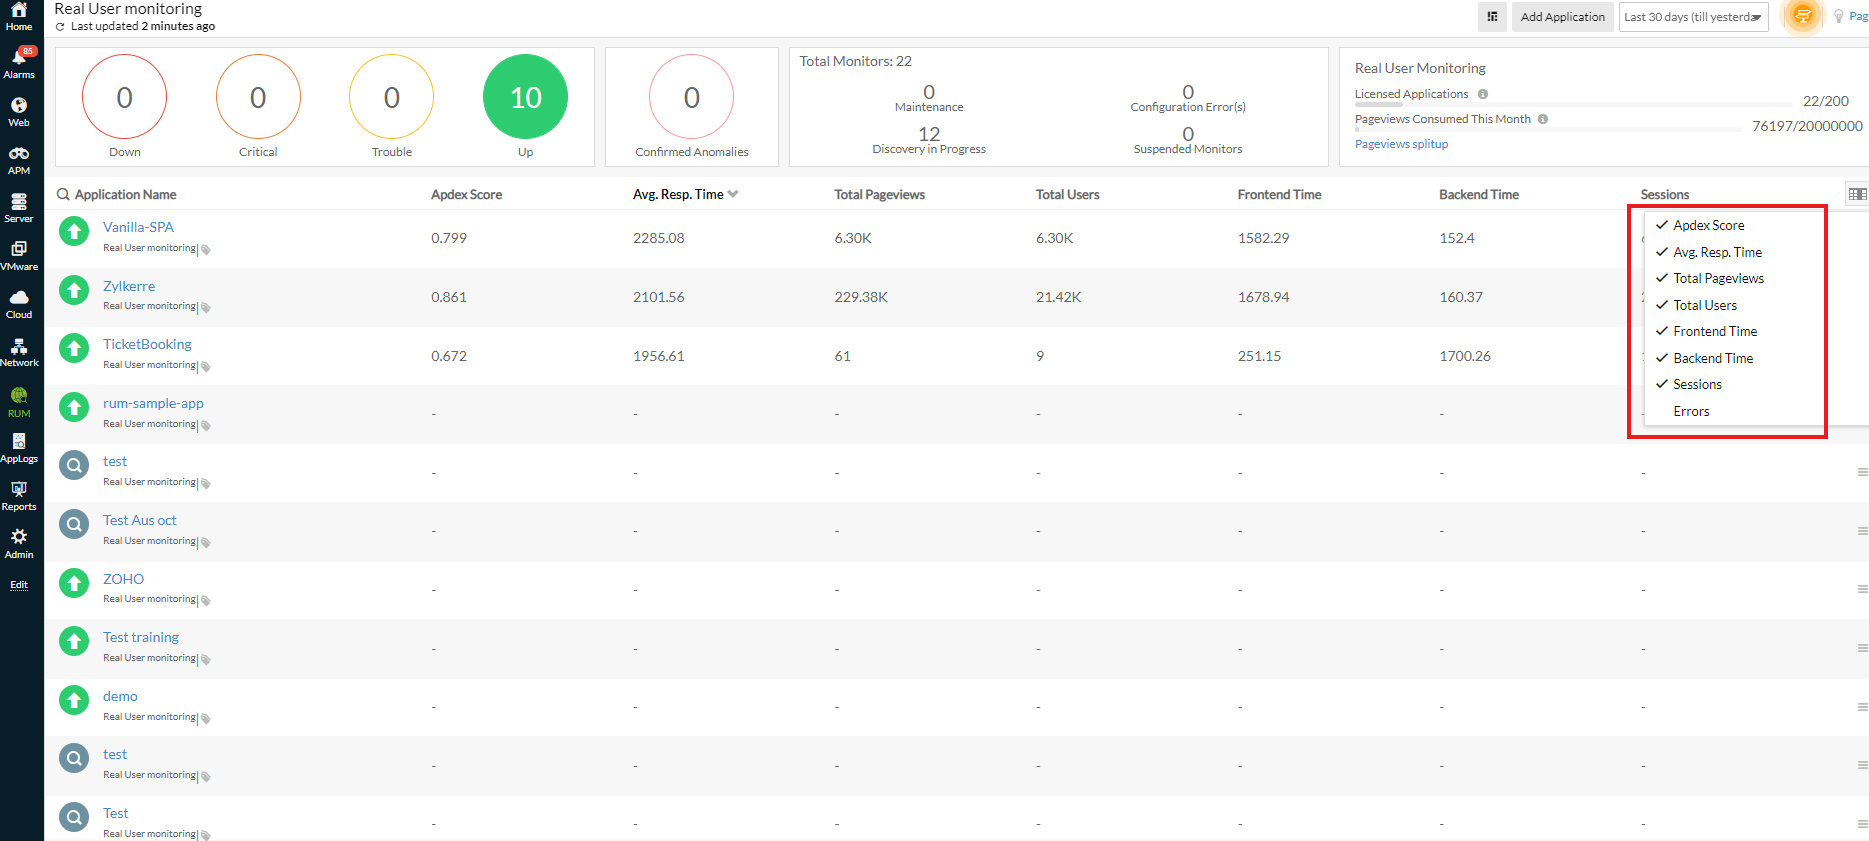
Key metrics like Apdex score, response time, total page views and unique page visits are shown for each application in both dashboard view and list view.
In case, if there is no traffic for an application in the chosen time frame, it is depicted as 'No Data'. For such applications, perform some transactions for the agent to initiate data collection.
Apdex score is a relative measurement of end users' satisfaction. It tells you whether your customer is satisfied or not, upon using your application.
Average Response time displays the average of response time taken by all transactions in the application under specified time period.
Total page view denotes the total count of your page visits ie., total of all your page views.
Unique visits denote the count specific to end user.
Example: When a same user visits your application thrice, it is recorded as 3 in Total page views and as 1 in Unique visits.
Note: Unique visits are browser specific. When an user visits your application from multiple browsers, each browser type gets added up for the unique visits.
You can copy, edit or delete your applications using the hamburger icon placed at right corner of each application list.
Click on the right corner icon and filter metrics to be displayed in List view
You can also search, sort your applications by their name and choose your default columns to be displayed.
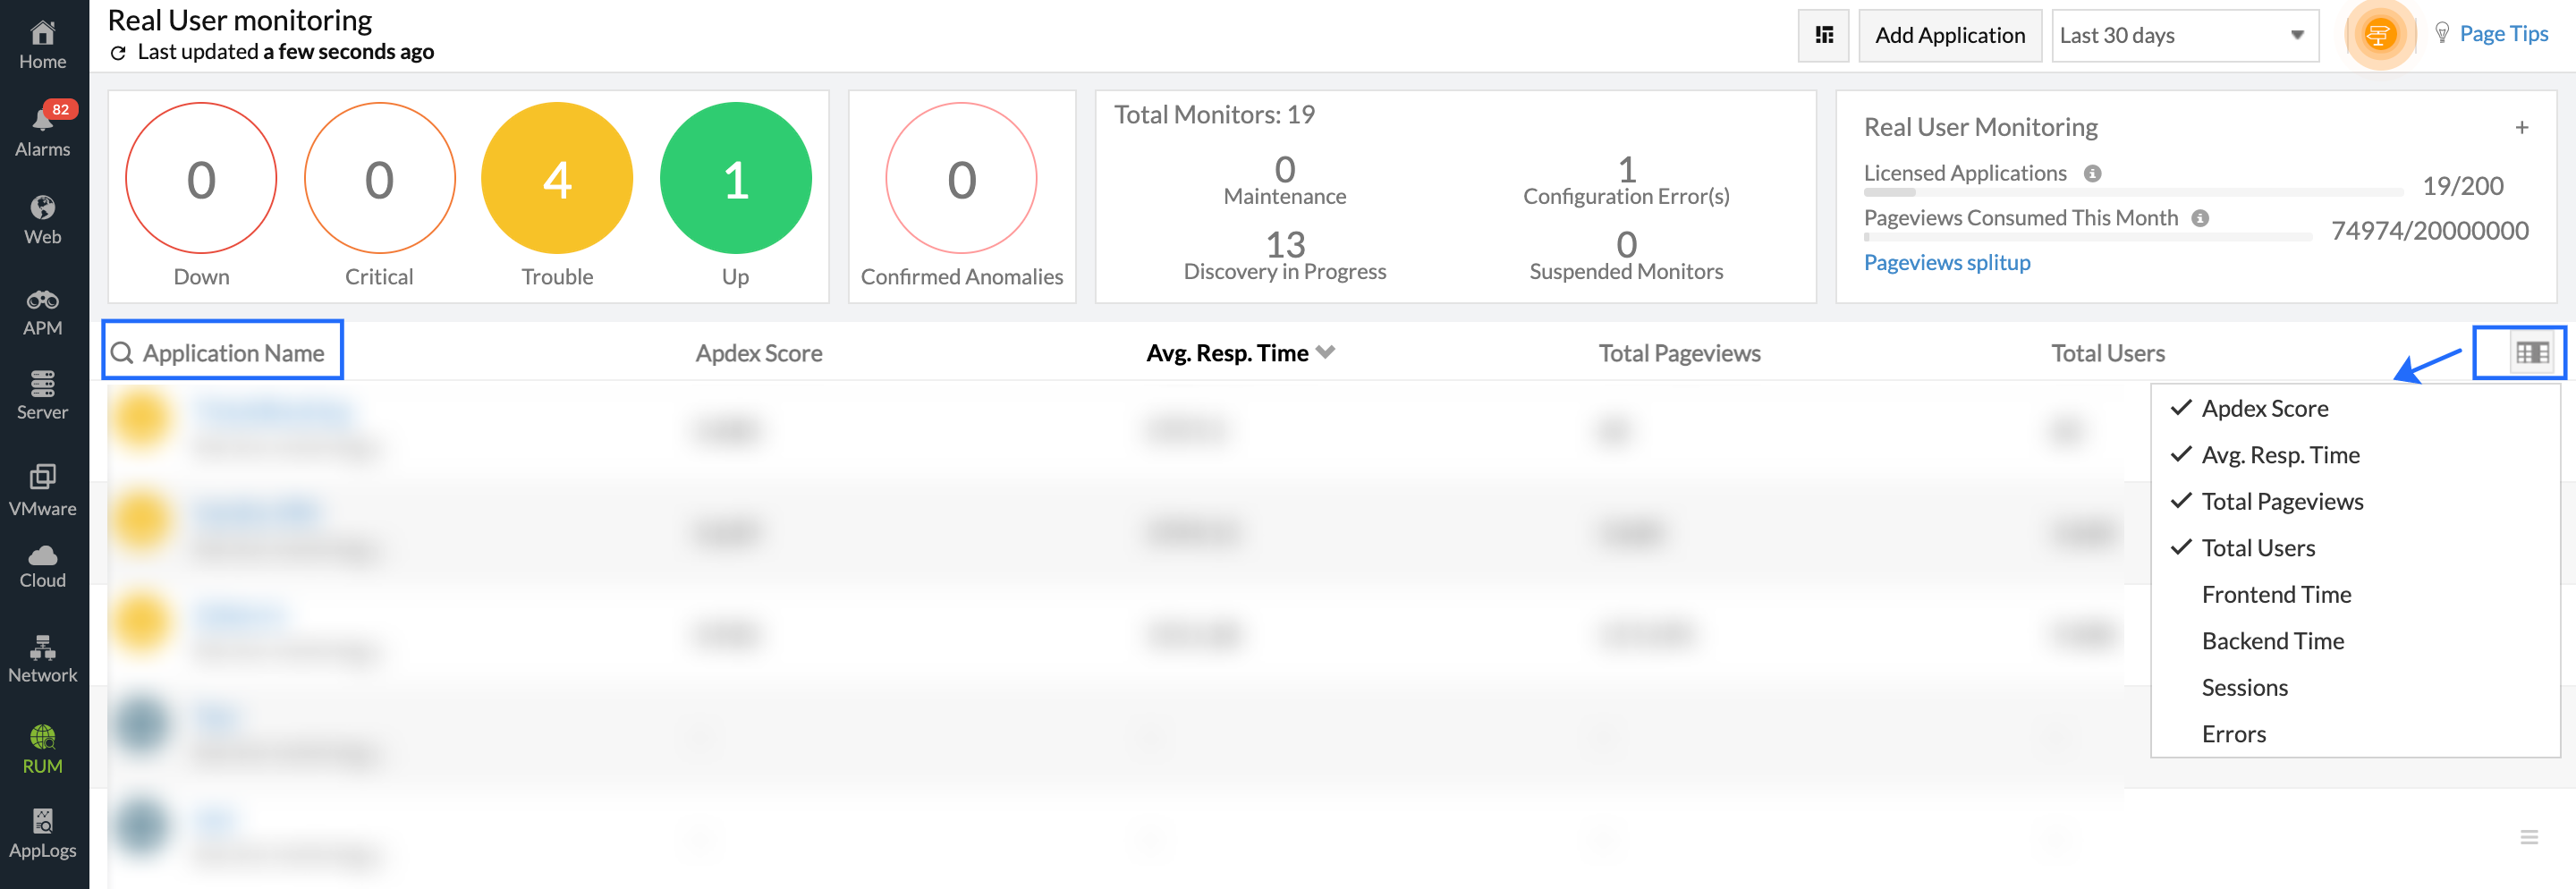
If your account has more than five applications, the list view will be displayed by default.
Active Applications
Applications, where there is continuous data collection are classified under ' Active applications'. Key metrics like Average response time, Unique pageviews and total pageviews can be viewed for all your active applications.
Change in your application response time with respect to previous data can be viewed in dashboard view.
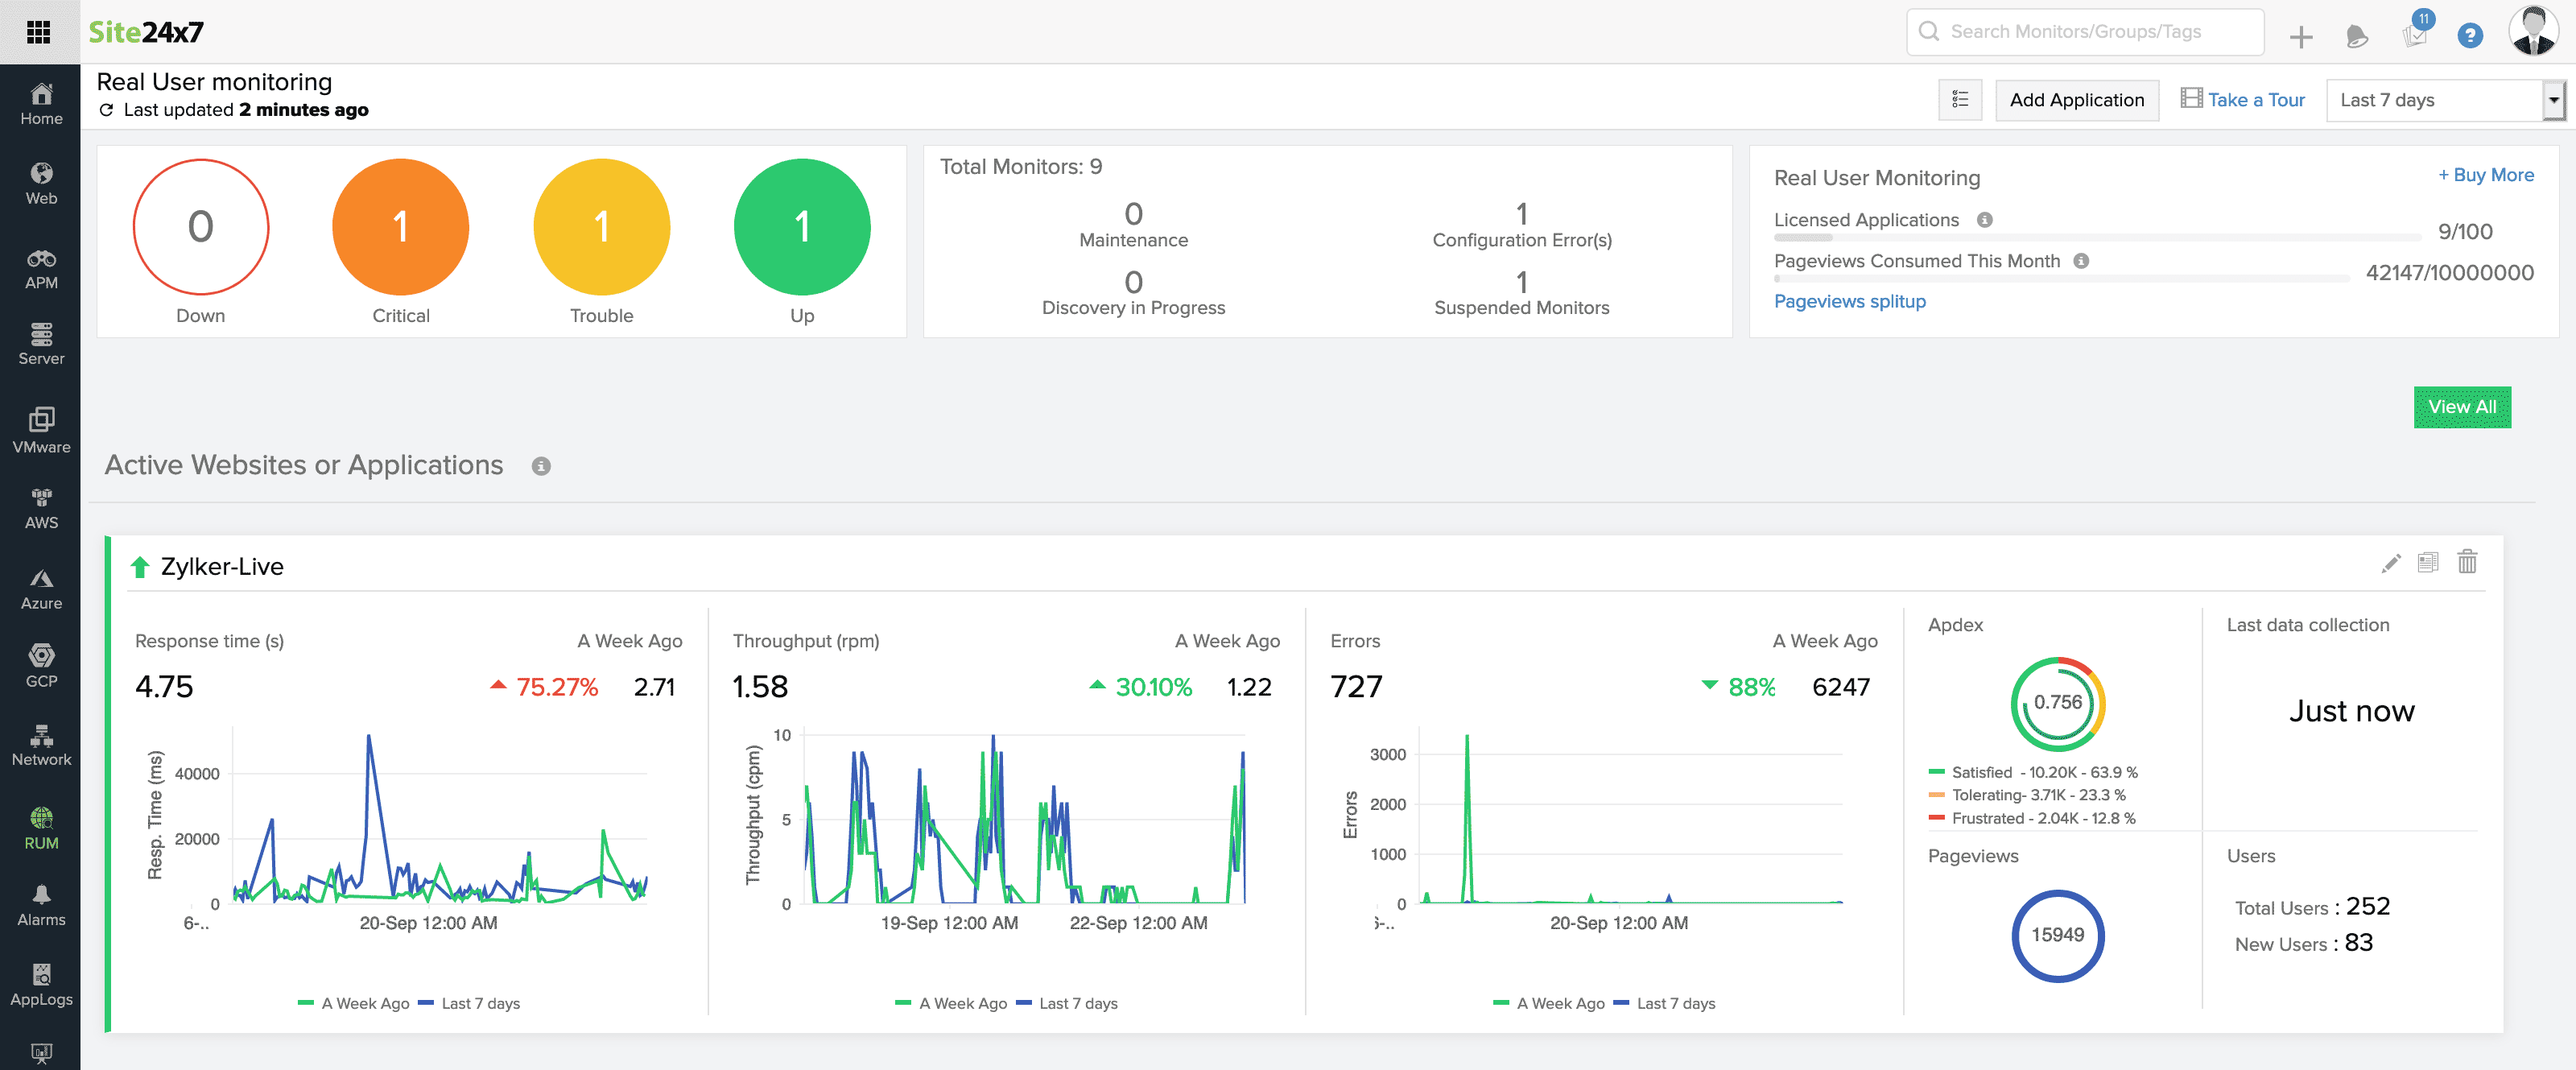
For Last 1, 3, 6 and 12 hours, change in response time is compared with the corresponding data from the last 24 hours.
For Today, it is compared with yesterday.
For last 1 day, it is compared with it's previous day.
For 'This week' , it is compared with the previous week
For Last 7 days, it is compared with the previous 7 days.
For last 30 days, it is compared with previous month's Response time.
The change in Response time indicates your application performance with respect to selected time period.
You can also track your product updates or feature enhancements using Milestone marker. This lets you to track the changes and identify if those changes attribute to any change in response time.
Trouble and Critical Applications
Your application goes into Trouble or Critical state when it exceeds the specified threshold level for key metrics like Apdex score, front-end and back-end time, network time, average response time, error count and error rate.
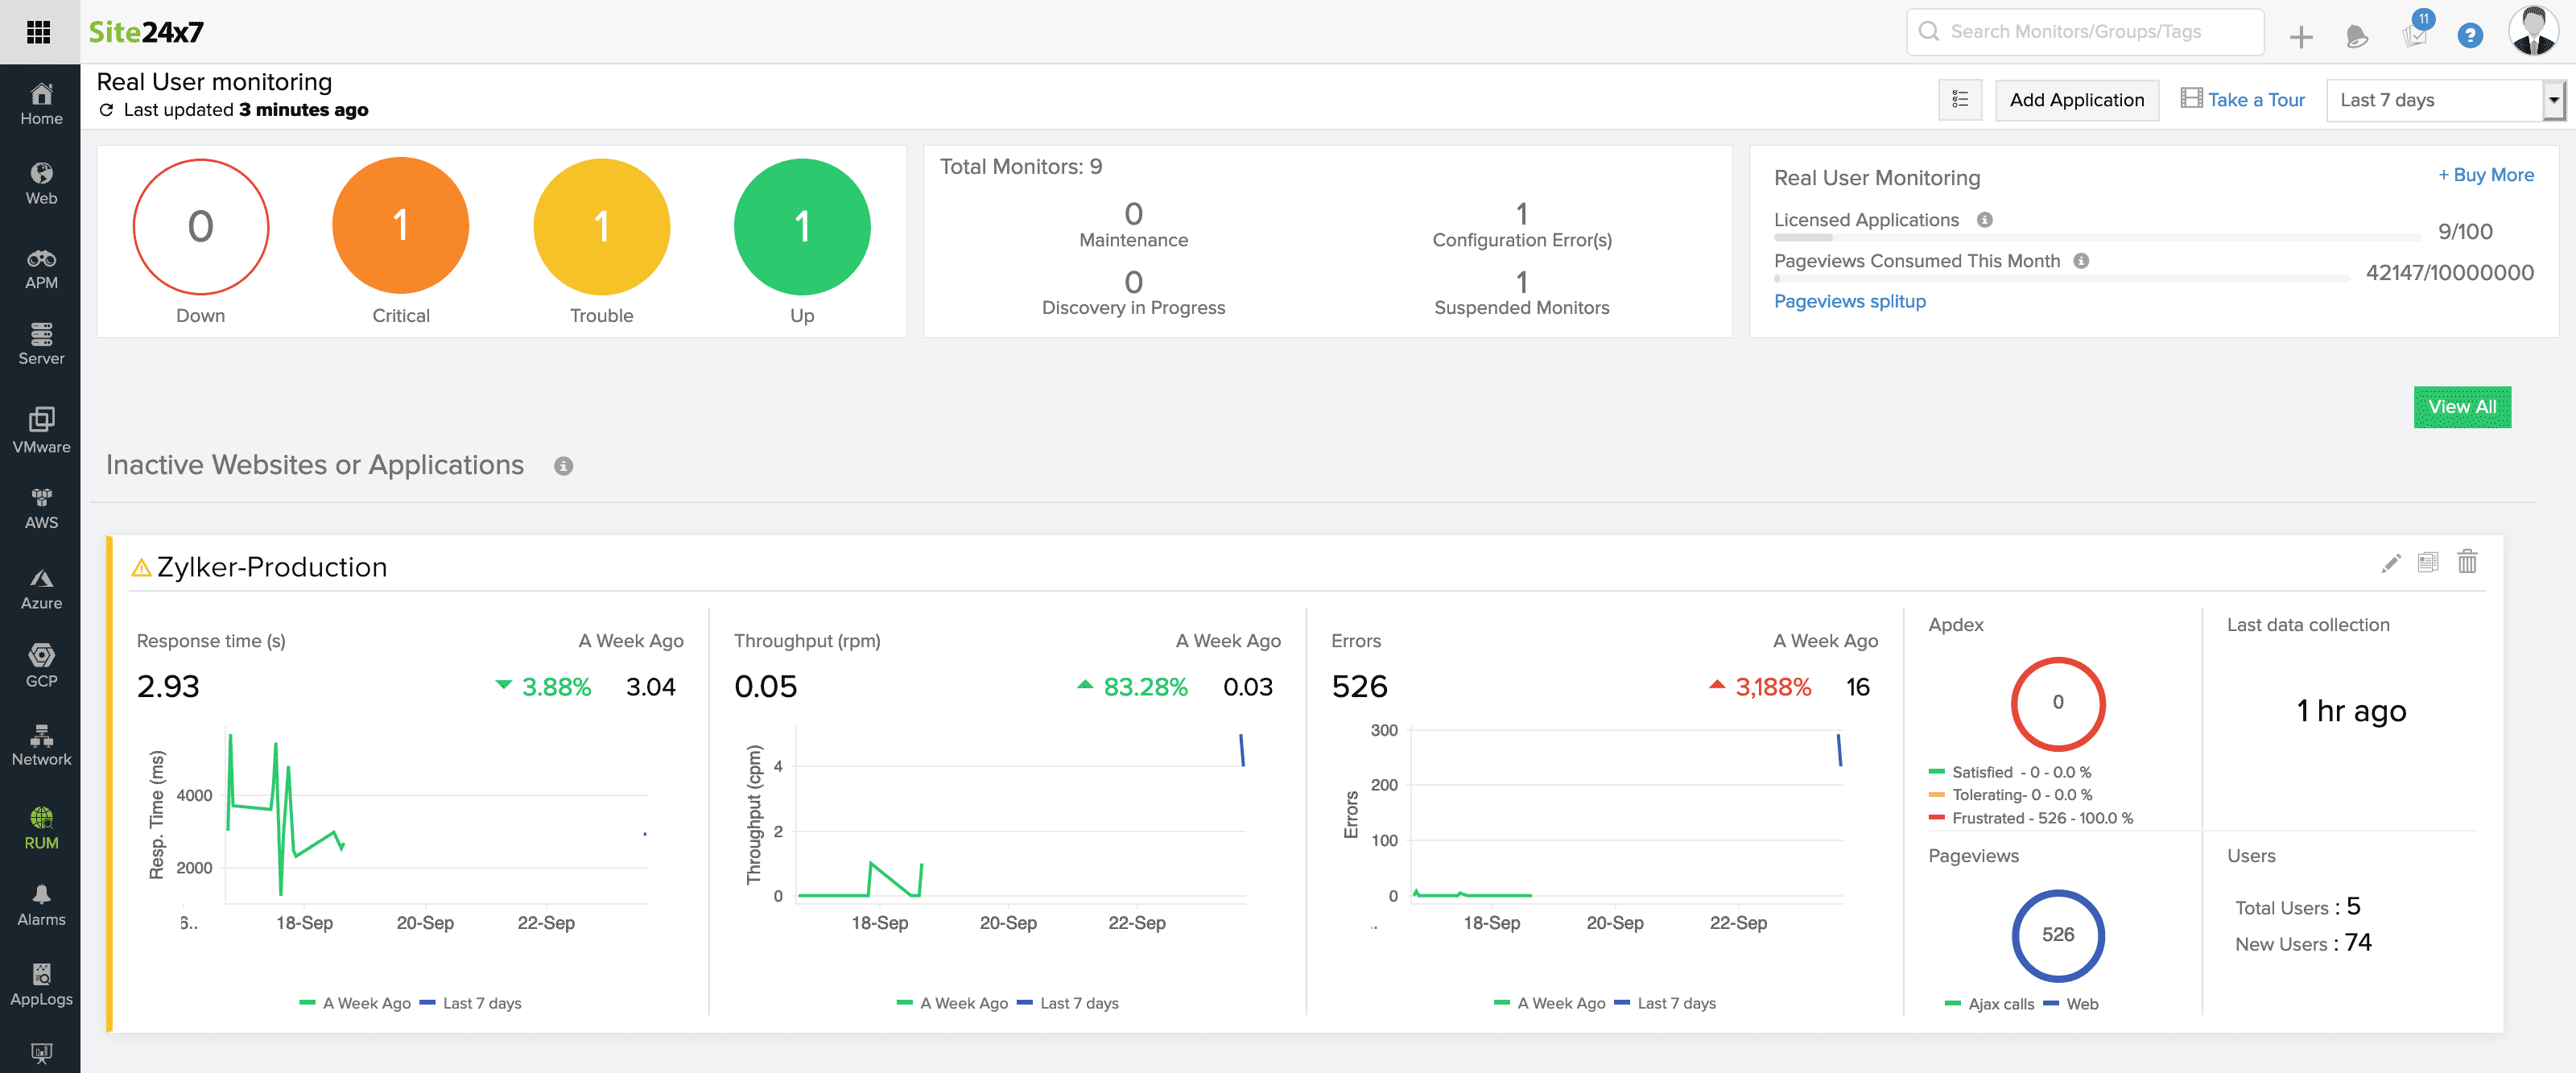
You will receive an alert when your application goes into Trouble or Critical state.
Refer here to configure alerts.
Suspended Applications
When your application exceeds the licensed pageviews limit, it is automatically suspended. Note that, when you have multiple applications in your account and one of them consumes the entire pageviews limit, all applications under that account are suspended.

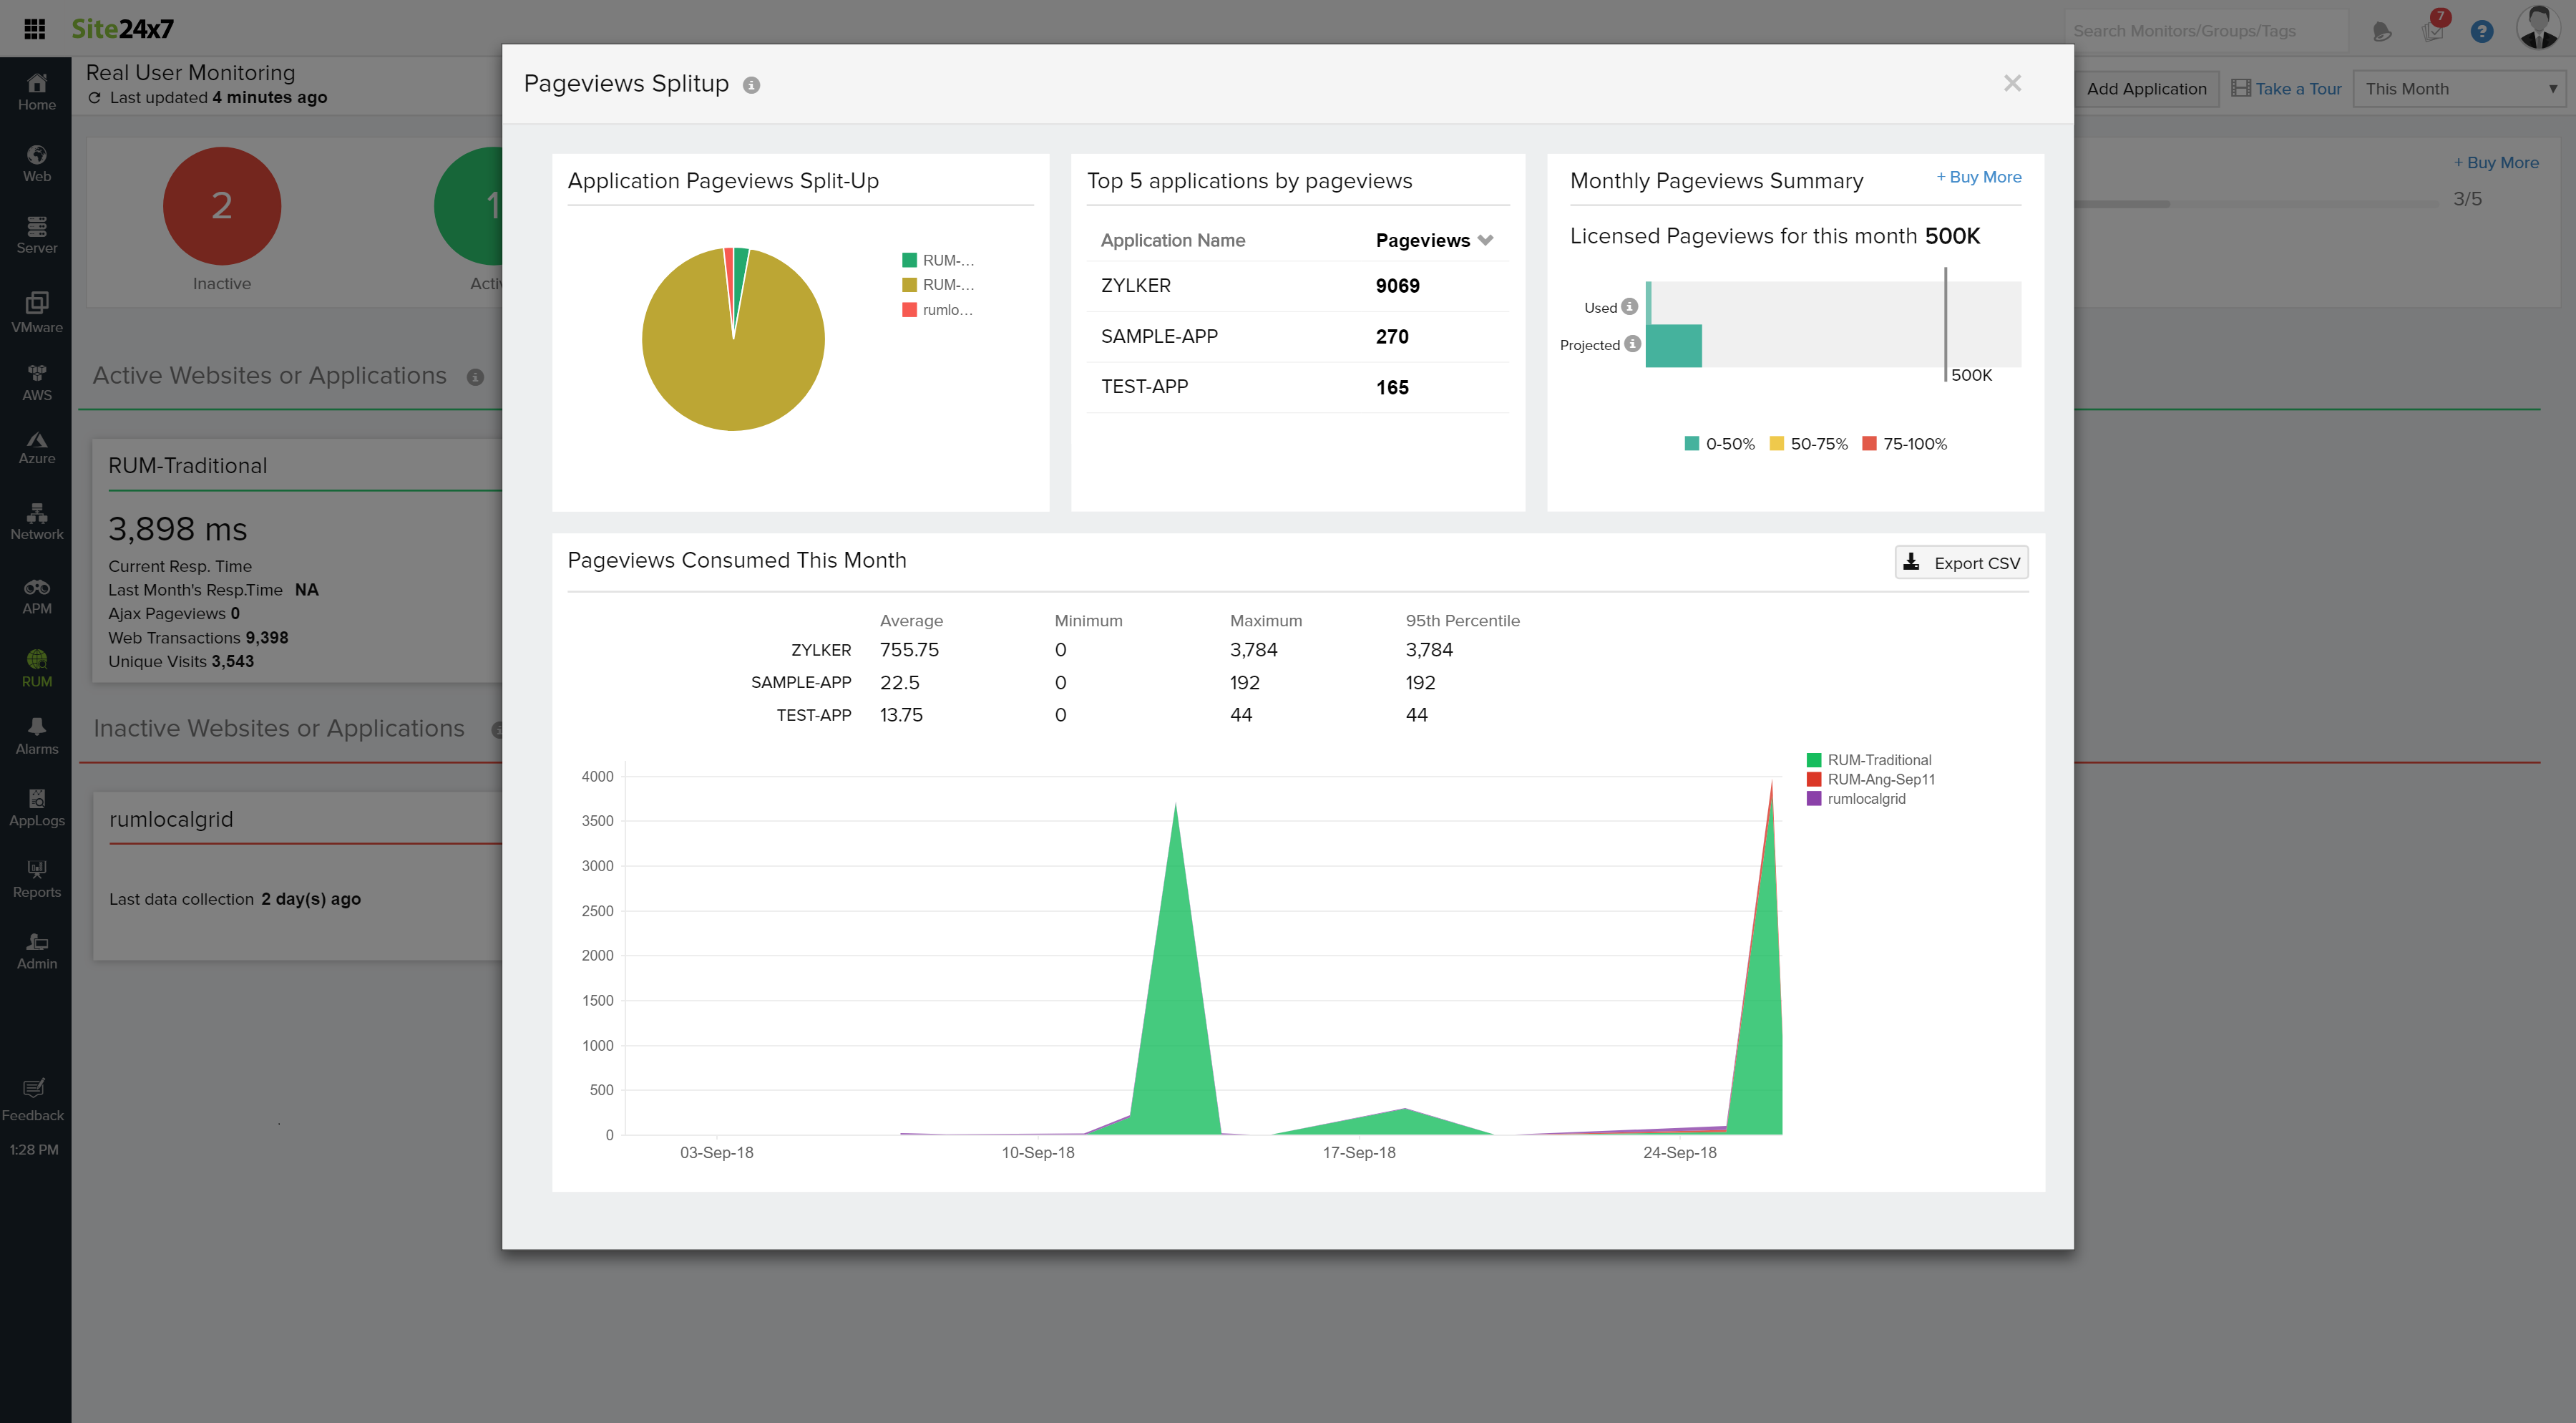
Pageviews Split Up
You can view the pageviews consumption split up by your individual applications for that particular month. Current usage and Projected usage along with the licensed limit is displayed in the same tab and you can always upgrade your plan.
