RUM Events
RUM Events provide critical insights into the performance and user experience of your web applications. By tracking real user interactions and key performance metrics—such as dead clicks, quick backs, rage clicks, and excessive scrolling of user sessions—you can identify and address issues that impact your website's functionality and user satisfaction.
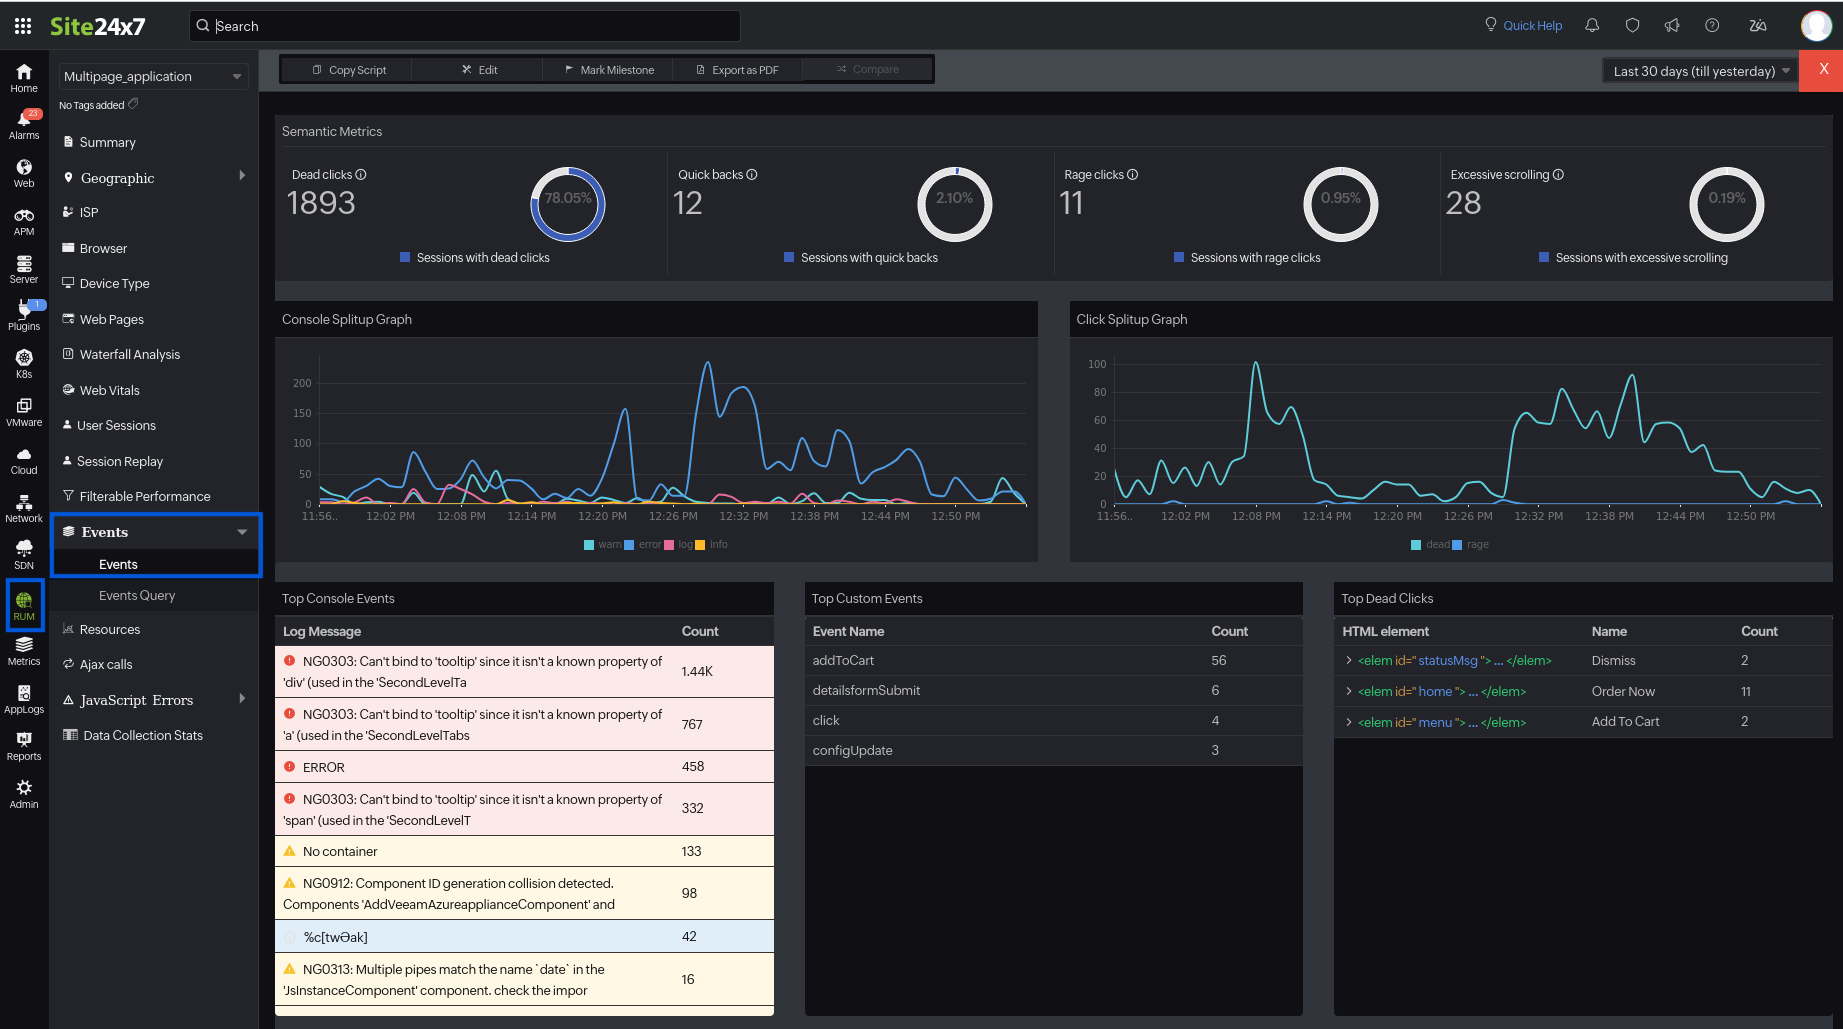
To view the metrics for the selected web page:
- Log in to your Site24x7 web client.
- Navigate to RUM > Your application > Events.
This guide will help you understand and leverage the various RUM events to optimize your application's performance effectively.
Semantic Metrics
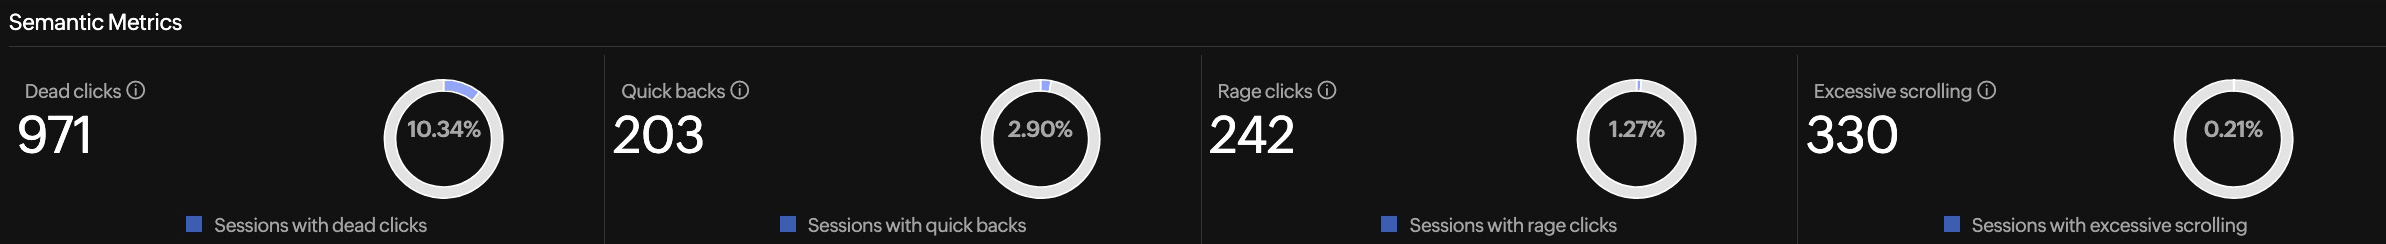
Dead clicks
Dead clicks occur when users click on an element and do not receive a response or feedback within a reasonable time frame. This means the visual state remains unchanged, and the user is not redirected to another page. Dead clicks can indicate problems such as broken elements, delayed responses, or confusing interface designs.
In the UI, we show the number of dead clicks and the percentage of user sessions with dead clicks. If you hover over the percentage, you can see the original numbers.
Quick backs
Quick backs occur when a user navigates away from the current page to another site and quickly returns. This behavior suggests that the user did not find the external page useful. Quick backs are identified when the user returns to the original page within a short, predefined time frame.
Monitoring quick backs helps detect navigation issues and improve user experience by addressing areas where users might be misled or dissatisfied with the content they find.
In the UI, we show the number of quick backs and the percentage of user sessions with quick backs. If you hover over the percentage, you can see the number of sessions.
Rage clicks
Rage clicks are detected when a user rapidly clicks multiple times in a concentrated area of the page. These repeated clicks are marked as rage clicks and often indicate user frustration. Rage clicks typically occur when users expect an element to be interactive, but it fails to respond as anticipated.
In the UI, we show the number of rage clicks and the percentage of user sessions with rage clicks. If you hover over the percentage, you can see the original numbers.
Excessive scrolling
Excessive scrolling is detected when a user scrolls vertically more than usual within a session. This can highlight potential issues such as poor content layout, difficulty in finding information, or a frustrating user interface.
In the UI, we show the number of instances of excessive scrolling and the percentage of user sessions with excessive scrolling. If you hover over the percentage, you can see the number of sessions.
Graphs
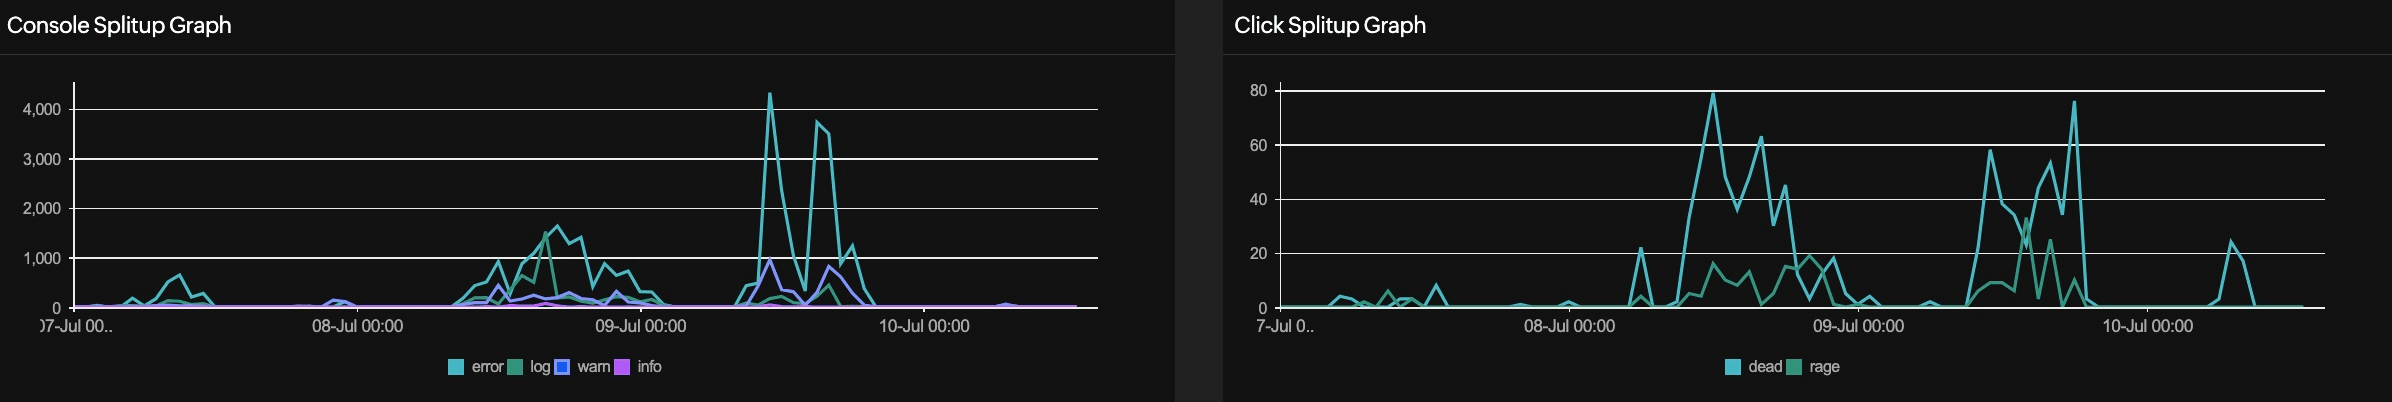
Console Splitup Graph
This graph shows the distribution of console events over time. It categorizes the console events into errors (error), logs (log), warnings (warn), and information (info), allowing you to see the frequency and timing of these console messages. This helps in identifying periods with a higher occurrence of warnings and errors, which aids in debugging and performance analysis.
Click Splitup Graph
This graph visualizes the distribution of dead clicks and rage clicks over time, showing when and how frequently these clicks occur. This helps in understanding user interaction issues and identifying specific times when problematic clicks are more prevalent.
Top events
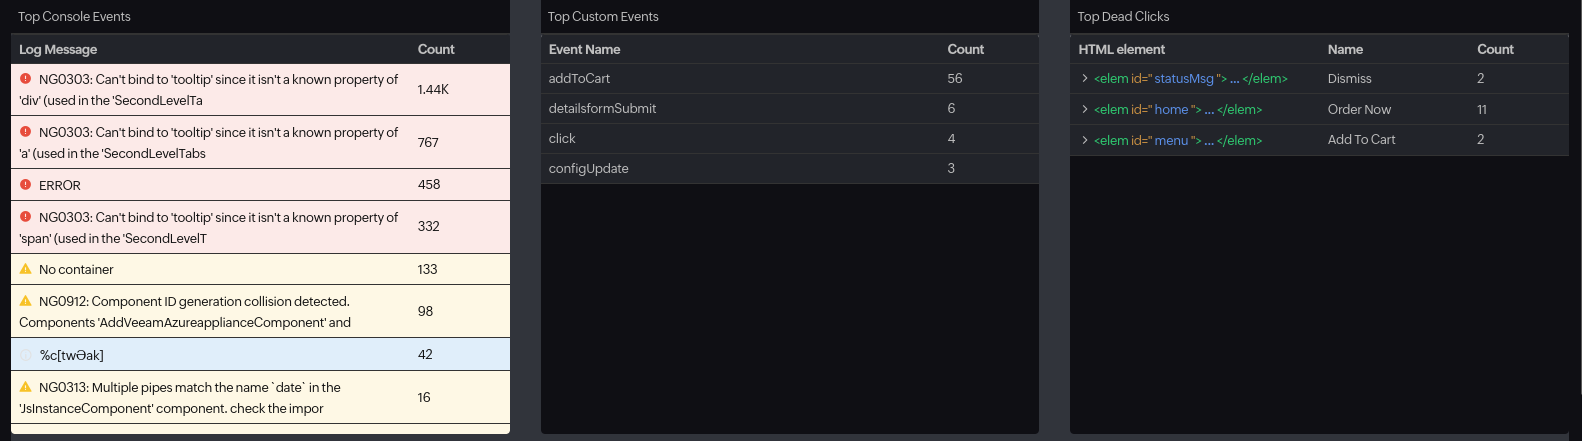
Top Console Events
Lists the most frequently occurring console log messages. This section includes the following information:
- Log Message: The content of the console log messages, such as warnings and errors, that were recorded during user sessions.
- Count: The number of times each specific log message was recorded.
Top Custom Events
Prerequisites:
Add the following custom API to the RUM script to capture the custom events.
s247r('trackEvents',true);
s247r('addEvent', <event_type>);
This lists the custom-defined events that occurred most frequently within the selected time frame. These events are user-defined actions or interactions that developers want to track specifically for their applications.
- Event Name: Names of the custom events that have been defined and tracked in the application.
- Count: The number of times each custom event occurred during the selected period.
Top Dead Clicks
Lists the HTML elements that were most frequently clicked without any response during user sessions. It provides the following information for each element:
- HTML Element: The specific HTML tag or class of the element that received the dead clicks.
- Name: The name of the element.
- Count: The number of times each element was clicked without a response.
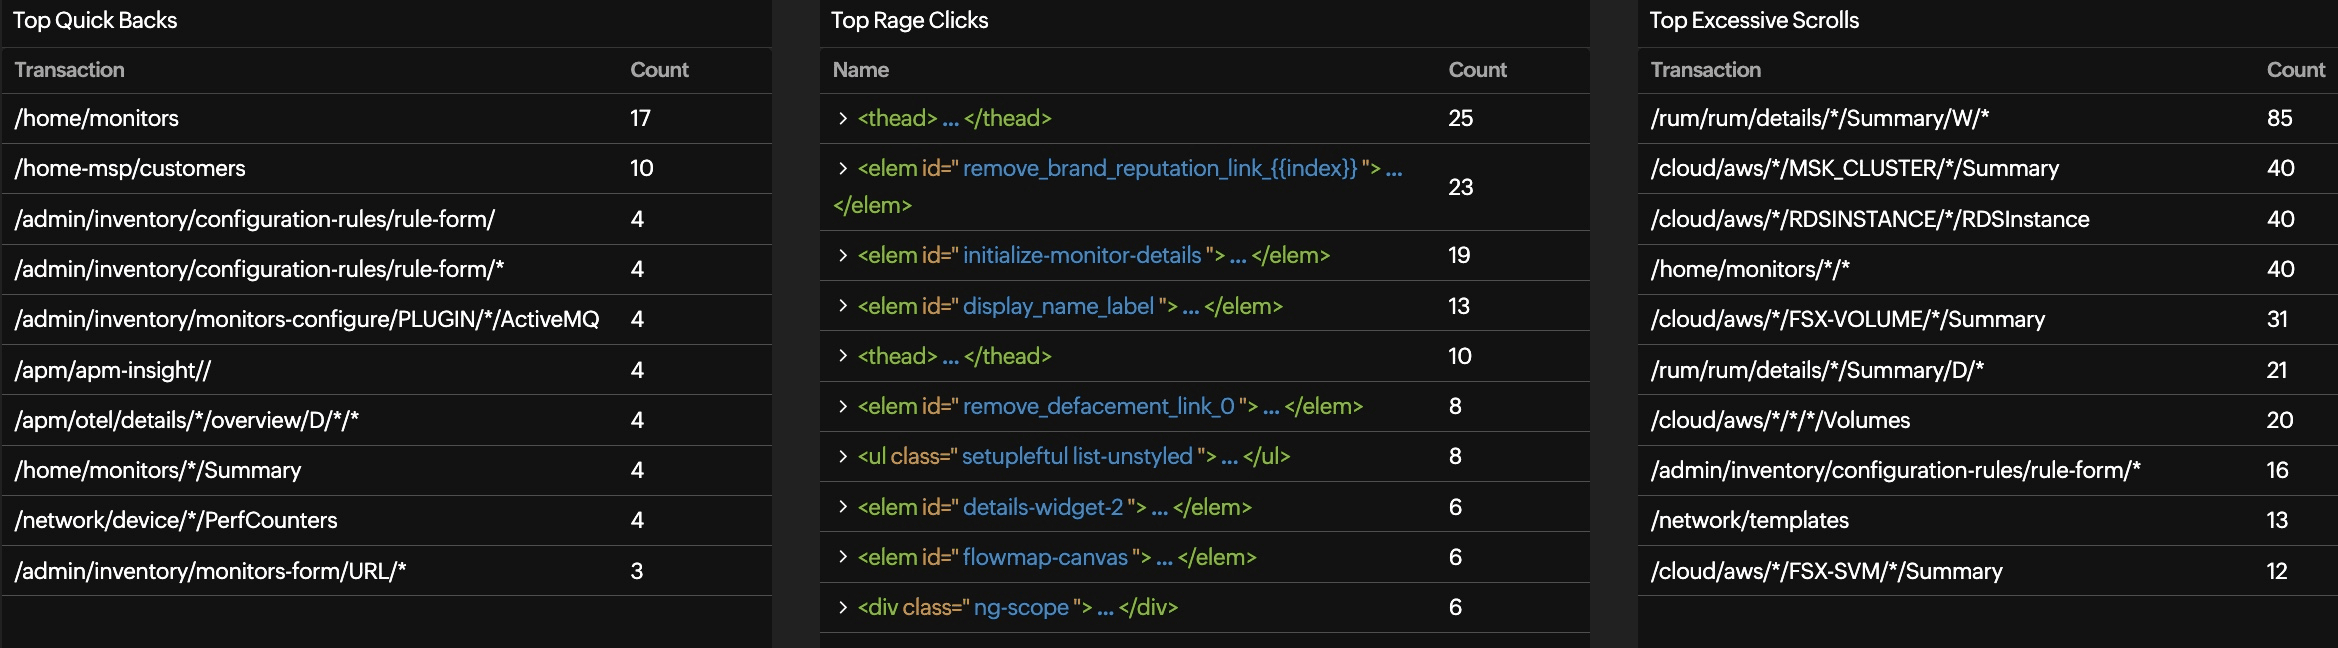
Top Quick Backs
Lists the URLs or page paths where quick backs are involved. It includes:
- Transaction: The transaction or URL involved in the quick back event.
- Count: The number of times quick backs occurred for each listed transaction.
Top Rage Clicks
Displays the HTML elements that are involved in rage clicks. It includes:
- Name: The HTML element (including its tag or ID) that was subject to rage clicks.
- Count: The number of rage clicks recorded for each element.
Top Excessive Scrolls
Lists the URLs or page paths where users engaged in excessive scrolling. It includes:
- Transaction: The URL or path of the page where excessive scrolling was detected.
- Count: The number of excessive scrolling incidents recorded for each listed transaction.
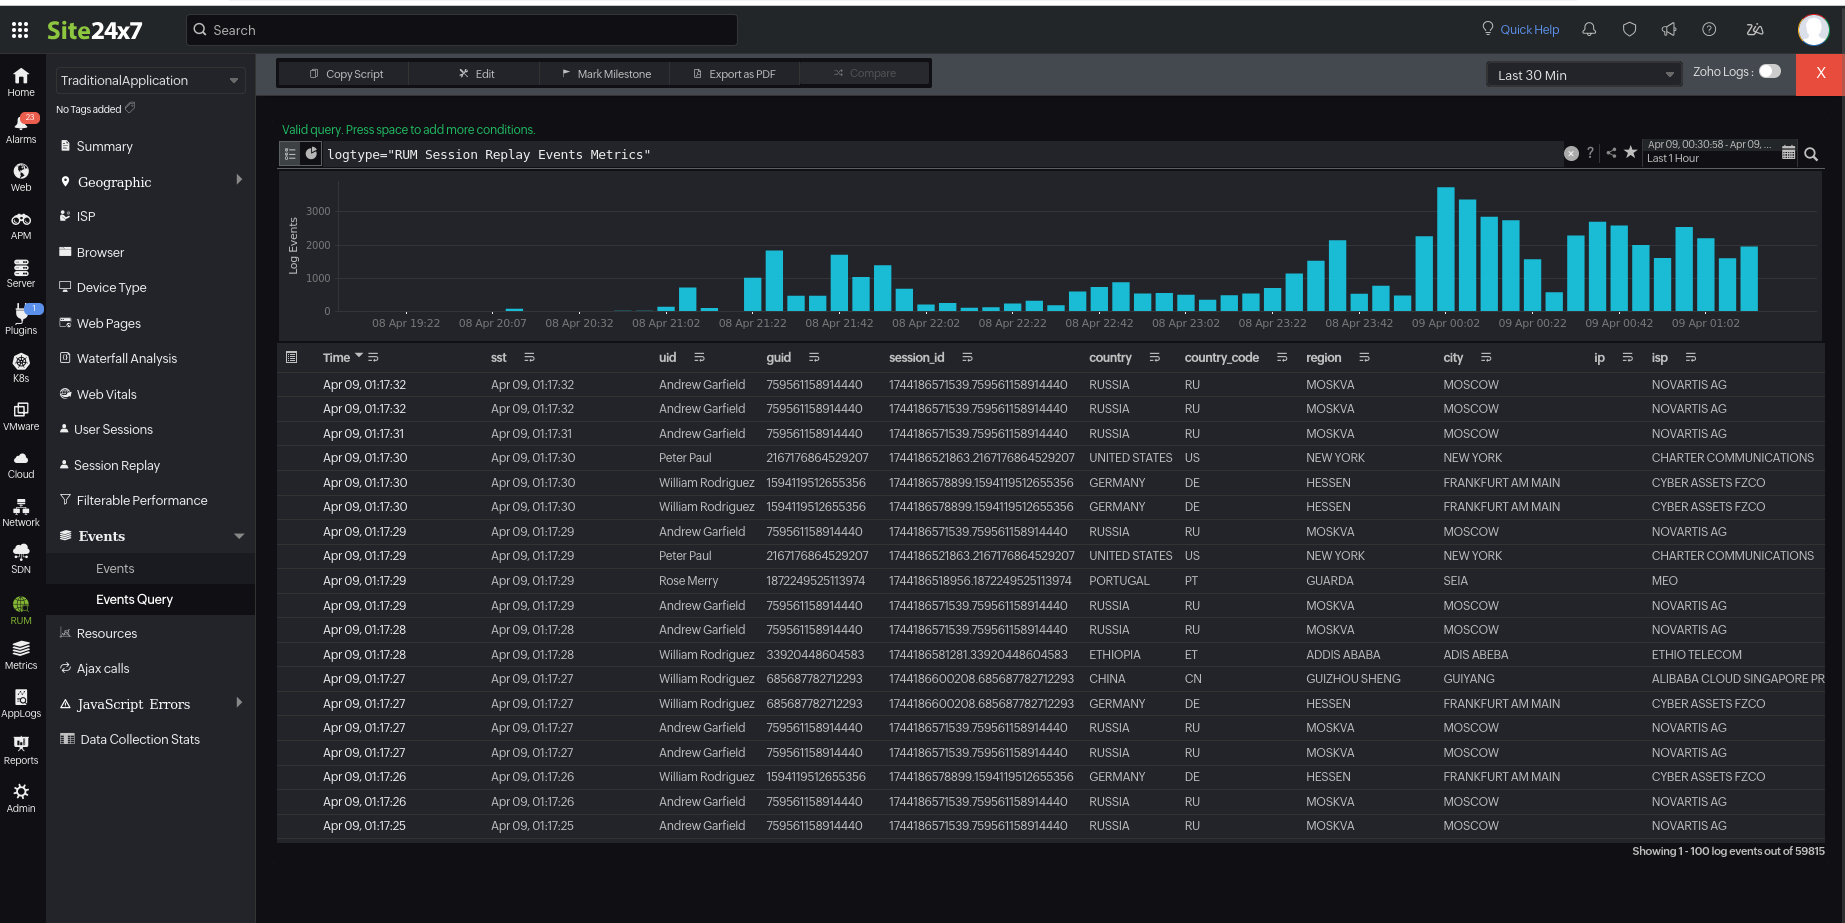
Events Query
The Events Query tab is used to perform custom searches on RUM events by directly entering your query, providing a flexible and powerful way to analyze user interactions.
To access this tab, navigate to RUM > Your application > Events > Events Query.
Here is an example query to understand how this filter works: