Performance metrics of Mid-server
The Mid-server performance metrics provide you with real-time visibility of your Mid-server's and the efficiency of your configured Mid-server(s).
These metrics help you monitor system resource usage, request handling capacity, and analyze downtime trends, ensuring that the Mid-server can reliably act as a secure communication bridge between your internal infrastructure and the Site24x7 cloud platform.
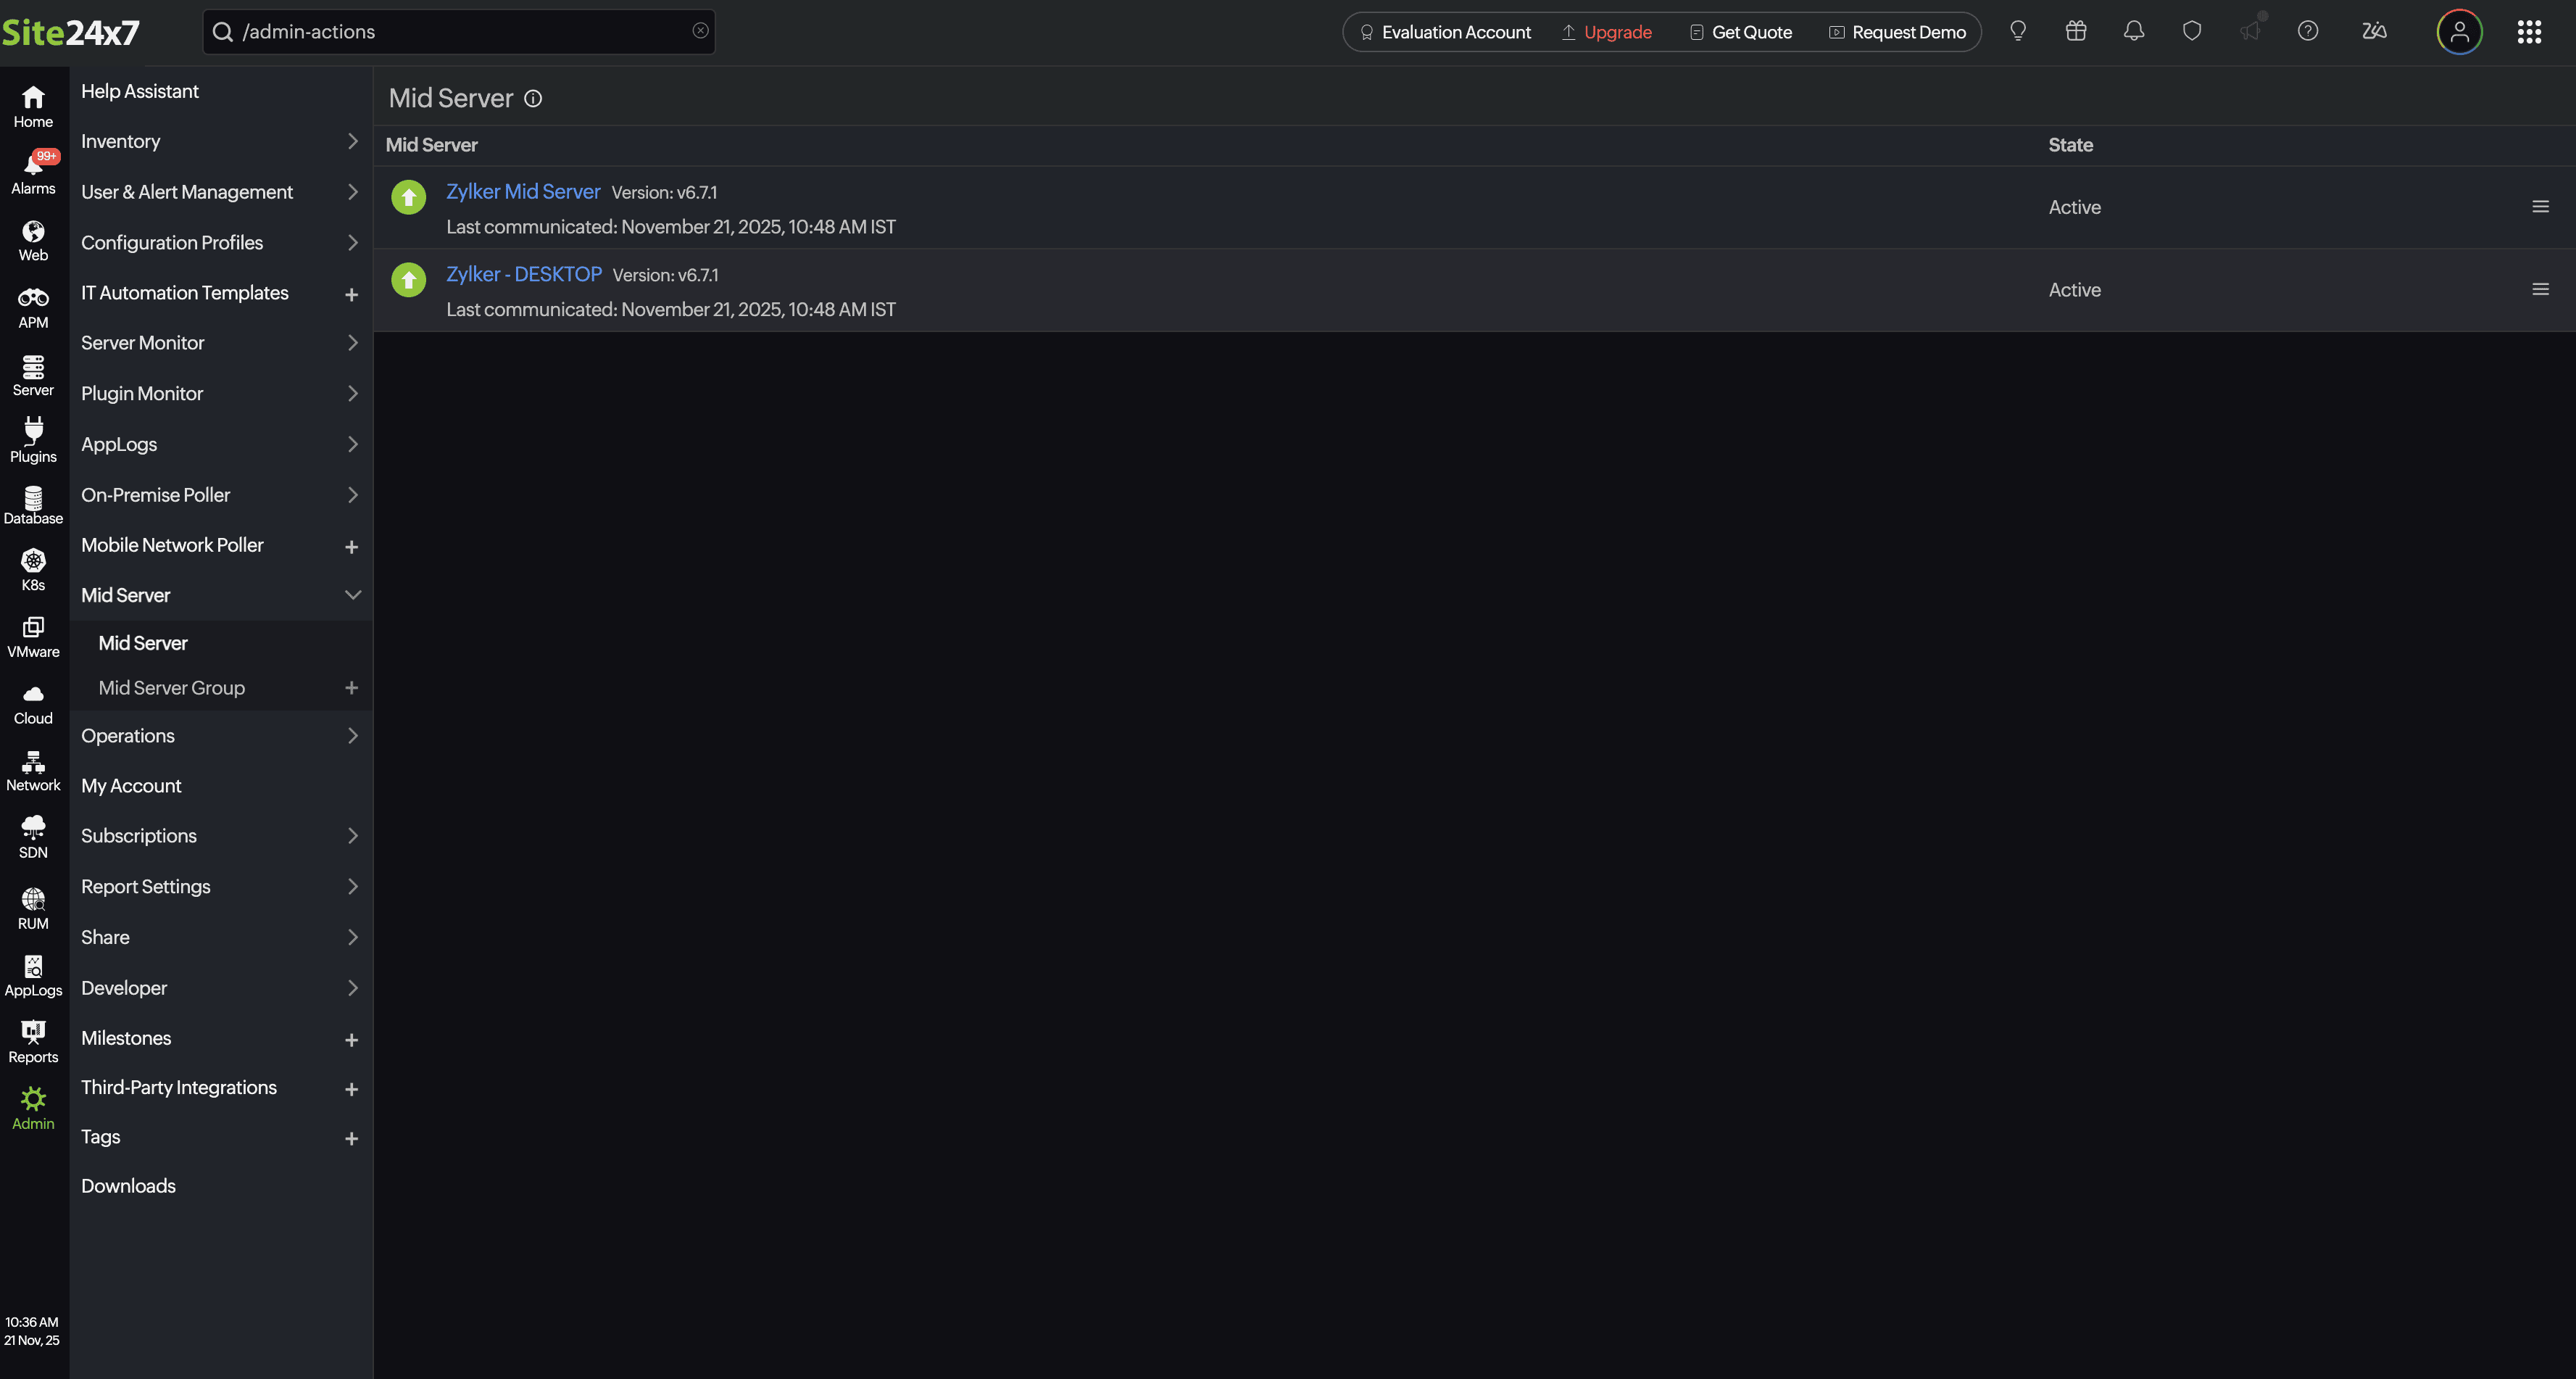
To access the added Mid-server:
-
Navigate to Admin > Mid-server > Mid-server.

-
Click the added Mid-server's name to view the metrics.

Summary
| Metrics | Description | Units |
|---|---|---|
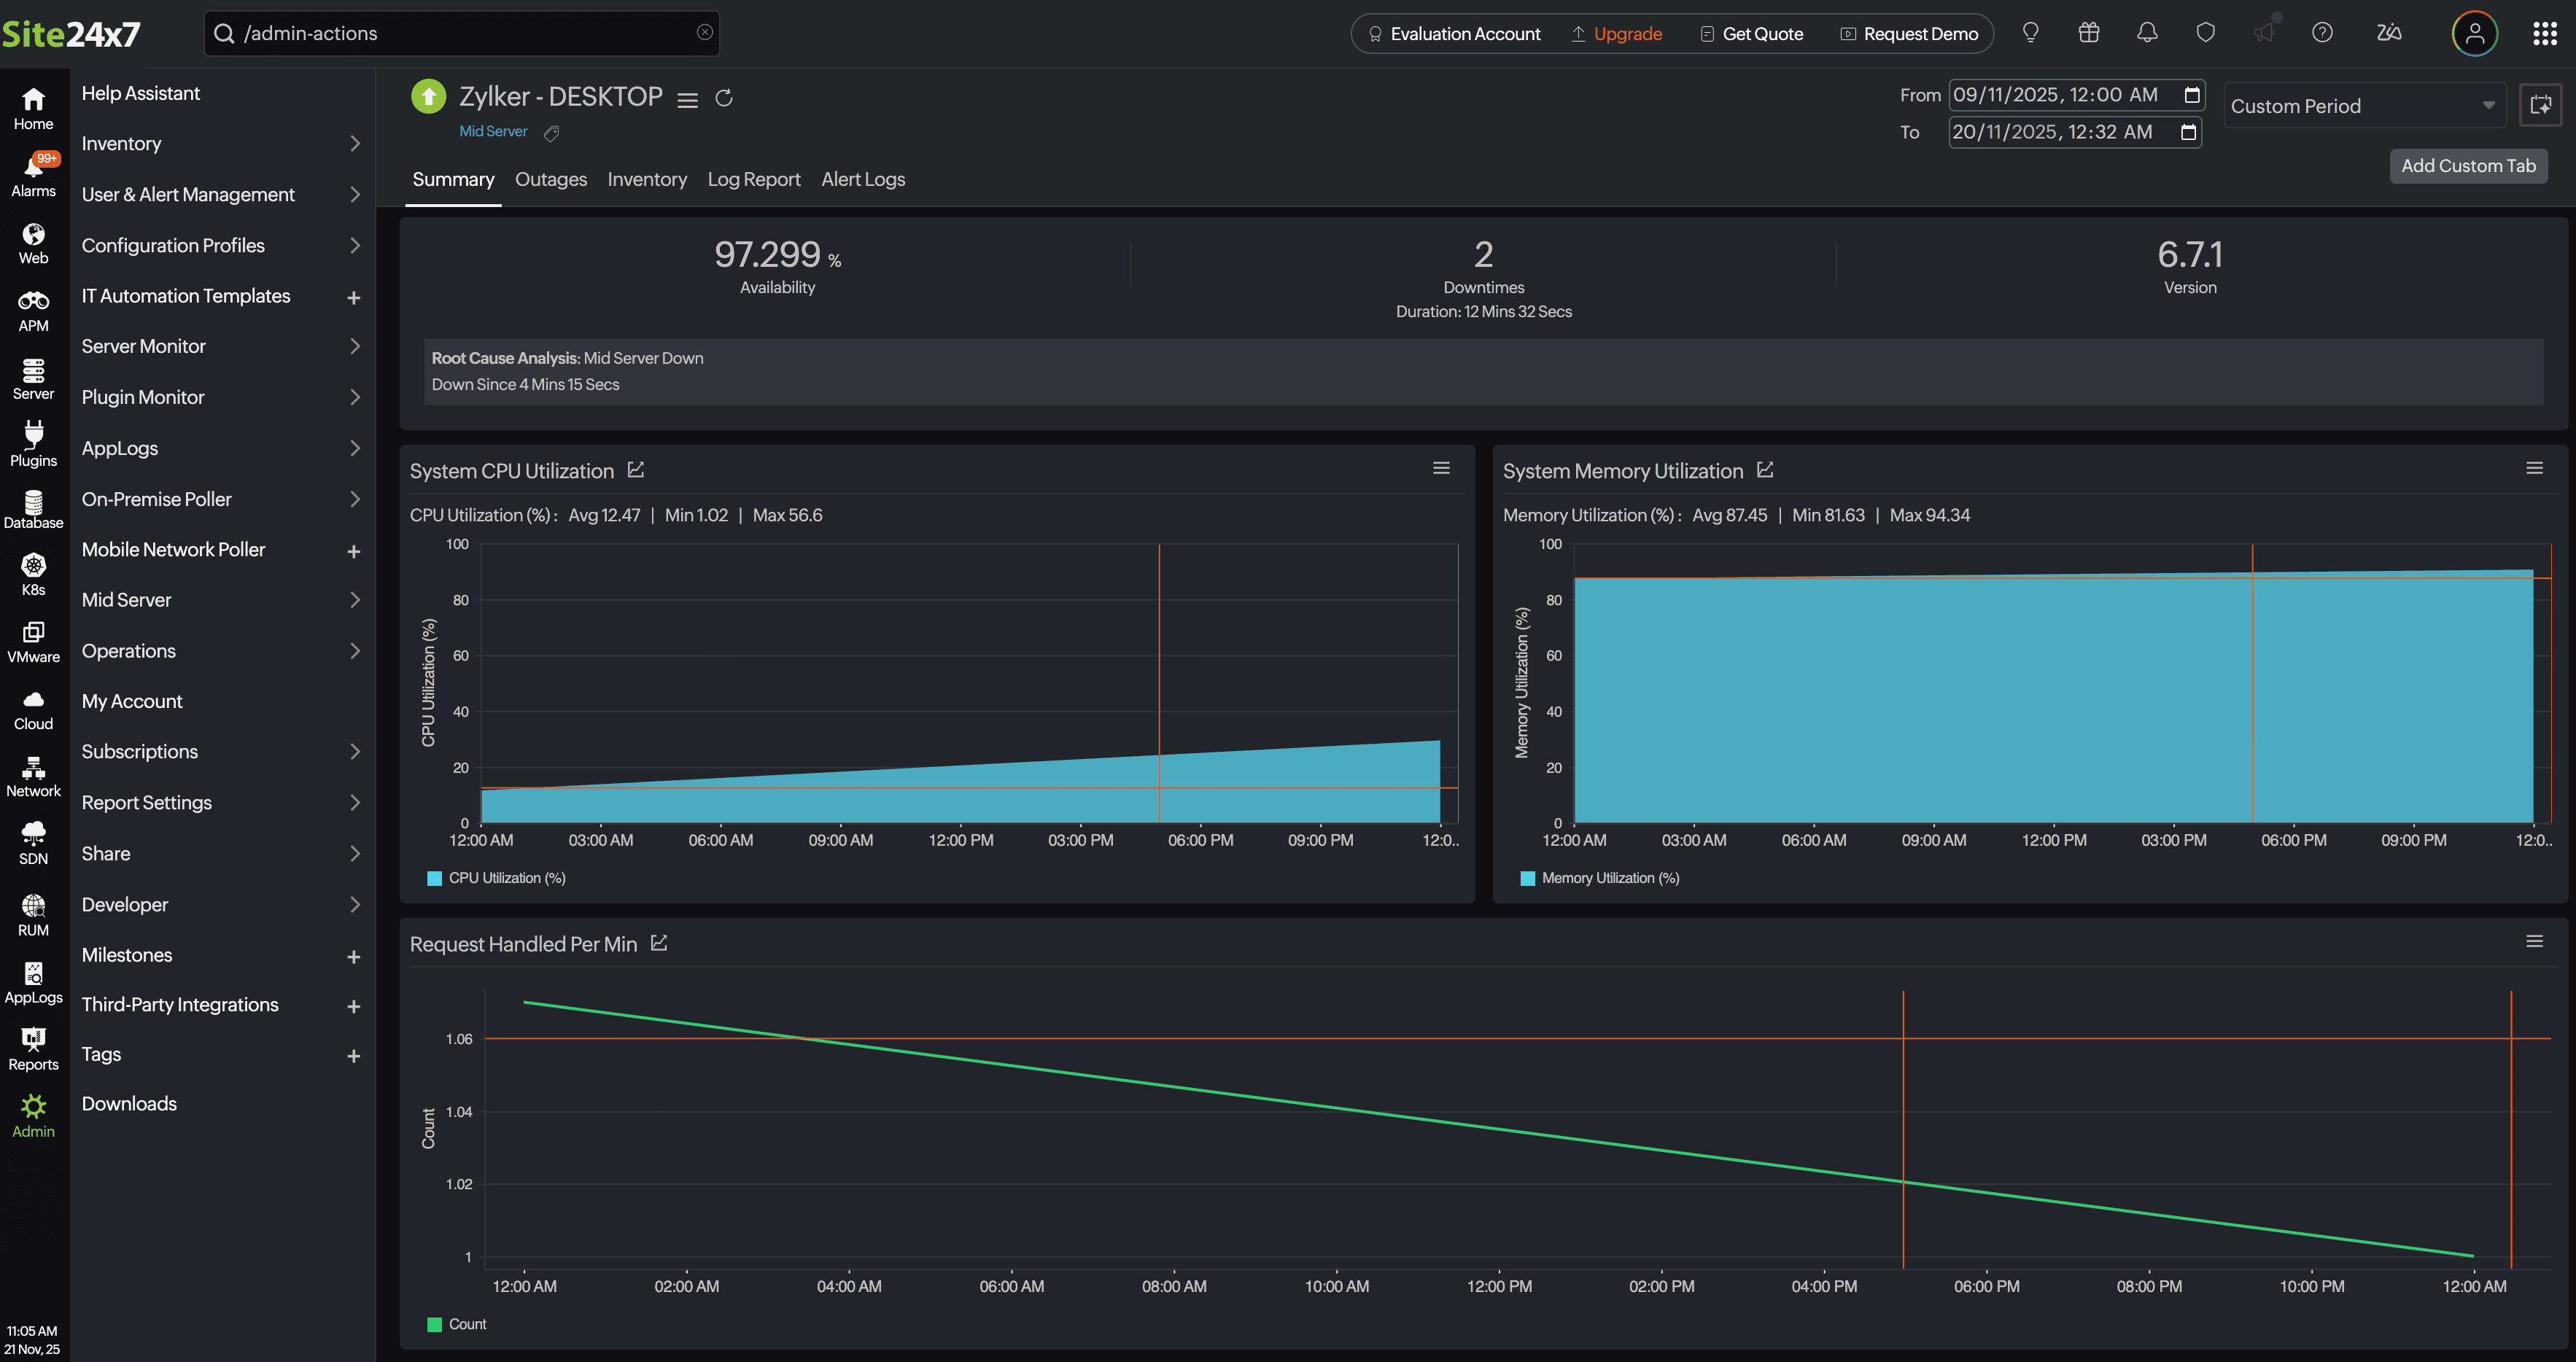
| System CPU Utilization | Displays the graphical view of CPU usage over time. Identifies performance spikes and potential resource bottlenecks | Percentage |
| System Memory Utilization | Displays memory usage in real time. Identifies performance degradation and assists in monitoring memory workloads | Percentage |
| Requests per Minute Handled | Displays the number of requests processed each minute. Helps to identify traffic patterns and server workloads | Count |
Performance metrics of Mid-server Group
Mid-server Group's performance metrics provide insights into the operational efficiency, availability, and workload distribution of all Mid-servers within a group. These metrics help administrators monitor the health and performance of the Mid-server infrastructure, identify potential bottlenecks, and ensure optimal communication between the Site24x7 agents and the Site24x7 cloud platform.
To access the added Mid-server Group:
-
Navigate to Admin > Mid-server Group > Mid-server Group.
-
Choose the Mid-server Group name to view the metrics.

Summary
| Metrics | Description | Units |
|---|---|---|
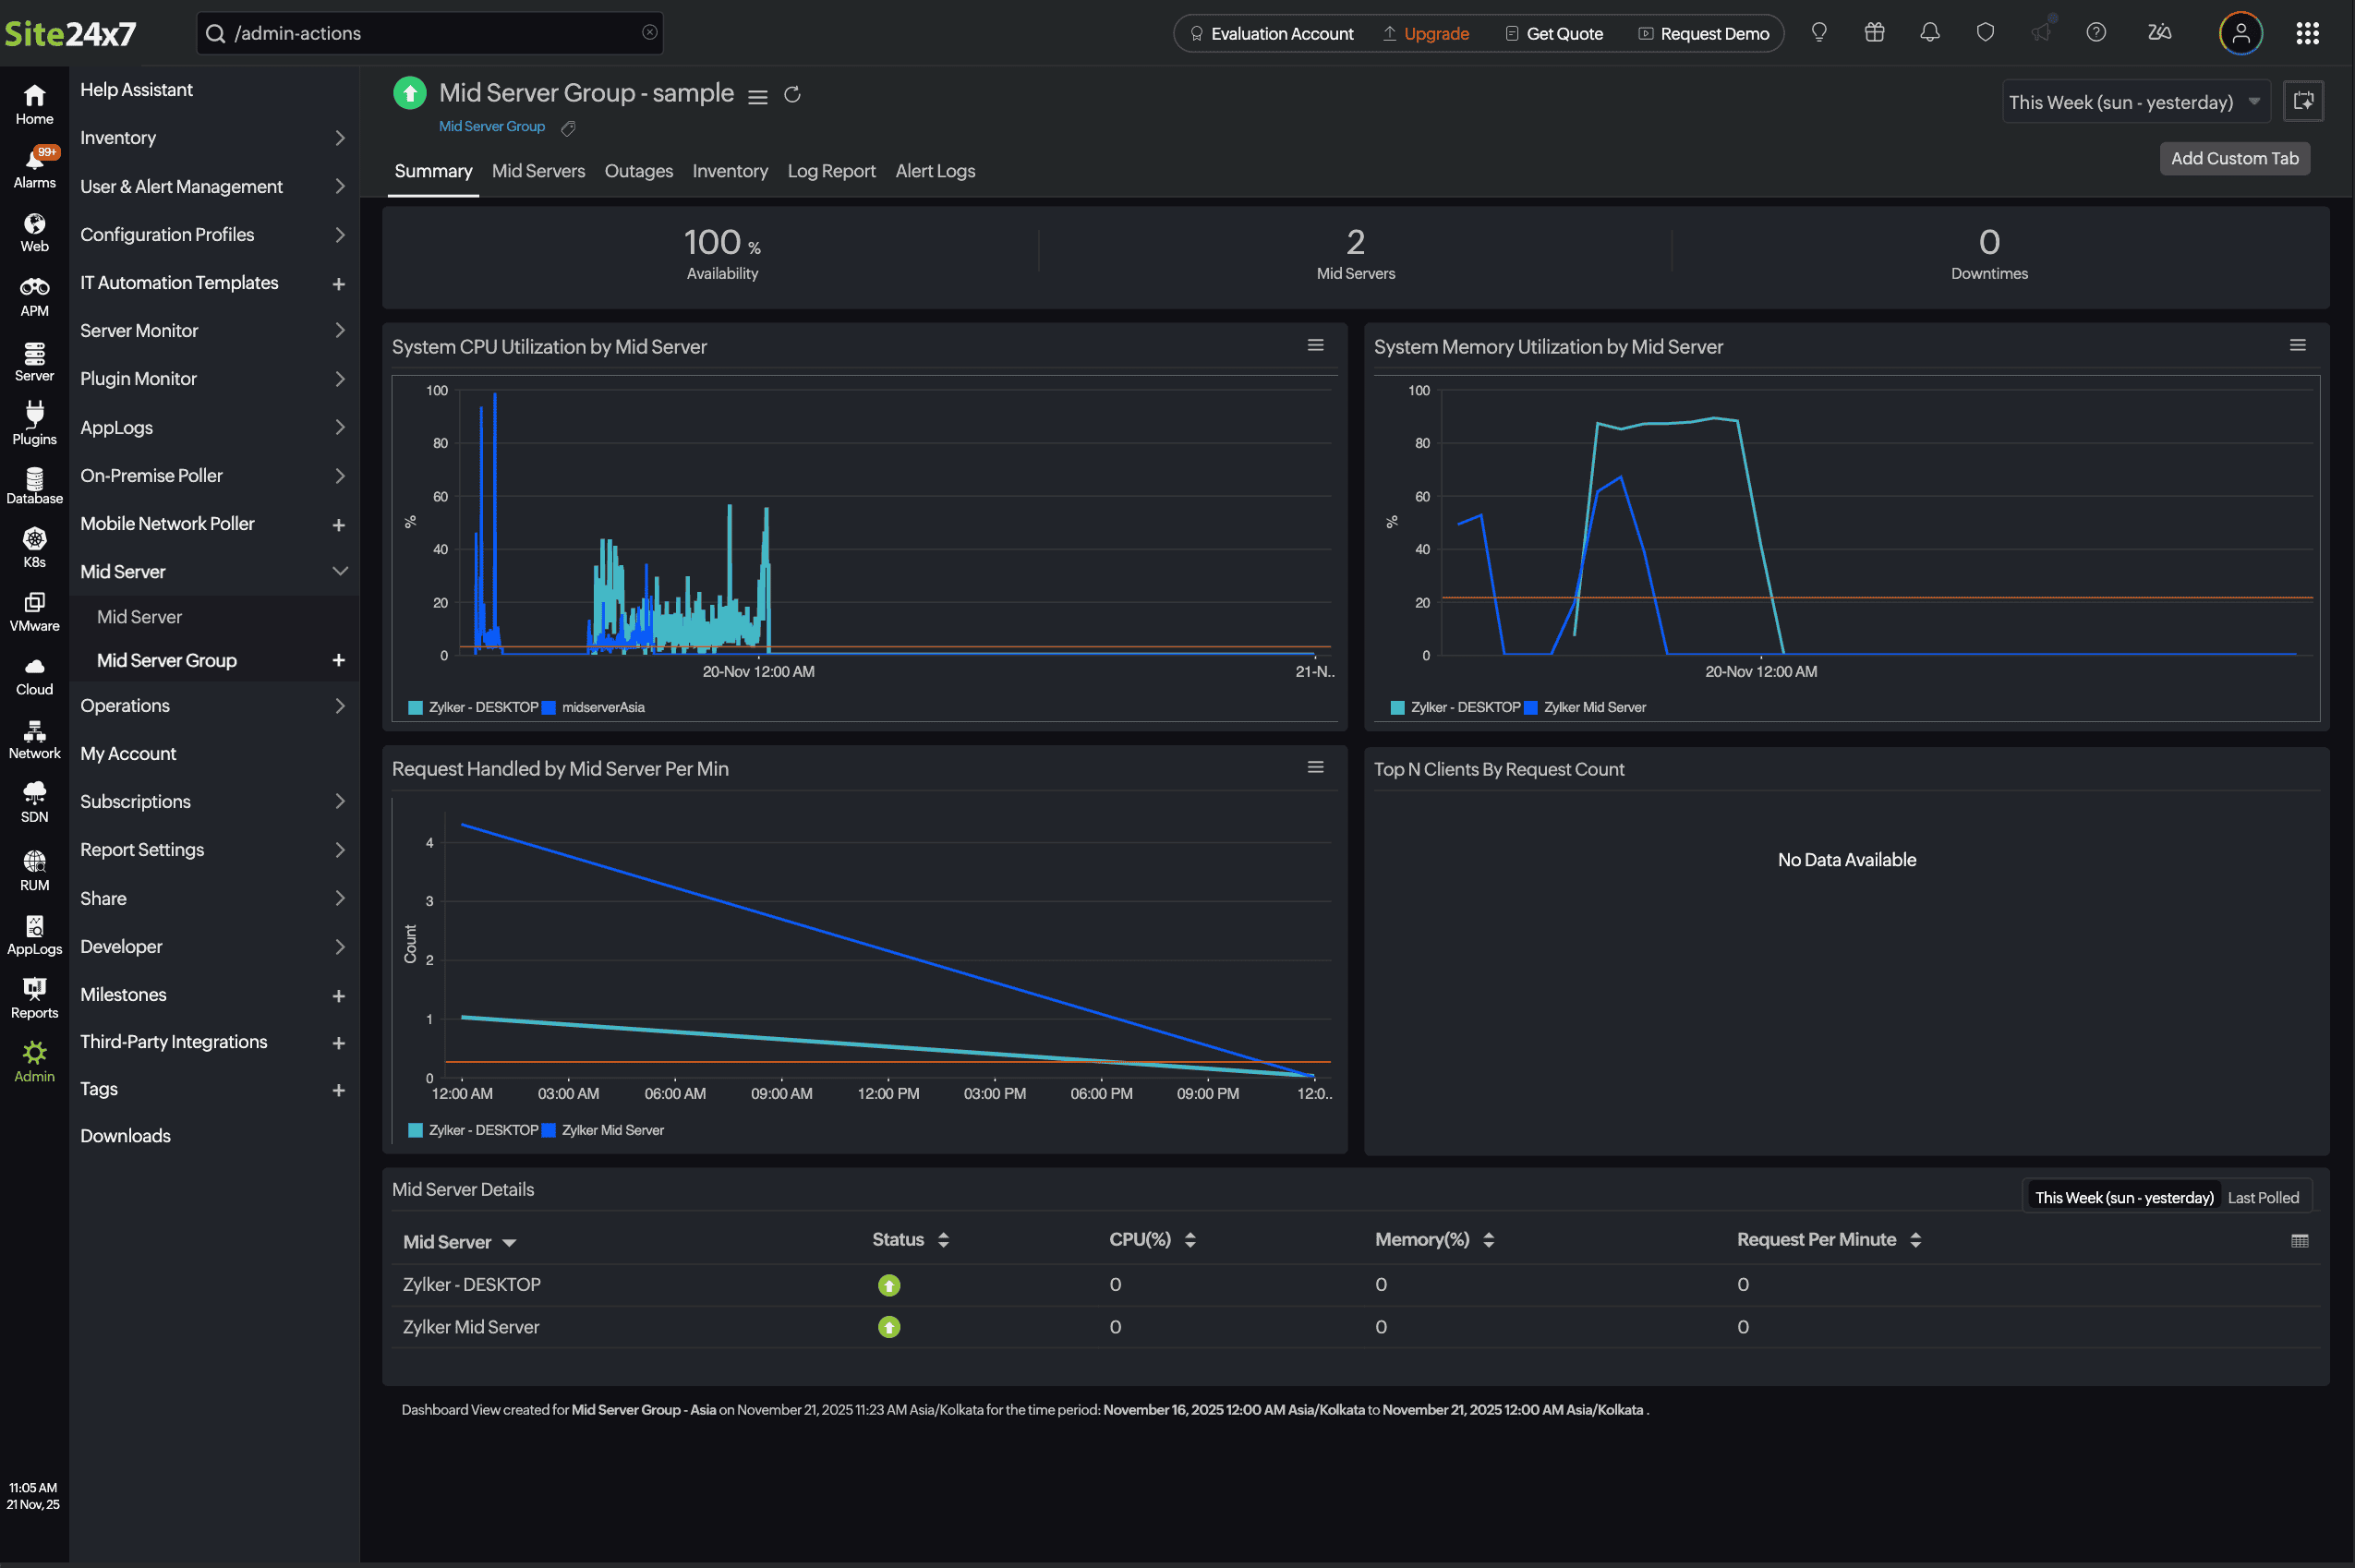
| System CPU Utilization by Mid-server | Displays the graphical view of CPU usage over time. Identifies performance spikes and potential resource bottlenecks | Percentage |
| System Memory Utilization by Mid-server | Displays memory usage in real time. Identifies performance degradation and assists in monitoring memory workloads | Percentage |
| Requests per Minute Handled by the Mid-server | Displays the number of requests processed each minute. Helps to identify traffic patterns and server workloads | Count |
Mid-server details
| Metrics | Description |
|---|---|
| Mid-server | Displays the name of the active Mid-server(s) |
| Status | Displays the status of the Mid-server (Up, Down, Critical) |
| CPU (%) | Displays the current CPU utilization as a percentage |
| Memory (%) | Displays the current memory utilization as a percentage |
| Requests per Minute | Displays the number of requests handled per minute by the Mid-server |
Mid-servers

Mid-servers Details
| Metrics | Description |
|---|---|
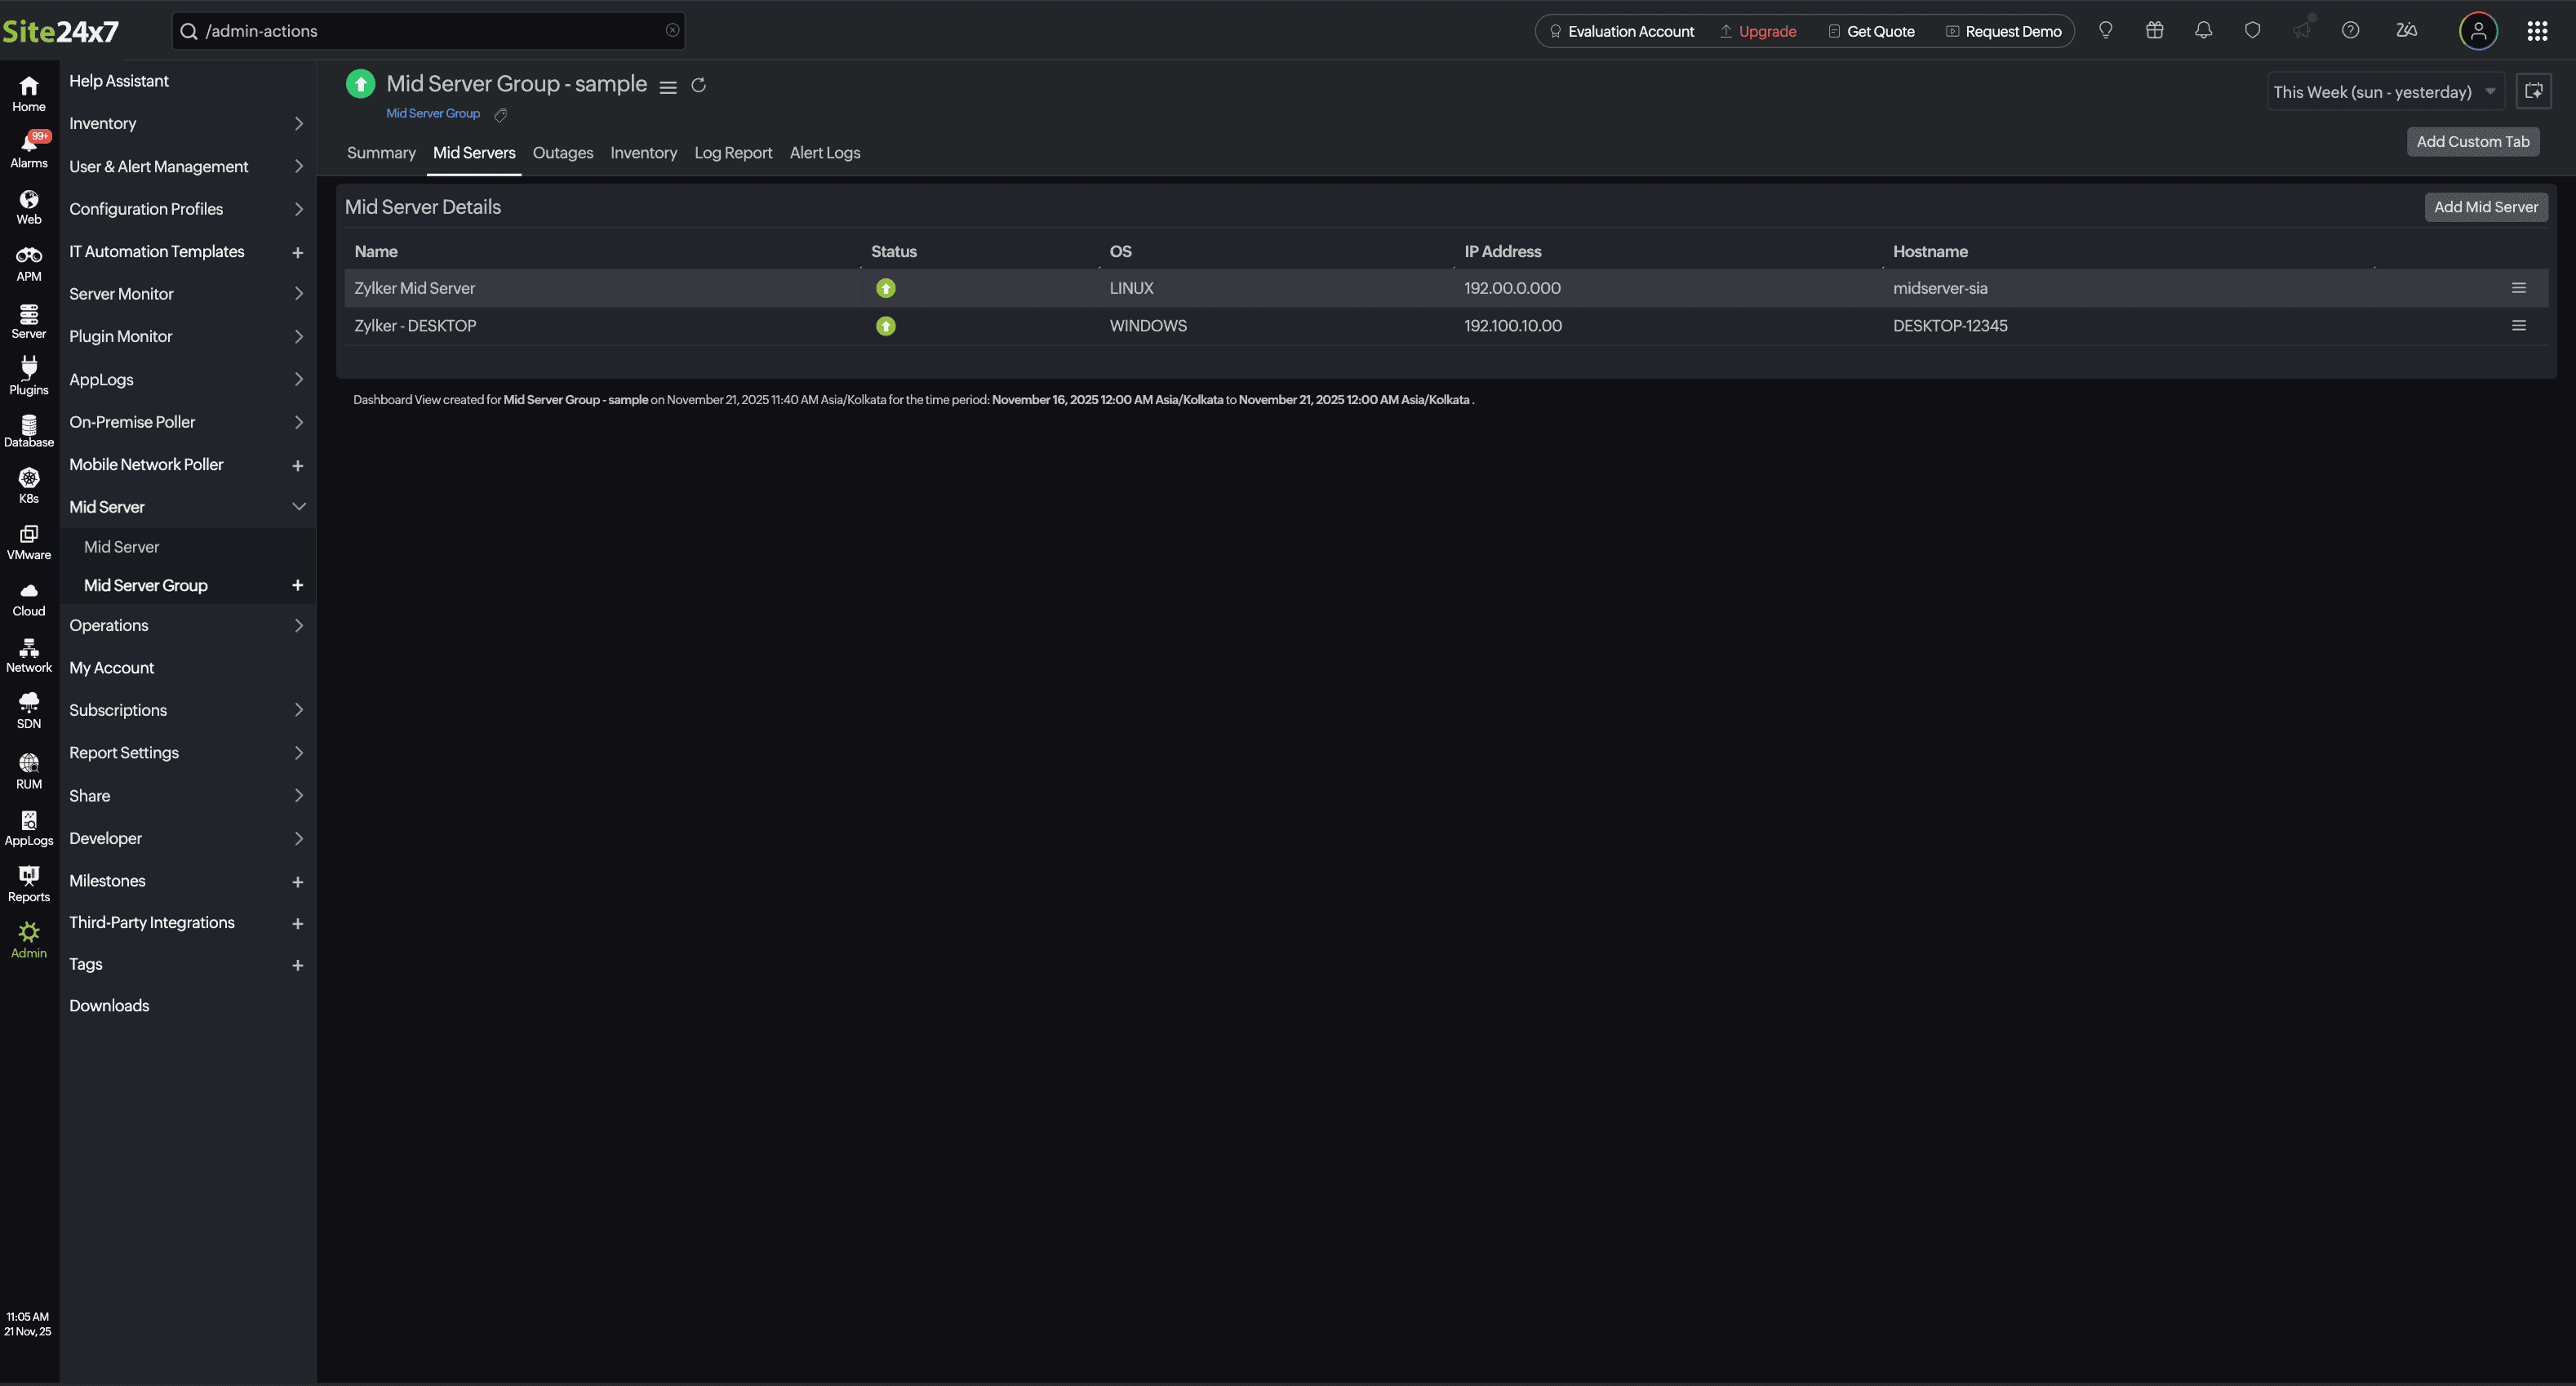
| Name | Displays the name of the active Mid-server(s) |
| Status | Displays the status of the Mid-server (Up, Down, Critical) |
| OS | Displays the associated operating system |
| IP Address | Displays the IP address of the associated Mid-server |
| Hostname | Displays the name of the host assigned with the Mid-server |
