Create custom plugins with Zia
Site24x7 supports an easy way to build custom monitoring plugins with the help of Zia, Zoho's AI assistant, which can be integrated in Site24x7. This feature enables you to generate monitoring scripts in different languages (Python, Shell, PowerShell, VBScript, Batch, DLL) without writing them manually.
With this, you can quickly create plugins to monitor custom applications, services, or metrics that aren’t natively supported by Site24x7.
Use cases
- Custom app monitoring: Track metrics from any application.
- Operating system metrics: Monitor Linux/Windows system stats, services, logs, network usage, and cron job execution.
- Databases: Track performance and availability across RDBMS, NoSQL, and NewSQL databases.
- Cloud services: Monitor platforms like AWS, Azure, GCP, OCI, Alibaba, DigitalOcean, Linode/Akamai Cloud, IBM, VMware, Salesforce, and SAP.
- Applications: Gain insights into web, desktop, cloud, and hybrid applications.
- APIs and endpoints: Monitor REST, SOAP, and GraphQL APIs or any HTTP endpoint.
- Service and log checks: Keep tabs on service uptime or capture specific error events.
- IoT and edge devices: Gather custom metrics from devices or sensors not natively supported.
Integrate Zia with Site24x7
Follow the steps mentioned in this help doc to integrate Zia with Site24x7 and get started with creating custom plugin scripts.
Create a plugin with Zia
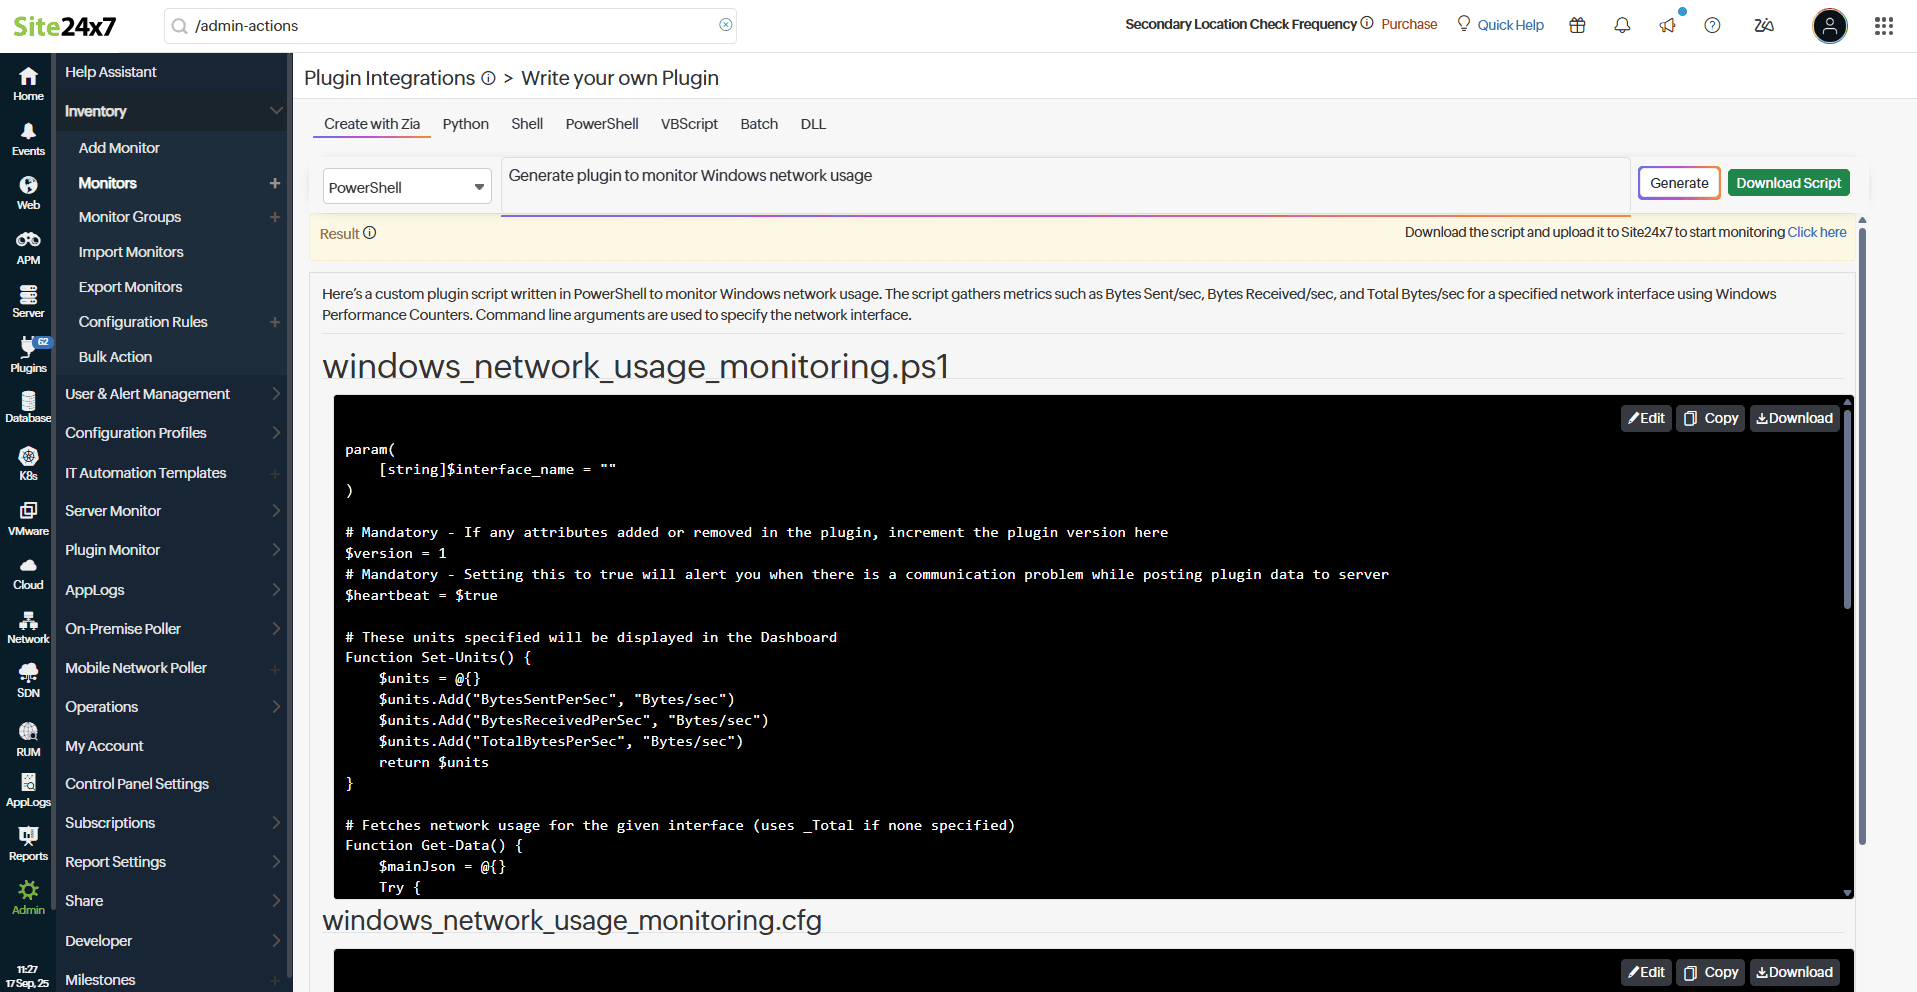
- Navigate to Plugins > Custom Monitoring and select the Create with Zia tab.
- From the dropdown, choose a scripting language such as Python, PowerShell, Shell, VBScript, Batch, or DLL.
- In the input box, describe the plugin you want in plain English. For example, type Generate a plugin to monitor Windows network usage.
- Click Generate. Zia will create a script tailored to your request.
In the example below, Zia generates a PowerShell script (windows_network_usage_monitoring.ps1) that collects metrics such as:- Bytes sent/sec
- Bytes received/sec
- Packets sent/sec
- Packets received/sec
Alongside the script, a configuration file (windows_network_usage_monitoring.cfg) is also created. This enables you to specify the network interface name in the example below.

- Download the generated script and review in an editor of your choice. Make any changes necessary.
- Check for any dependencies. For this example, no external dependencies are required—the script uses built-in PowerShell cmdlets.
- Ensure both the plugin file and the .cfg file are named the same (for example, windows_network_usage_monitoring.ps1 and windows_network_usage_monitoring.cfg)
- Run the plugin script locally to confirm it works. For example, run the following command to test the above generated script:
powershell .\windows_network_usage_monitoring.ps1 -InterfaceName "Ethernet"
- Place the plugin script and .cfg files inside a folder named after the plugin (for example, windows_network_usage_monitoring), then compress the folder into a ZIP file.
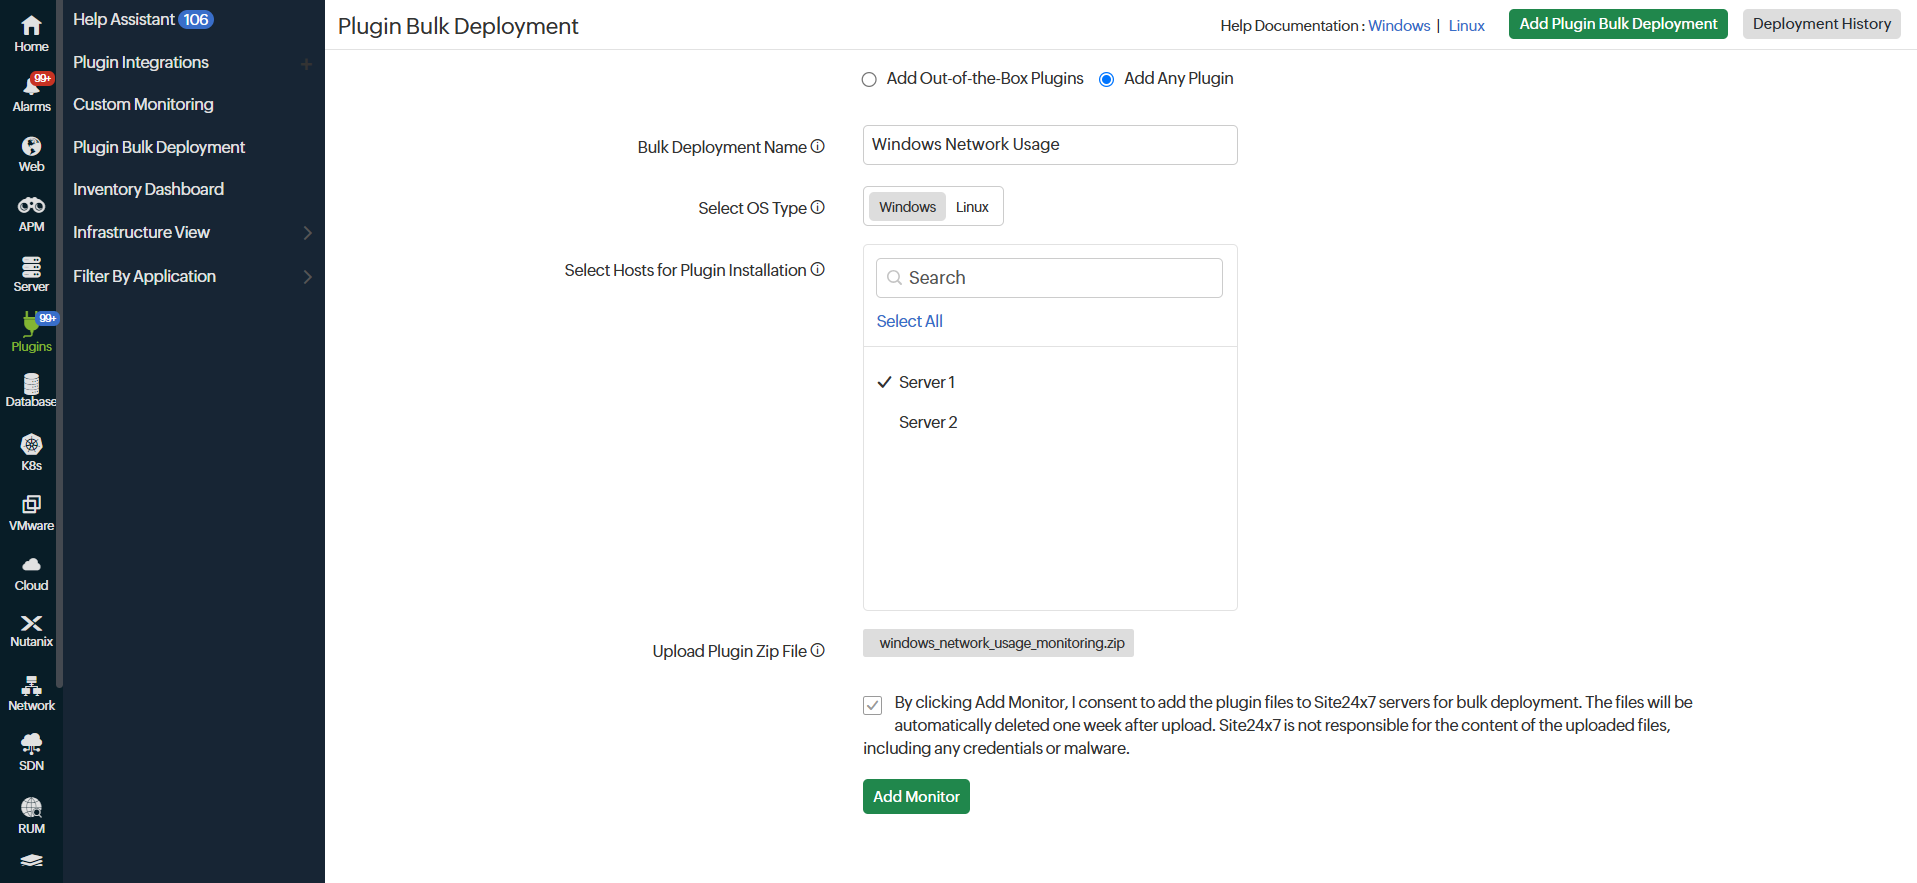
- In the web client, go to Plugins > Plugin Bulk Deployment, and choose the Add Any Plugin option.
- Enter a name for your deployment, select the target servers, upload the zipped plugin folder, and click Add Monitor to complete the setup.

- The agent will automatically execute the plugin within five minutes and display performance data in Site24x7.
To view the plugin monitor and associated performance charts:
- Log in to Site24x7.
- Navigate to respective server monitor and click the required plugin.
