Monitor Commvault Command Center
Commvault backup monitoring for Commvault environment empowers organizations by providing deep visibility and control over their data protection operations, across both on-premises and cloud infrastructures.
By leveraging Commvault's comprehensive backup and recovery capabilities integrated with Site24x7 monitoring tools, you can track job-level metrics and gain a deeper understanding of backup server health from the performance metrics that enable better management and swift issue resolution.
Prerequisites
- Install the latest version of the Site24x7 On-Premise Poller to ensure efficient data collection.
- Verify the network connectivity between the On-Premise Poller host and the server in the Commvault environment that executes the Commvault Command Center appliance. Ensure that the system where the On-Premise Poller is installed can be reached.
- Configure the Commvault server to accept inbound HTTPS traffic on the specified port. Ensure that this port on the Commvault Command Center server is set to receive inbound HTTPS requests. This port information should be provided during the monitor configuration process.
- Assign either the Portal Administrator role or a custom role with full REST API access and read permissions to the Commvault Command Center user account that will be configured in the Site24x7 environment. This can facilitate data collection without restrictions.
Ensure that your On-Premise Poller is active before proceeding to add a monitor.
Steps to add a Commvault Command Center monitor
- Login to Site24x7. Follow any of these paths. Each path leads to the same configuration page where you can set up monitoring for your Veeam Azure Appliance:
-
Click Admin > Inventory > Add Monitor > Commvault Command Center.
-
Select Server > Backup Monitoring > Commvault Command Center (+) from the left panel.
-
Alternatively, navigate to Home > Monitors (+) > Commvault Command Center.
-
-
Choose your On-Premise Poller name, then click Next.
-
Click the Add Commvault Command Center button.
-
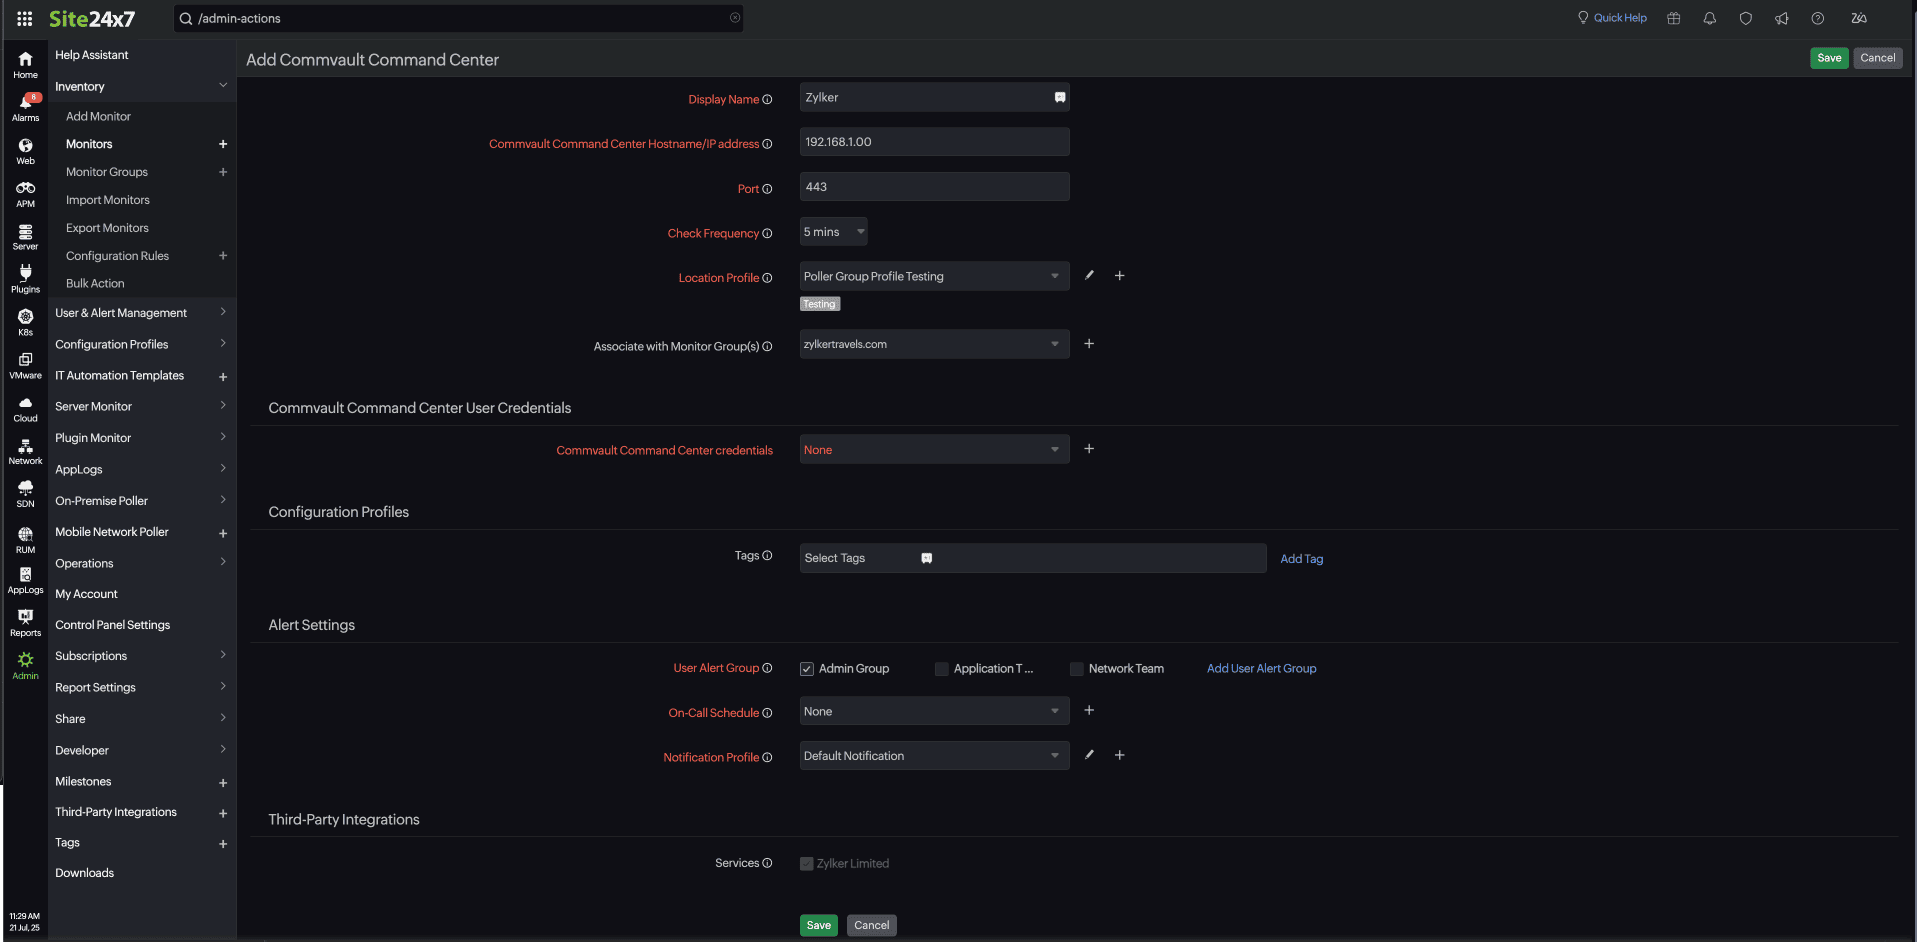
Provide the following details to configure the Commvault Command Center monitor:
-
Display Name: Set a display name to easily identify the Commvault Command Center monitor.
-
Commvault Command Center Hostname/IP Address: Enter the IP address or domain name of the Commvault Command Center host.
-
Port: The default API port is 443. Specify the designated port number for the managed host.
-
Check Frequency: Select the desired polling frequency from the available options in the drop-down list.
-
Location Profile: Pick the location profile from the drop-down list to determine where the Commvault Command Center will be monitored from.
-
Associate with Monitor Group(s): Select a Monitor Group from the drop-down list to logically organize your monitors.
-
-
Commvault Command Center User Credentials: Choose the appropriate credentials from the Site24x7 Credential Profile or add new ones.
-
Specify the Configuration Profile details:
- Tags: Associate your monitor with predefined tags to organize and manage your monitors efficiently. Learn how to add tags.
-
Specify the Alert Settings details:
-
User Alert Group: Select the user group that needs to be alerted during an outage.
-
Check the boxes besides the required groups to include them in for alerts; below are the available options:
-
Admin Group (checked)
-
Application Team
-
Network Team
-
Add User Alert Group: You can add multiple users to a group.
-
On-Call Schedule: Choose an On-Call Schedule from the drop-down list to stay updated via notifications in case of any incident or outage. Learn how to use an On-Call Schedule.
-
Notification Profile: Choose a Notification Profile from the drop-down list or select an available default profile. A Notification Profile helps to configure when and who gets notified in case of downtime
-
Third-party Integrations: Associate your monitor with a preconfigured third-party service. This will let you push your monitor alarms to selected services and facilitate improved incident management. If you haven't set up any integrations yet, navigate to Admin > Third Party Integration.
-
Click Save.

Upon completing these steps, the Commvault Command Center monitor will be successfully added to Site24x7.
