Network Devices
Monitor routers, switches, switch stacks, firewalls, load balancers, printers, storage devices, wireless LAN controllers, and other devices in your network with Site24x7's network monitoring. Obtain real-time availability stats with one-minute status polls, and stay on top of your network's performance by using our performance counters.
Network Devices view
- Log in to your Site24x7 account.
- Navigate to Network > Network Devices.
- In this dashboard, you can view the device status based on the most recent poll—including details such as Response Time (ms), Packet Loss (%) and Active Interfaces—as well as track any in-progress device discovery.
- Add new devices by clicking the plus
 icon beside Network Devices on the left pane (Figure 1, marked as 1).
Devices are listed with colored icons. Statuses are displayed as:
| Status | Color |
| Up | Green |
| Down | Red |
| Trouble | Yellow |
| Configuration Error | Blue |
| Discovery in Progress | Dark gray |
| Maintenance | Lilac |
| Suspended | Light gray |
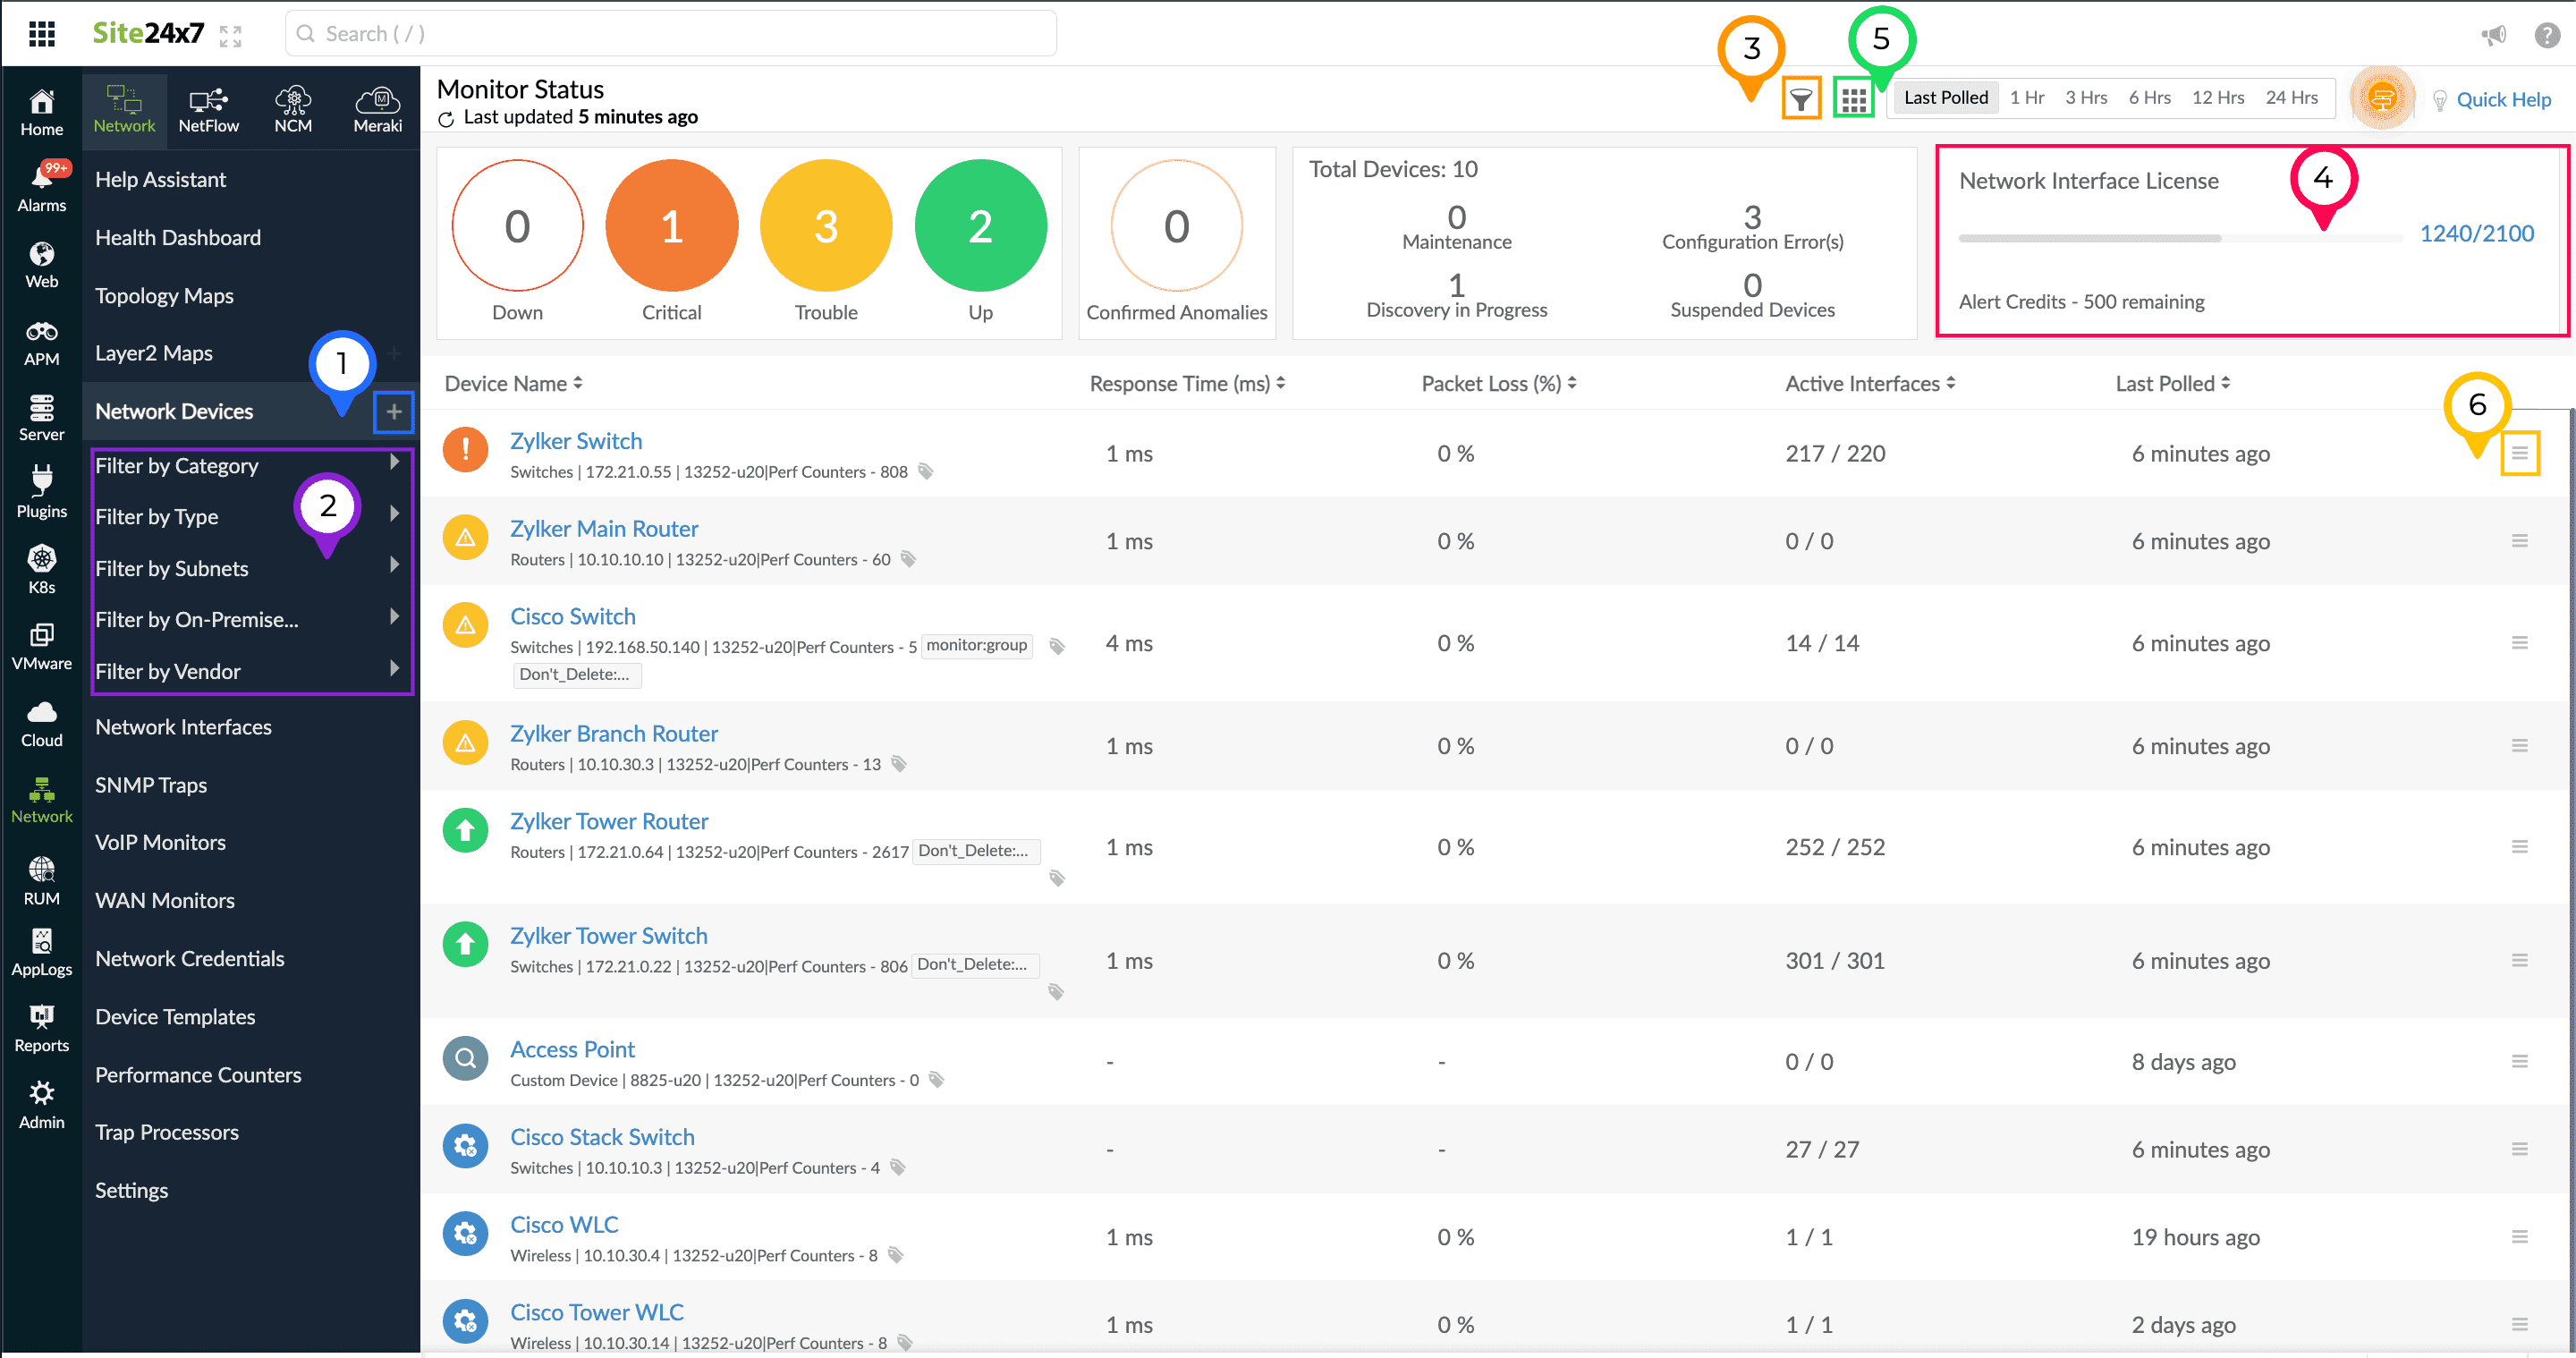
Figure 1. Viewing Network Devices.
On this page, you can filter your devices based on Category, Type, Subnet, On-Premise Poller, and Vendor (Figure 1, marked as 2). You can also filter based on associated tags and monitor groups by clicking the filter ![]() icon, located to the left of the Last Polled selector in the top-right corner (Figure 1, marked as 3).
icon, located to the left of the Last Polled selector in the top-right corner (Figure 1, marked as 3).
View the number of monitored interfaces as well as any remaining alert credits according to your license in the Network Interface License section (Figure 1, marked as 4). You can also pull up the NOC view from this page (Figure 1, marked as 5).
Click the hamburger ![]() icon next to a network device (Figure 1, marked as 6) to perform the following functions:
icon next to a network device (Figure 1, marked as 6) to perform the following functions:
- Edit: Edit the device configurations.
- Poll now: Run a poll to collect the latest values.
- Schedule maintenance: Schedule periodic maintenance for a specific period.
- Rediscover interfaces: Rediscover the interfaces of the device.
- Ping: Check the ping response of the device from the associated On-Premise Poller.
- View traceroute: Obtain the traceroute to the device from the associated On-Premise Poller.
- Resync device: Resync the device if polling has stopped.
- Add to Monitor Group: Choose an existing monitor group or create a new one. Monitors can be organized into monitor groups to ease administration.
- Suspend: Suspend the device.
- Delete: Delete the device.
Click a device to view different tabs such as Device Performance, Interfaces, Performance Counters, Tabular Performance Counters, Outages, Inventory, and Log Report. These tabs provide in-depth network device information.
Filter devices by Category, Type, Subnet, Vendor, and On-Premise Poller
- Navigate to Network > Network Devices.
- Below the Network Devices tab in the left pane, you will see options to filter devices by Category, Type, Subnet, Vendor, and On-Premise Poller (Figure 1, marked as 2).
- Select the filter that you require to view the devices that fit into that filter type.
- You can further filter the devices based on the status, tags, or monitor groups.
NOC view
Click the NOC ![]() icon next to the Last Polled selector on the Network Devices page to open the NOC view (Figure 1, marked as 5). This view displays each device as a color-coded tile.
icon next to the Last Polled selector on the Network Devices page to open the NOC view (Figure 1, marked as 5). This view displays each device as a color-coded tile.
Statuses are displayed as:
| Status | Color |
| Up | Green |
| Down | Red |
| Trouble | Yellow |
| Configuration Error | Blue |
| Discovery in Progress | Dark gray |
| Maintenance | Lilac |
| Suspended | Light gray |
You can filter the view based on these statuses. Every tile displays the device name and the reason for the current status.

Device Performance tab
Access details on a device's availability, response time, and downtime by clicking its name on the Network Devices page and viewing the first tab (Device Performance) that opens. Here, you can view widgets for Availability (%), Downtimes, Events Timeline, Updates, Response Time, Packet loss, CPU Utilization, Memory Utilization, Device Details, and Hardware Details.
If you have configured performance counters for CPU Utilization and Memory Utilization, you'll view that here. You can also configure the product to view Custom Monitoring Metrics by editing Device Templates.
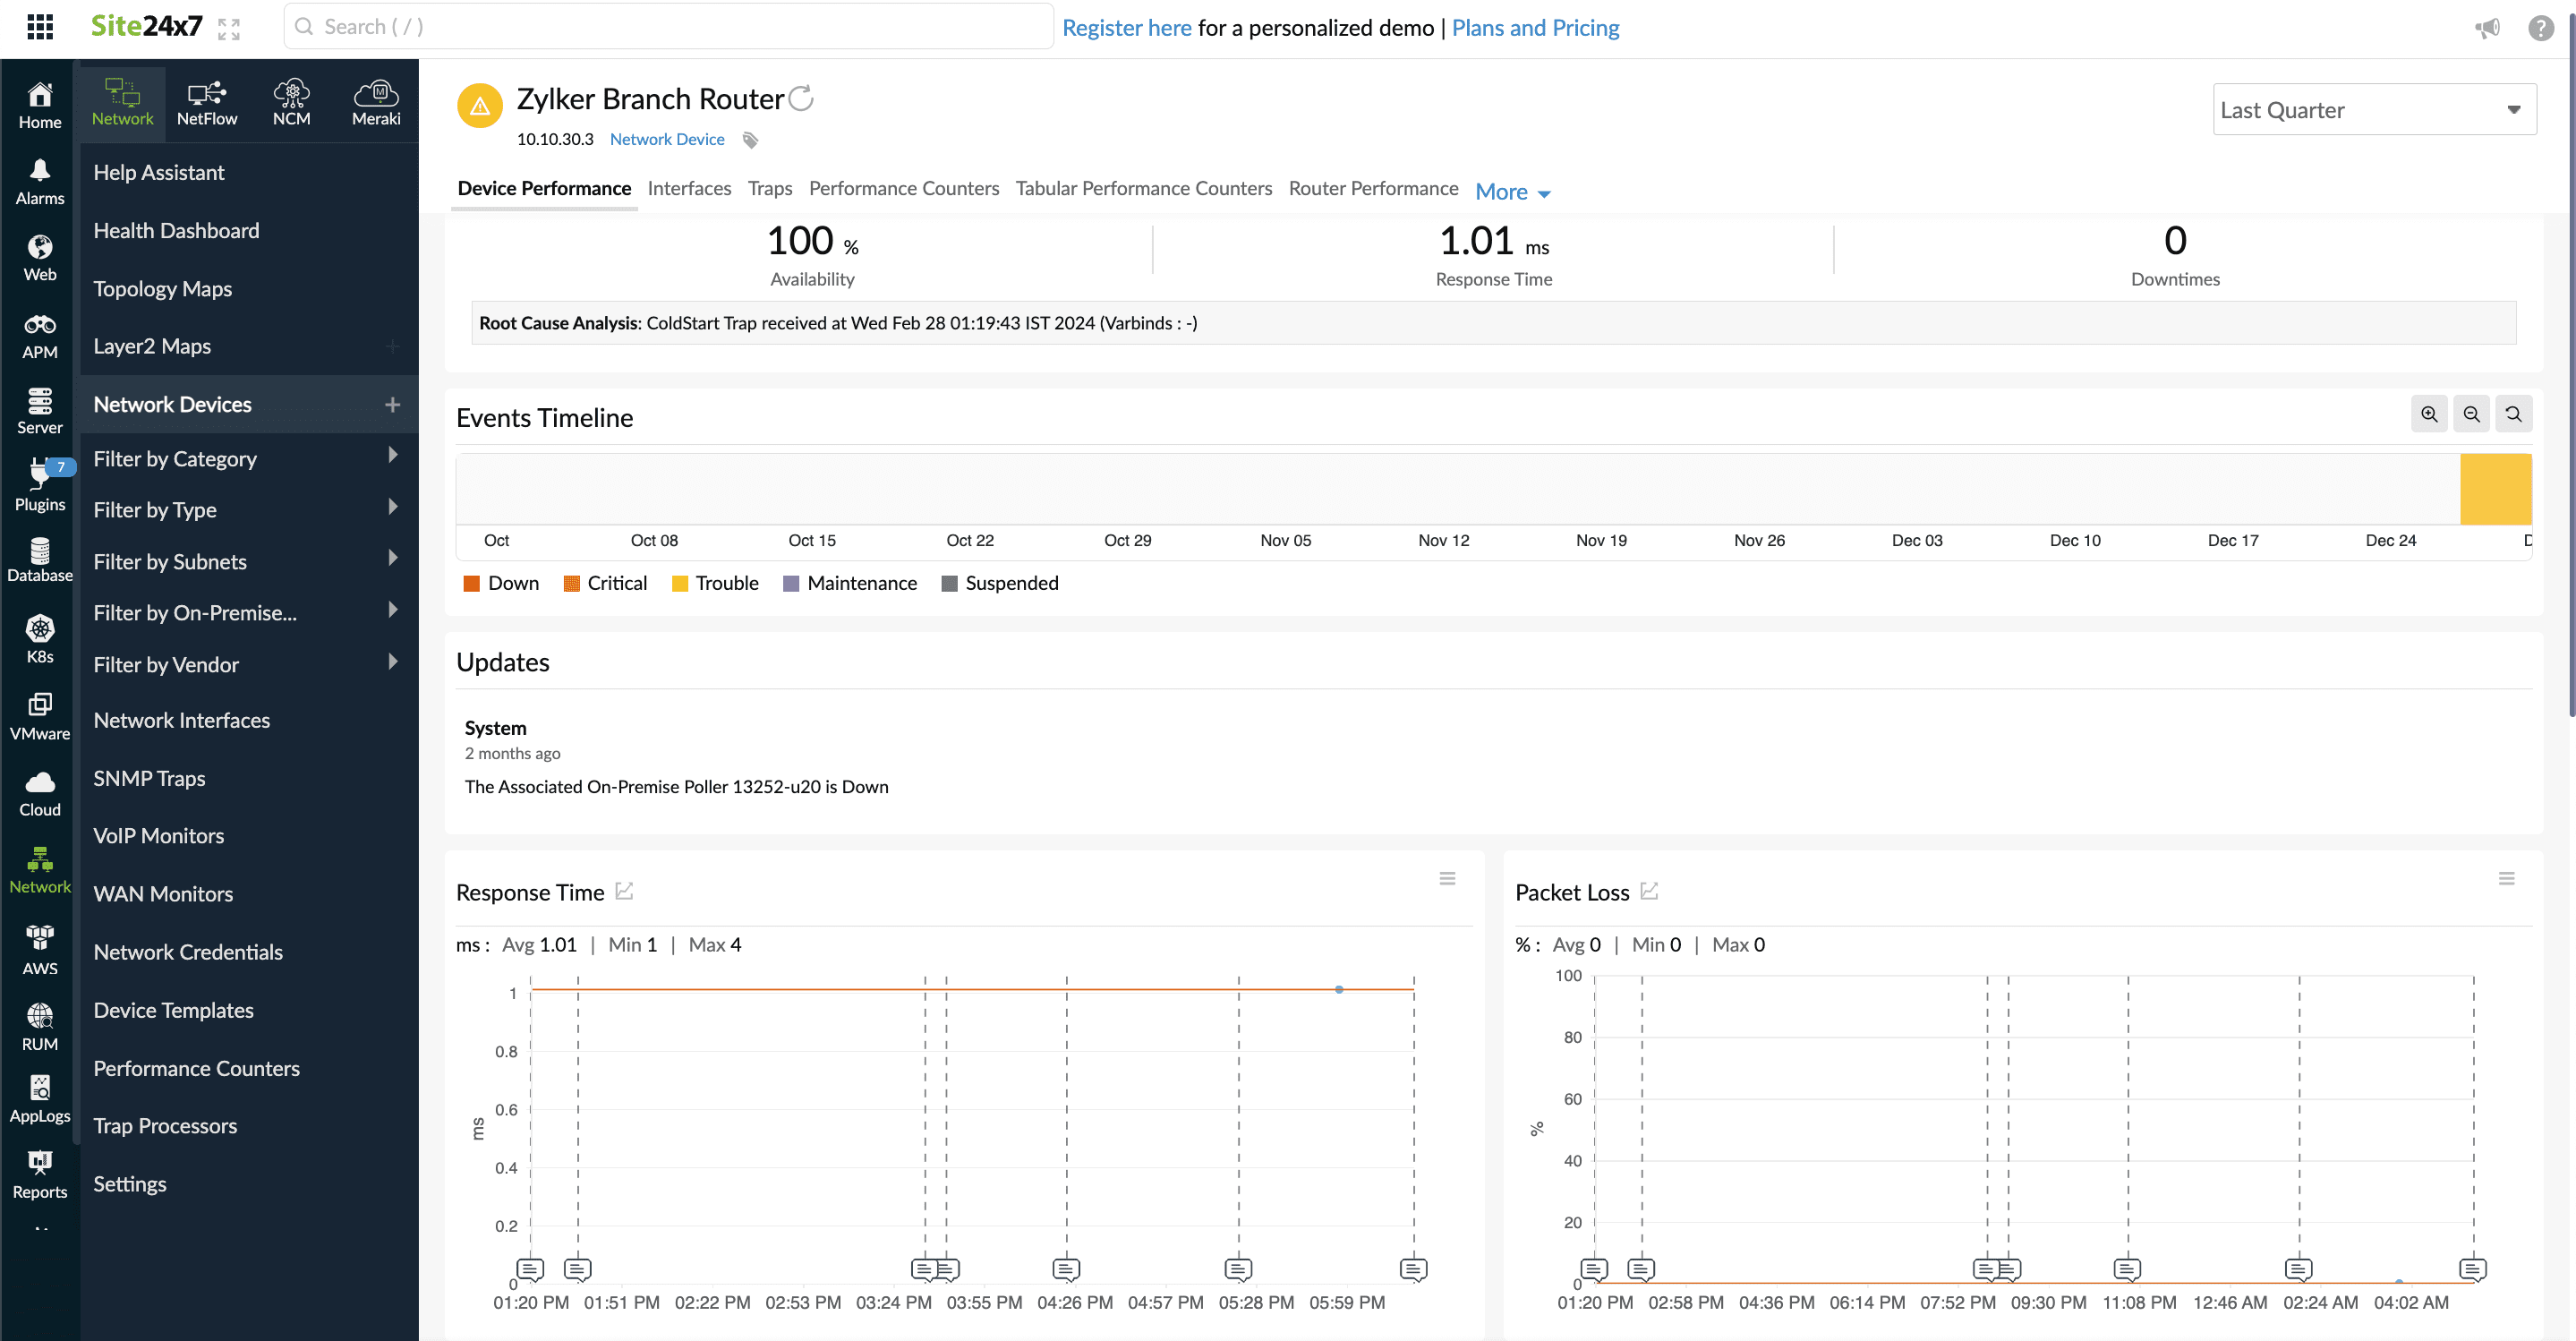
Figure 3. Device Performance view.
Device health
Get a clear picture of your network's performance, including stats on the top performing network devices, using our Network Health Dashboard.