Amazon Virtual Private Cloud monitoring integration
The Amazon Virtual Private Cloud is an AWS service that offers a virtual network which is secure and closely resembles a traditional network that you'd operate in your own data center, with the benefits of using the scalable infrastructure of AWS.
Site24x7's integration with Amazon Virtual Private Cloud enhances network visibility, allowing comprehensive monitoring and analysis of the network traffic within the Virtual Private Cloud environment.
The integration also provides the following seven monitors in addition to the Virtual Private Cloud monitor:
- VPC Region: Monitors the performance and health metrics across multiple Availability Zones within a specific AWS region.
- Availability Zone: This monitor tracks the metrics specific to each Availability Zone within a region. It helps to identify zone-specific issues, ensures fault tolerance, and aids in load balancing by distributing resources efficiently.
- VPC: Provides an overview of VPC-level metrics such as traffic flow, packet transmission, and resource utilization.
- Subnet: Monitors metrics at the subnet level, including traffic patterns, IP allocation, and network performance within individual subnets.
- Network Interface: Tracks metrics related to network interfaces, enabling visibility into their traffic, packet transmission, and resource utilization.
- Protocol: Monitors the performance of specific protocols used within the VPC, ensuring their proper functioning and identifying potential bottlenecks or security issues associated with different protocols.
- Route Table: Provides configuration details and tracks Route Table's availability.
Use case
Consider that you have an extensive Amazon Virtual Private Cloud setup with several interconnected subnets and security group. Monitoring a complex Virtual Private Cloud monitor can be challenging and increases the possibility of security risks.
By integrating your Virtual Private Cloud monitor with Site24x7, you can obtain deep visibility into your traffic flows, security configurations, and resource utilization. With the comprehensive monitoring by Site24x7, you can also efficiently manage your Virtual Private Cloud components, enhance the network performance, and proactively diagnose potential bottlenecks.
Benefits of the integration between Site24x7 and Amazon Virtual Private Cloud
You can leverage the following benefits with Site24x7's Amazon Virtual Private Cloud integration:
- Gain better understanding of your Virtual Private Cloud components such as regions, availability zones, subnets, network interfaces, and route tables.
- Obtain critical insights about metrics such as Traffic Volumes, Packet Counts, and Traffic Types and resource utilization details like available IPs and network interface counts.
- Analyze the network traffic within the Virtual Private Cloud environment and make informed decisions.
- Effectively manage Virtual Private Cloud resources by identifying the underutilized components.
- Configure thresholds and receive alerts for the affected resources.
Setup and configuration
- If you have not done so already, enable access to your AWS resources by creating a cross-account IAM role between your AWS account and Site24x7's AWS account. Learn more.
- On the Integrate AWS Account page, please make sure Virtual Private Cloud is selected in the Services to be discovered field. Learn more.
- Enable flow logs with Destination type as cloud-watch-logs in your AWS console, at the VPC, Subnet, or Network Interface level to monitor your VPC infrastructure.
Permissions
Ensure that Site24x7 receives the following permissions to monitor Amazon Virtual Private Cloud:
- "ec2:Describe*"
- "logs:Start*"
- "logs:Get*"
- "logs:Describe*"
Polling frequency
The metric data for Virtual Private Cloud monitoring is collected at a default poll frequency of fifteen minutes.
- The polling frequency set for the Virtual Private Cloud monitor is applicable for all its child monitors, as well.
- If the performance metrics collection is disabled or enabled for the Virtual Private Cloud monitor, the same setting will be applied to the child monitors as well.
Supported metrics
The supported metrics for the various monitors are provided below.
Virtual Private Cloud metrics
| Metric name | Description | Statistics | Unit |
|---|---|---|---|
|
Number of VPC Monitors in Available Status |
The total number of VPC monitors in Available status in the Amazon account. |
Sum |
Count |
|
Number of VPC Monitors in Trouble Status |
The total number of VPC monitors in Trouble status in the Amazon account. |
Sum |
Count |
|
Number of VPC Monitors in Critical Status |
The total number of VPC monitors in Critical status in the Amazon account. |
Sum |
Count
|
|
Number of Subnets in Available Status |
The total number of Subnet monitors in Available status in the Amazon account. |
Sum |
Count |
|
Number of Subnets in Trouble Status |
The total number of Subnet monitors in Trouble status in the Amazon account. |
Sum |
Count |
|
Number of Subnets in Critical Status |
The total number of Subnet monitors in Critical status in the Amazon account. |
Sum |
Count |
|
Number of Network Interfaces in Available Status |
The total number of Network Interface monitors in Available status in the Amazon account. |
Sum |
Count |
|
Number of Network Interfaces in Trouble Status |
The total number of Network Interface monitors in Trouble status in the Amazon account. |
Sum |
Count |
|
Number of Network Interfaces in Critical Status |
The total number of Network Interface monitors in Critical status in the Amazon account. |
Sum |
Count |
|
Number of Regional Monitors in Available Status |
The total number of Regional monitors in available status in the Amazon account. |
Sum |
Count |
|
Number of Regional Monitors in Trouble Status |
The total number of Regional monitors in trouble status in the Amazon account. |
Sum |
Count |
|
Number of Regional Monitors in Critical Status |
The total number of Regional monitors in critical status in the Amazon account. |
Sum |
Count |
|
Number of Availability Zone Monitors in Available Status |
The total number of Availability Zone monitors in available status in the Amazon account. |
Sum |
Count |
|
Number of Availability Zone Monitors in Trouble Status |
The total number of Availability Zone monitors in trouble status in the Amazon account. |
Sum |
Count |
|
Number of Availability Zone Monitors in Critical Status |
The total number of Availability Zone monitors in critical status in the Amazon account. |
Sum |
Count |
|
Number of Protocol Monitors in Available Status |
The total number of Protocol monitors in available status in the Amazon account. |
Sum |
Count |
|
Number of Protocol Monitors in Trouble Status |
The total number of Protocol monitors in trouble status in the Amazon account. |
Sum |
Count |
|
Number of Protocol Monitors in Critical Status |
The total number of Protocol monitors in critical status in the Amazon account. |
Sum |
Count |
|
Number of Route Table Monitors in Available Status |
The total number of Route Table monitors in available status in the Amazon account. |
Sum |
Count |
Region-level metrics
| Metric name | Description | Statistics | Unit |
|---|---|---|---|
|
Total Rx Volume |
The total amount of received (Rx) traffic volumes in a region. |
Sum |
Bytes |
|
Minimum Rx Volume |
The minimum amount of received traffic volume in a region. |
Minimum |
Bytes |
|
Maximum Rx Volume |
The maximum amount of received traffic volume in a region. |
Maximum |
Bytes |
|
Total Tx Volume |
The total amount of transmitted (Tx) traffic volumes in a region. |
Sum |
Bytes |
|
Minimum TxRx Volume |
The minimum amount of transmitted traffic volume in a region. |
Minimum |
Bytes |
|
Maximum Tx Volume |
The maximum amount of transmitted traffic volume in a region. |
Maximum |
Bytes |
|
Total Rx Packet |
The total number of received traffic packets in a region. |
Sum |
Count |
|
Minimum Rx Packet |
The minimum number of received traffic packets in a region. |
Minimum |
Count |
|
Maximum Rx Packet |
The maximum number of received traffic packets in a region. |
Maximum |
Count |
|
Total Tx Packet |
The total number of transmitted traffic packets in a region. |
Sum |
Count |
|
Minimum Tx Packet |
The number of minimum transmitted traffic packets in a region. |
Minimum |
Count |
|
Maximum Tx Packet |
The number of maximum transmitted traffic packets in a region. |
Maximum |
Count |
|
Average Rx Packet Size |
The average received packet size in a region. |
Average |
Bytes |
|
Average Tx Packet Size |
The average transmitted packet size in a region. |
Average |
Bytes |
|
Total Volume |
The total traffic volumes in a region. |
Sum |
Bytes |
|
Total Packet |
The total traffic packets in a region. |
Sum |
Count |
|
In Traffic |
The total incoming traffic throughput in a region. |
Sum |
bps |
|
Out Traffic |
The total outgoing traffic throughput in a region. |
Sum |
bps |
|
Total Traffic |
The total traffic throughput in a region. |
Sum |
bps |
|
Accepted Requests |
The total number of accepted requests in a region. |
Sum |
Count |
|
Rejected Requests |
The total number of rejected requests in a region. |
Sum |
Count |
|
Skipped Records |
The total number of skipped records in a region. |
Sum |
Count |
|
No data Records |
The total number of no data records in a region. |
Sum |
Count |
|
Number of Free IPs |
The total number of free IPs in a region. |
Sum |
Count |
|
Number of Network Interfaces |
The total number of network interfaces in a region. |
Sum |
Count |
|
Number of Subnets |
The total number of Subnets in a region. |
Sum |
Count |
|
Number of VPCs |
The total number of VPCs in a region. |
Sum |
Count |
Availability Zone-level metrics
| Metric name | Description | Statistics | Unit |
|---|---|---|---|
|
Metric name |
Description |
Statistic |
Unit |
|
Total Rx Volume |
The total amount of received traffic volumes in an availability zone. |
Sum |
Bytes |
|
Minimum Rx Volume |
The minimum amount of received traffic volume in an availability zone. |
Minimum |
Bytes |
|
Maximum Rx Volume |
The maximum amount of received traffic volume in an availability zone. |
Maximum |
Bytes |
|
Total Tx Volume |
The total amount of transmitted traffic volumes in an availability zone. |
Sum |
Bytes |
|
Minimum Tx Volume |
The minimum amount of transmitted traffic volume in an availability zone. |
Minimum |
Bytes |
|
Maximum Tx Volume |
The maximum amount of transmitted traffic volume in an availability zone. |
Maximum |
Bytes |
|
Total Rx Packet |
The total number of received traffic packets in an availability zone. |
Sum |
Count |
|
Minimum Rx Packet |
The minimum number of received traffic packets in an availability zone. |
Minimum |
Count |
|
Maximum Rx Packet
|
The maximum number of received traffic packets in an availability zone. |
Maximum |
Count |
|
Total Tx Packet |
The total number of outgoing traffic packets in an availability zone. |
Sum |
Count |
|
Minimum Tx Packet |
The minimum number of outgoing traffic packets in an availability zone. |
Minimum |
Count |
|
Maximum Tx Packet |
The maximum number of outgoing traffic packets in an availability zone. |
Maximum |
Count |
|
Average Rx Packet Size |
The average received packet size in an availability zone. |
Average |
Bytes |
|
Average Tx Packet Size |
The average transmitted packet size in an availability zone. |
Average |
Bytes |
|
Total Volume |
The total amount of traffic volumes in an availability zone. |
Sum |
Bytes |
|
Total Packet |
The total number of traffic packets in an availability zone. |
Sum |
Count |
|
In Traffic |
The total incoming traffic throughput in an availability zone. |
Sum |
bps |
|
Out Traffic |
The total outgoing traffic throughput in an availability zone. |
Sum |
bps |
|
Total Traffic |
The total traffic throughput in an availability zone. |
Sum |
bps |
|
Accepted Requests |
The total number of accepted requests in an availability zone. |
Sum |
Count |
|
Rejected Requests |
The total number of rejected requests in an availability zone. |
Sum |
Count |
|
Skipped Records |
The total number of skipped records in an availability zone. |
Sum |
Count |
|
No data Records |
The total number of no data records in an availability zone. |
Sum |
Count |
|
Number of Free IPs |
The total number of free IPs in an availability zone. |
Sum |
Count |
|
Number of Network Interfaces |
The total number of network interfaces in an availability zone. |
Sum |
Count |
|
Number of Subnets |
The total number of subnets in an availability zone. |
Sum |
Count |
VPC-level metrics
| Metric name | Description | Statistics | Unit |
|---|---|---|---|
|
Metric name |
Description |
Statistic |
Unit |
|
Total Rx Volume |
The total amount of received traffic volumes in a VPC. |
Sum |
Bytes |
|
Minimum Rx Volume |
The minimum amount of received traffic volume in a VPC. |
Minimum |
Bytes |
|
Maximum Rx Volume |
The maximum amount of received traffic volume in a VPC. |
Maximum |
Bytes |
|
Total Tx Volume |
The total amount of transmitted traffic volumes in a VPC. |
Sum |
Bytes |
|
Minimum TxRx Volume |
The minimum amount of transmitted traffic volume in a VPC. |
Minimum |
Bytes |
|
Maximum Tx Volume |
The maximum amount of transmitted traffic volume in a VPC. |
Maximum |
Bytes |
|
Total Rx Packet |
The total number of received traffic packets in a VPC. |
Sum |
Count |
|
Minimum Rx Packet |
The minimum number of received traffic packets in a VPC. |
Minimum |
Count |
|
Maximum Rx Packet |
The maximum number of received traffic packets in a VPC. |
Maximum |
Count |
|
Total Tx Packet |
The total number of transmitted traffic packets in a VPC. |
Sum |
Count |
|
Minimum Tx Packet |
The minimum number of transmitted traffic packets in a VPC. |
Minimum |
Count |
|
Maximum Tx Packet |
The maximum number of transmitted traffic packets in a VPC. |
Maximum |
Count |
|
Average Rx Packet Size |
The average received packet size in a VPC. |
Average |
Bytes |
|
Average Tx Packet Size |
The average transmitted packet size in a VPC. |
Average |
Bytes |
|
Total Volume |
The total traffic volumes in a VPC. |
Sum |
Bytes |
|
Total Packet |
The total traffic packets in a VPC. |
Sum |
Count |
|
In Traffic |
The total incoming traffic throughput in a VPC. |
Sum |
bps |
|
Out Traffic |
The total outgoing traffic throughput in a VPC. |
Sum |
bps |
|
Total Traffic |
The total traffic throughput in a VPC. |
Sum |
bps |
|
Accepted Requests |
The total number of accepted requests in a VPC. |
Sum |
Count |
|
Rejected Requests |
The total number of rejected requests in a VPC. |
Sum |
Count |
|
Skipped Records |
The total number of skipped records in a VPC |
Sum |
Count |
|
No Data Records |
The total no data records in a VPC. |
Sum |
Count |
|
Number of Free IPs |
The total number of free IPs in a VPC. |
Sum |
Count |
|
Number of Network Interfaces |
The total number of network interfaces in a VPC. |
Sum |
Count |
|
Number of Subnets |
The total number of Subnets in a VPC. |
Sum |
Count |
Subnet-level metrics
| Metric name | Description | Statistics | Unit |
|---|---|---|---|
|
Metric name |
Description |
Statistic |
Unit |
|
Total Rx Volume |
The total amount of received traffic volumes in a subnet. |
Sum |
Bytes |
|
Minimum Rx Volume |
The minimum received traffic volume in a subnet. |
Minimum |
Bytes |
|
Maximum Rx Volume |
The maximum received traffic volume in a subnet. |
Maximum |
Bytes |
|
Total Tx Volume |
The total transmitted traffic volumes in a subnet. |
Sum |
Bytes |
|
Minimum TxRx Volume |
The minimum transmitted traffic volume in a subnet. |
Minimum |
Bytes |
|
Maximum Tx Volume |
The maximum transmitted traffic volume in a subnet. |
Maximum |
Bytes |
|
Total Rx Packet |
The total received traffic packets in a subnet. |
Sum |
Count |
|
Minimum Rx Packet |
The minimum received traffic packets in a subnet. |
Minimum |
Count |
|
Maximum Rx Packet |
The maximum received traffic packets in a subnet. |
Maximum |
Count |
|
Total Tx Packet |
The total transmitted traffic packets in a subnet. |
Sum |
Count |
|
Minimum Tx Packet |
The minimum transmitted traffic packets in a subnet. |
Minimum |
Count |
|
Maximum Tx Packet |
The maximum transmitted traffic packets in a subnet. |
Maximum |
Count |
|
Average Rx Packet Size |
The average received packet size in a subnet. |
Average |
Bytes |
|
Average Tx Packet Size |
The average transmitted packet size in a subnet. |
Average |
Bytes |
|
Total Volume |
The total traffic volumes in a subnet. |
Sum |
Bytes |
|
Total Packet |
The total traffic packets in a subnet. |
Sum |
Count |
|
In Traffic |
The total incoming traffic throughput in a subnet. |
Sum |
bps |
|
Out Traffic |
The total outgoing traffic throughput in a subnet. |
Sum |
bps |
|
Total Traffic |
The total traffic throughput in a subnet. |
Sum |
bps |
|
Accepted Requests |
The total accepted requests in a subnet. |
Sum |
Count |
|
Rejected Requests |
The total rejected requests in a subnet. |
Sum |
Count |
|
Skipped Records |
The total skipped records in a subnet. |
Sum |
Count |
|
No data Records |
The total no data records in a subnet. |
Sum |
Count |
|
Number of Free IPs |
The total free IPs in a subnet. |
Sum |
Count |
|
Number of Network Interfaces |
The total network interfaces in a subnet. |
Sum |
Count |
Network Interface-level metrics
| Metric name | Description | Statistics | Unit |
|---|---|---|---|
|
Metric name |
Description |
Statistic |
Unit |
|
Total Rx Volume |
The total amount of received traffic volumes in a network interface. |
Sum |
Bytes |
|
Minimum Rx Volume |
The minimum amount of received traffic volume in a network interface. |
Minimum |
Bytes |
|
Maximum Rx Volume |
The maximum amount of received traffic volume in a network interface. |
Maximum |
Bytes |
|
Total Tx Volume |
The total amount of transmitted traffic volumes in a network interface. |
Sum |
Bytes |
|
Minimum Tx Volume |
The minimum amount of transmitted traffic volume in a network interface. |
Minimum |
Bytes |
|
Maximum Tx Volume |
The maximum amount of transmitted traffic volume in a network interface. |
Maximum |
Bytes |
|
Total Rx Packet |
The total number of received traffic packets in a network interface. |
Sum |
Count |
|
Minimum Rx Packet |
The minimum received traffic packets in a network interface. |
Minimum |
Count |
|
Maximum Rx Packet |
The maximum received traffic packets in a network interface. |
Maximum |
Count |
|
Total Tx Packet |
The total number of transmitted traffic packets in a network interface. |
Sum |
Count |
|
Minimum Tx Packet |
The minimum number of transmitted traffic packets in a network interface. |
Minimum |
Count |
|
Maximum Tx Packet |
The maximum number of transmitted traffic packets in a network interface. |
Maximum |
Count |
|
Average Rx Packet Size |
The average incoming packet size in a network interface. |
Average |
Bytes |
|
Average Tx Packet Size |
The average transmitted packet size in a network interface. |
Average |
Bytes |
|
Total Volume |
The total amount of traffic volumes in a network interface. |
Sum |
Bytes |
|
Total Packet |
The total number of traffic packets in a network interface. |
Sum |
Count |
|
In Traffic |
The total incoming traffic throughput in a network interface. |
Sum |
bps |
|
Out Traffic |
The total outgoing traffic throughput in a network interface. |
Sum |
bps |
|
Total Traffic |
The total traffic throughput in a network interface. |
Sum |
bps |
|
Accepted Requests |
The total number of accepted requests in a network interface. |
Sum |
Count |
|
Rejected Requests |
The total number of rejected requests in a network interface. |
Sum |
Count |
|
Skipped Records |
The total number of skipped records in a network interface. |
Sum |
Count |
|
No data Records |
The total number of no data records in a network interface. |
Sum |
Count |
Network Interface- and Protocol-level metrics
| Metric name | Description | Statistics | Unit |
|---|---|---|---|
|
Metric name |
Description |
Statistic |
Unit |
|
Total Rx Volume |
The total amount of received traffic volumes for a protocol in network interface. |
Sum |
Bytes |
|
Minimum Rx Volume |
The minimum amount of received traffic volume for a protocol in network interface. |
Minimum |
Bytes |
|
Maximum Rx Volume |
The maximum amount of received traffic volume for a protocol in network interface. |
Maximum |
Bytes |
|
Total Tx Volume |
The total amount of transmitted traffic volumes for a protocol in network interface. |
Sum |
Bytes |
|
Minimum Tx Volume |
The minimum amount of transmitted traffic traffic volume for a protocol in network interface. |
Minimum |
Bytes |
|
Maximum Tx Volume |
The maximum amount of transmitted traffic traffic volume for a protocol in network interface. |
Maximum |
Bytes |
|
Total Rx Packet |
The total number of incoming traffic packets for a protocol in network interface. |
Sum |
Count |
|
Minimum Rx Packet |
The minimum number of incoming traffic packets for a protocol in network interface. |
Minimum |
Count |
|
Maximum Rx Packet |
The maximum number of incoming traffic packets for a protocol in network interface. |
Maximum |
Count |
|
Total Tx Packet |
The total number of transmitted traffic packets for a protocol in network interface. |
Sum |
Count |
|
Minimum Tx Packet |
The minimum number of transmitted traffic packets for a protocol in network interface. |
Minimum |
Count |
|
Maximum Tx Packet |
The maximum number of transmitted traffic packets for a protocol in network interface. |
Maximum |
Count |
|
Average Rx Packet Size |
The average received packet size for a protocol in network interface. |
Average |
Bytes |
|
Average Tx Packet Size |
The average transmitted packet size for a protocol in network interface. |
Average |
Bytes |
|
Total Volume |
The total traffic volumes for a protocol in network interface. |
Sum |
Bytes |
|
Total Packet |
The total traffic packets for a protocol in network interface. |
Sum |
Count |
|
In Traffic |
The total incoming traffic throughput for a protocol in network interface. |
Sum |
bps |
|
Out Traffic |
The total outgoing traffic throughput for a protocol in network interface. |
Sum |
bps |
|
Total Traffic |
The total traffic throughput for a protocol in network interface. |
Sum |
bps |
|
Accepted Requests |
The total accepted requests for a protocol in network interface. |
Sum |
Count |
|
Rejected Requests |
The total rejected requests for a protocol in network interface. |
Sum |
Count |
Threshold configuration
To configure thresholds for your integrated monitor:
- Log in to your Site24x7 account and navigate to Admin > Configuration Profiles > Threshold and Availability.
- Click Add Threshold Profile.
- Select the applicable monitor type from the Monitor Type drop-down menu. The applicable monitor types are Virtual Private Cloud, VPC Region, Availability Zone, VPC, Subnet, Network Interface, Protocol, and Route Table.
- The supported metrics are displayed in the Threshold Configuration section. You can set threshold values for all the metrics mentioned above.
- Click Save.
Licensing
- The Virtual Private Cloud, VPC Region, Availability Zone, Subnet, Protocol, and Route Table monitors are free.
- Each VPC monitor is considered a basic monitor.
- For Amazon VPC Network Interface monitor, five monitors utilize one basic monitor license.
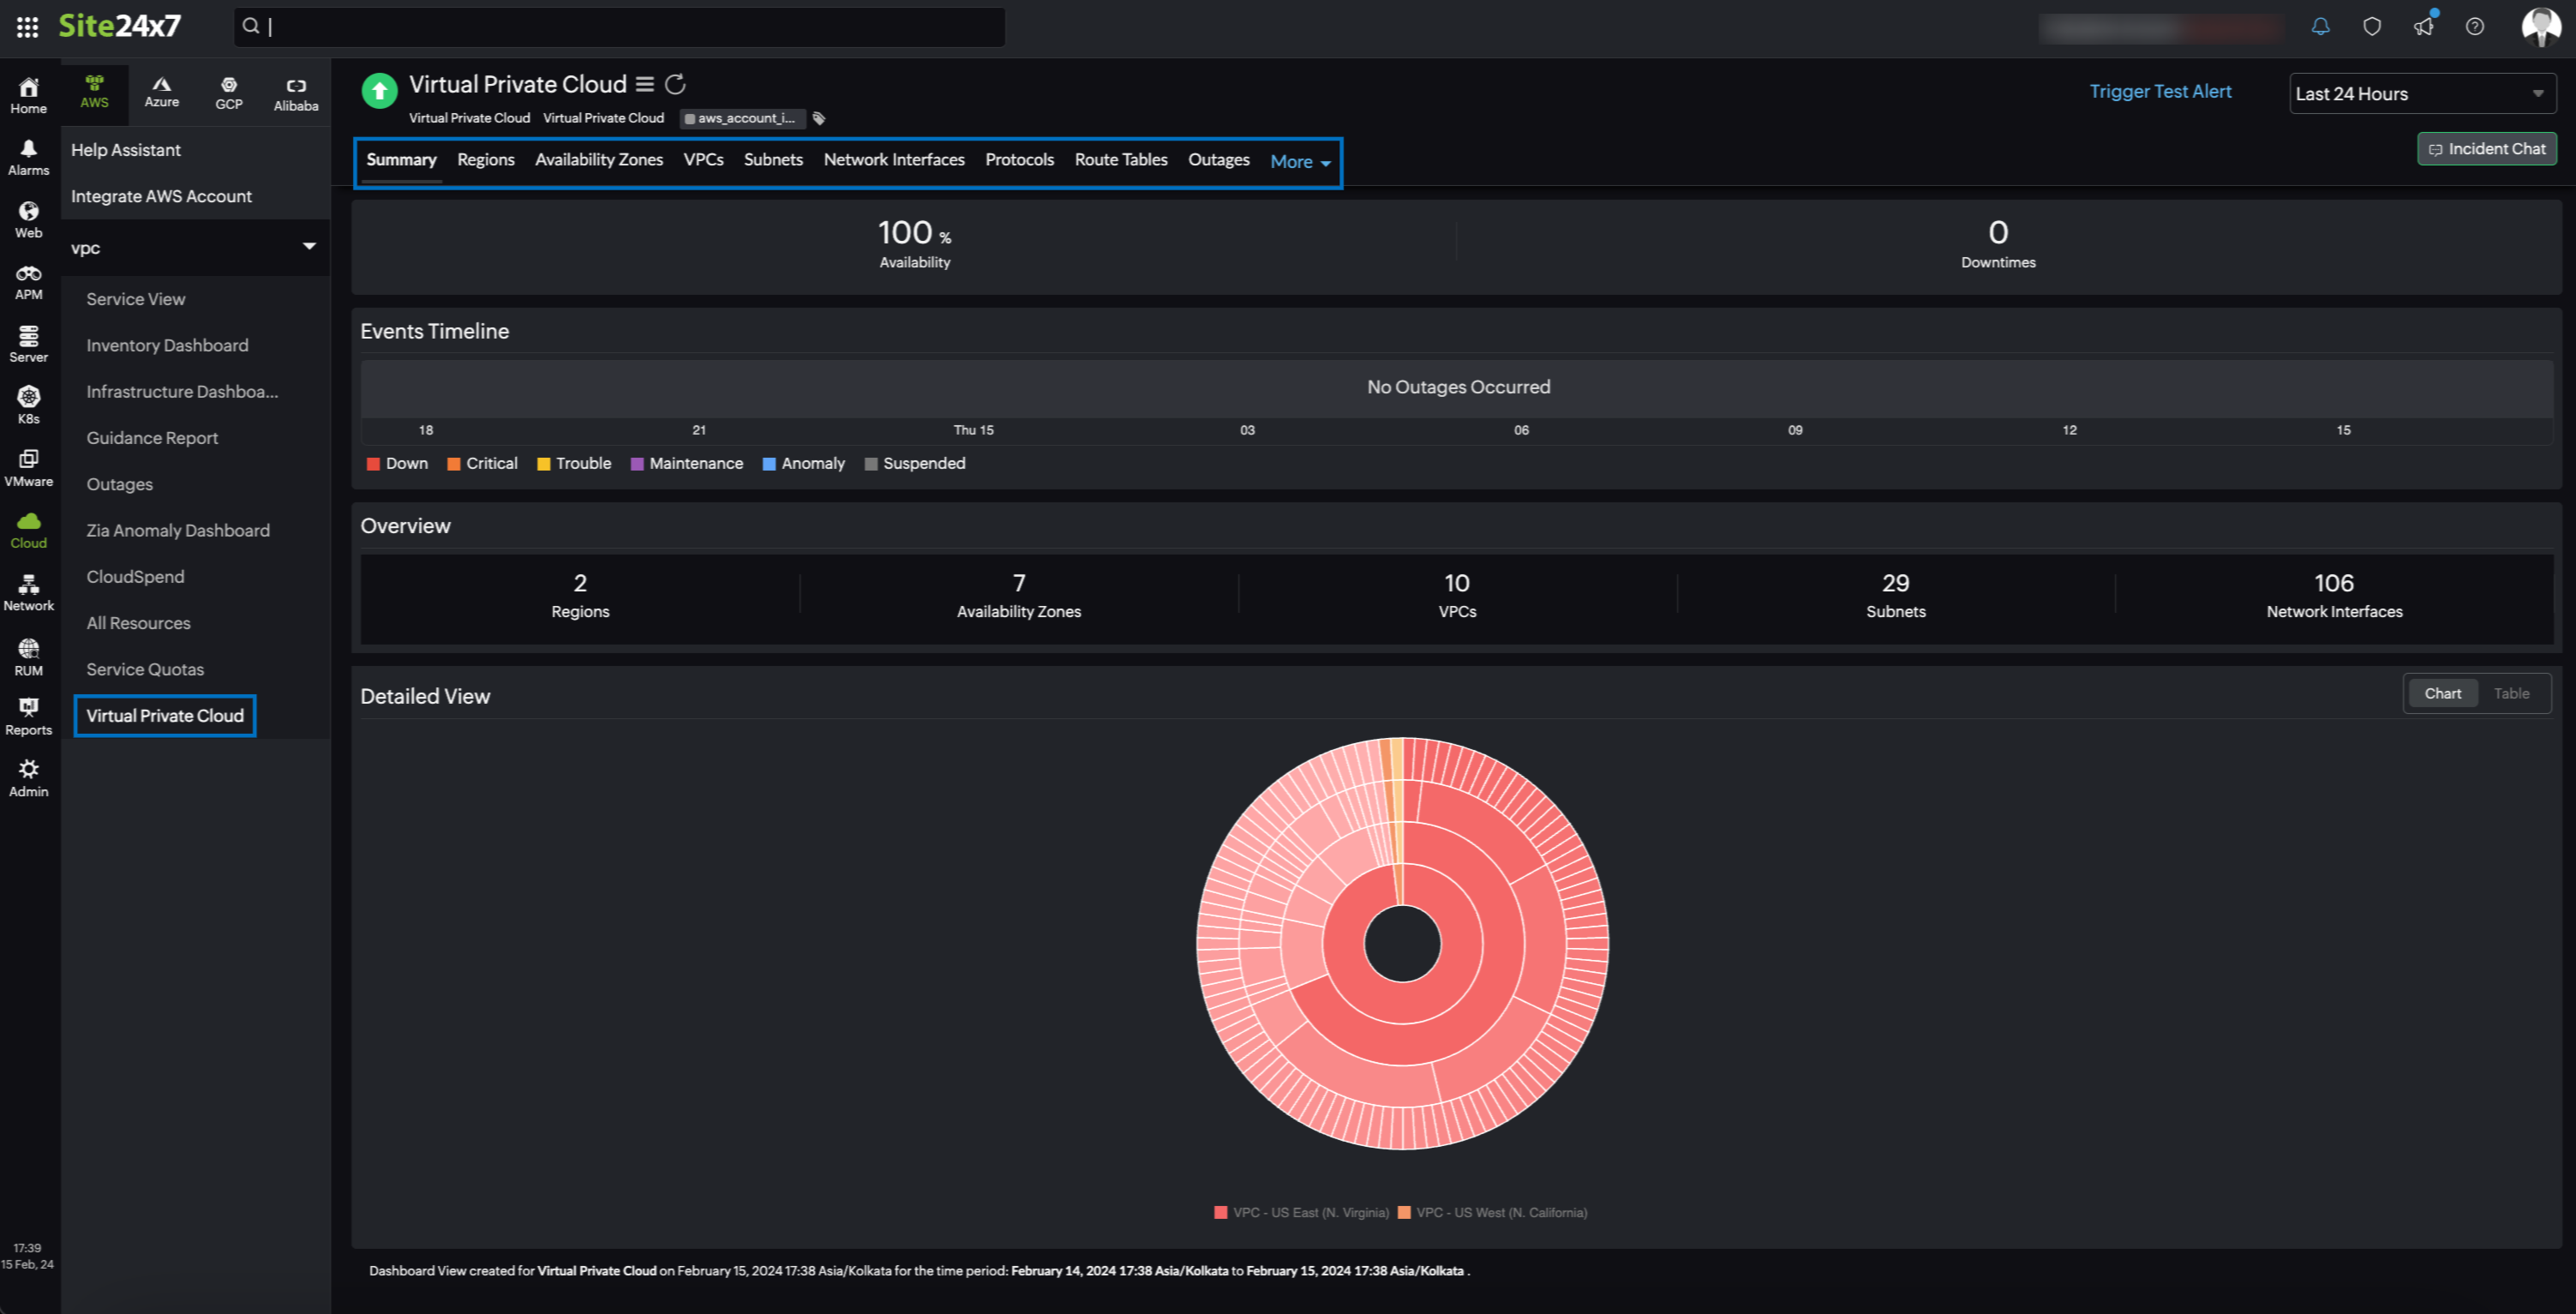
Viewing Amazon Virtual Private Cloud monitor data
To view your Amazon Virtual Private Cloud data, log in to your Site24x7 account and navigate to Cloud > AWS > Virtual Private Cloud.
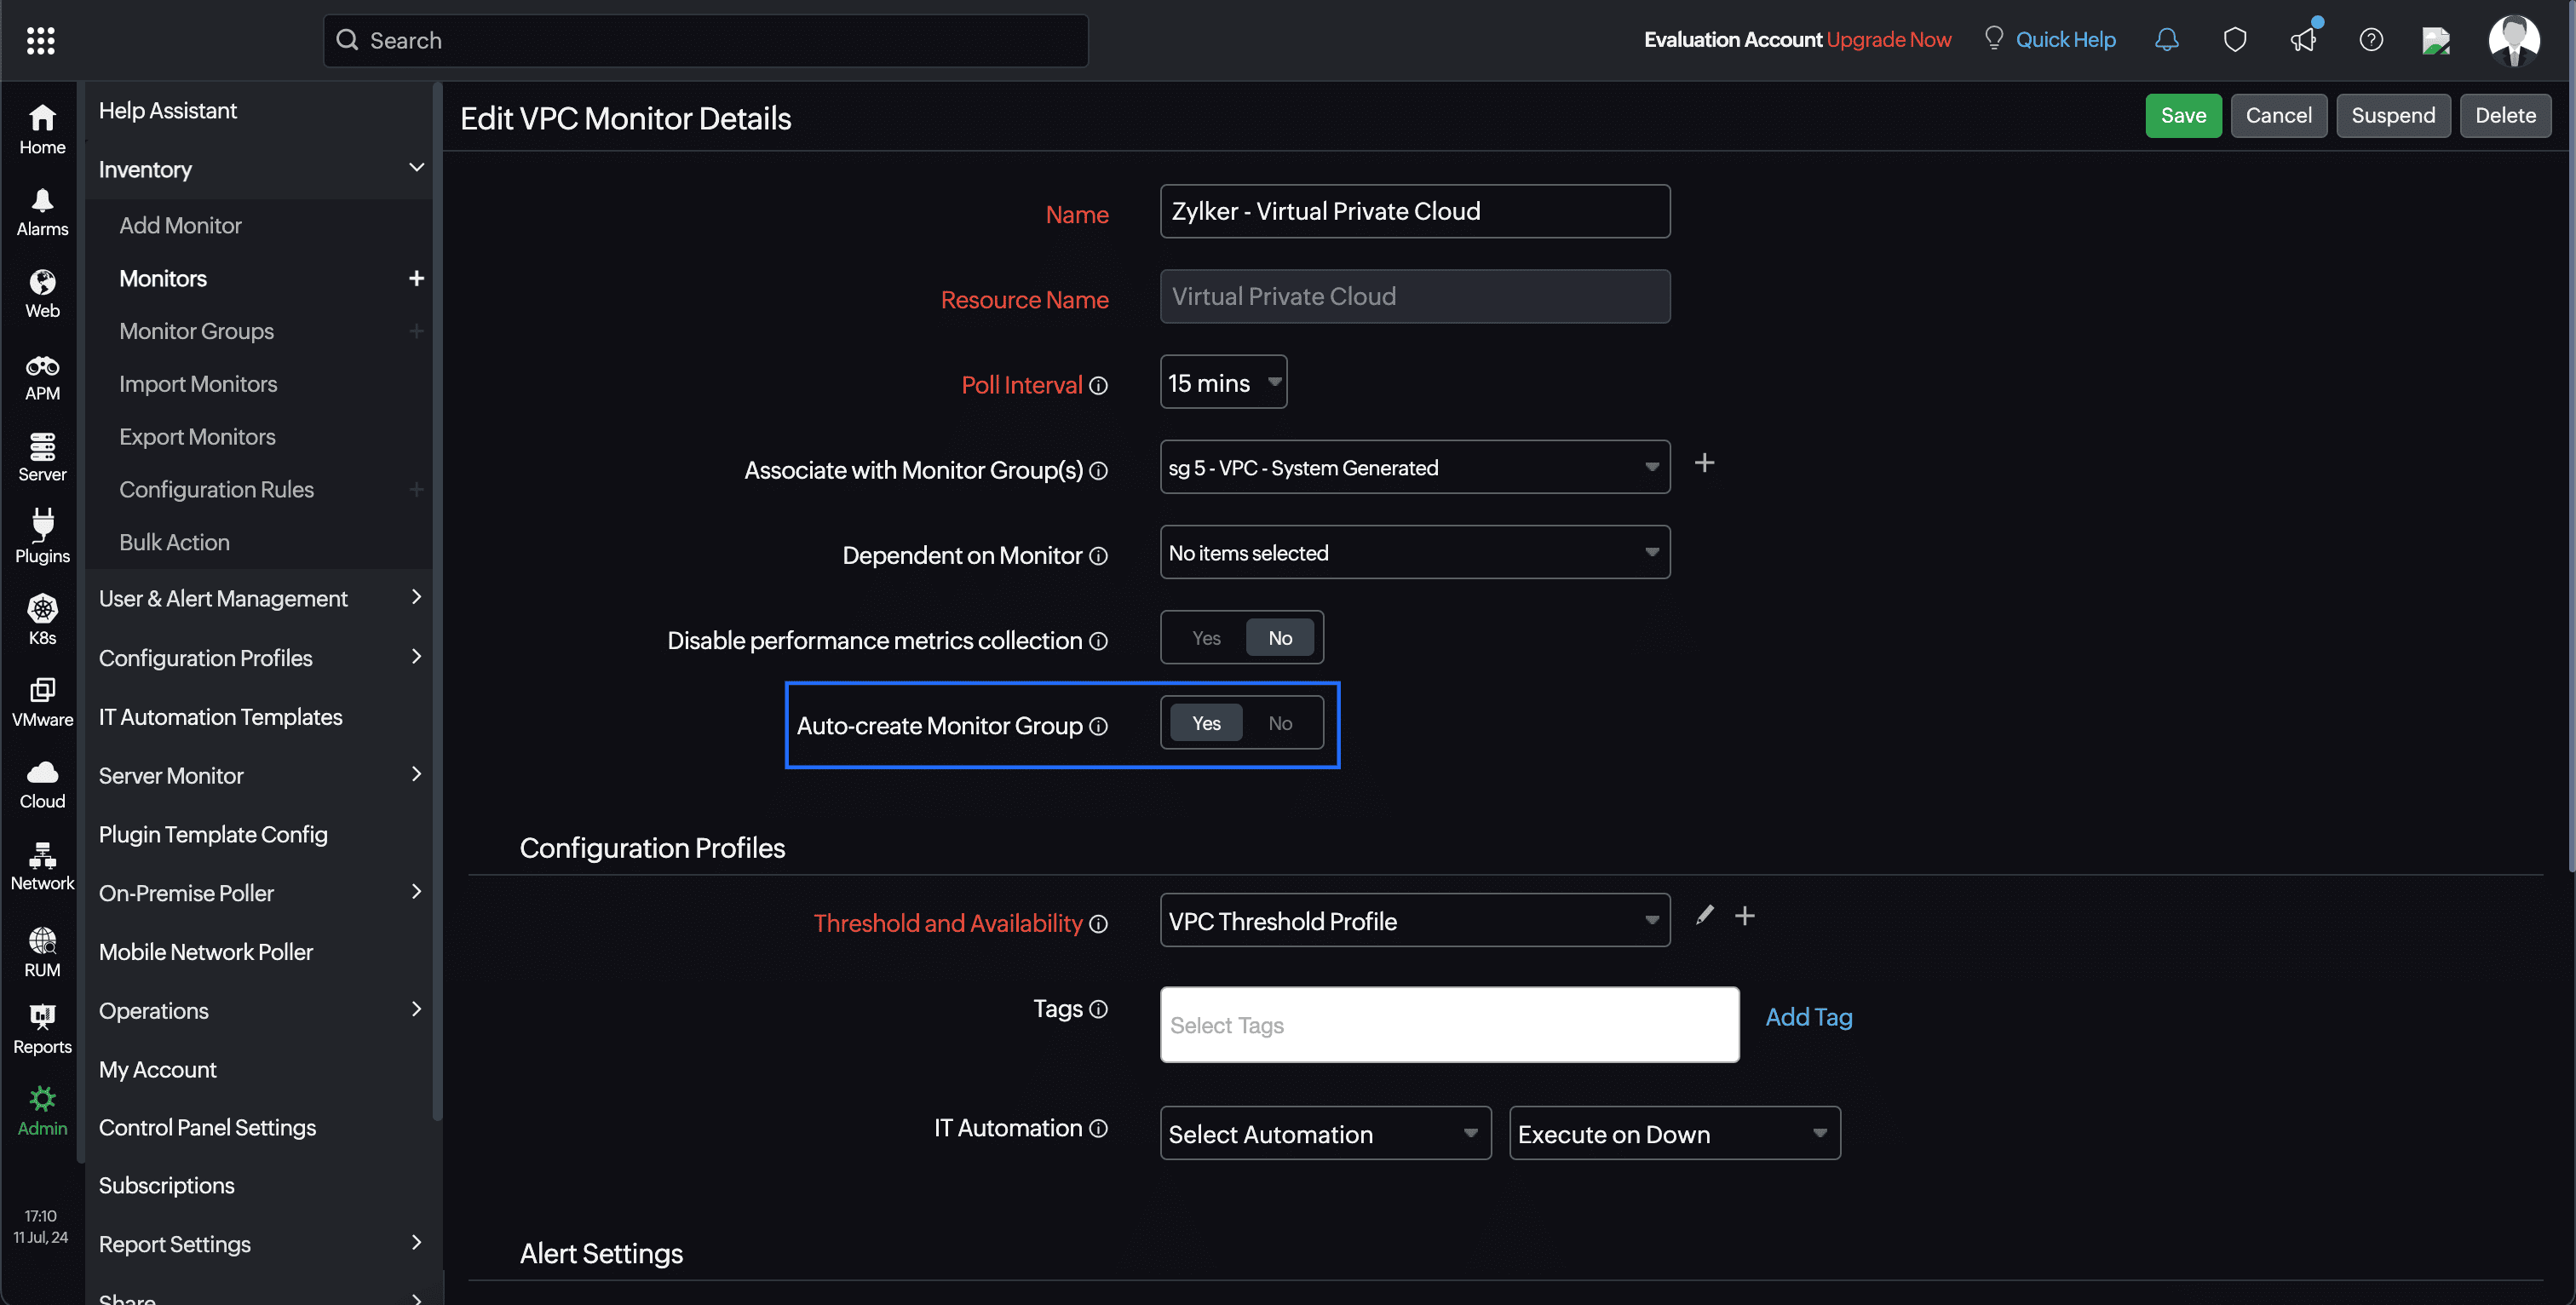
In the Edit VPC Monitor Details page, toggle the Auto-create Monitor Groups option to Yes to automatically create a VPC monitor group.
Monitor data
Amazon Virtual Private Cloud data
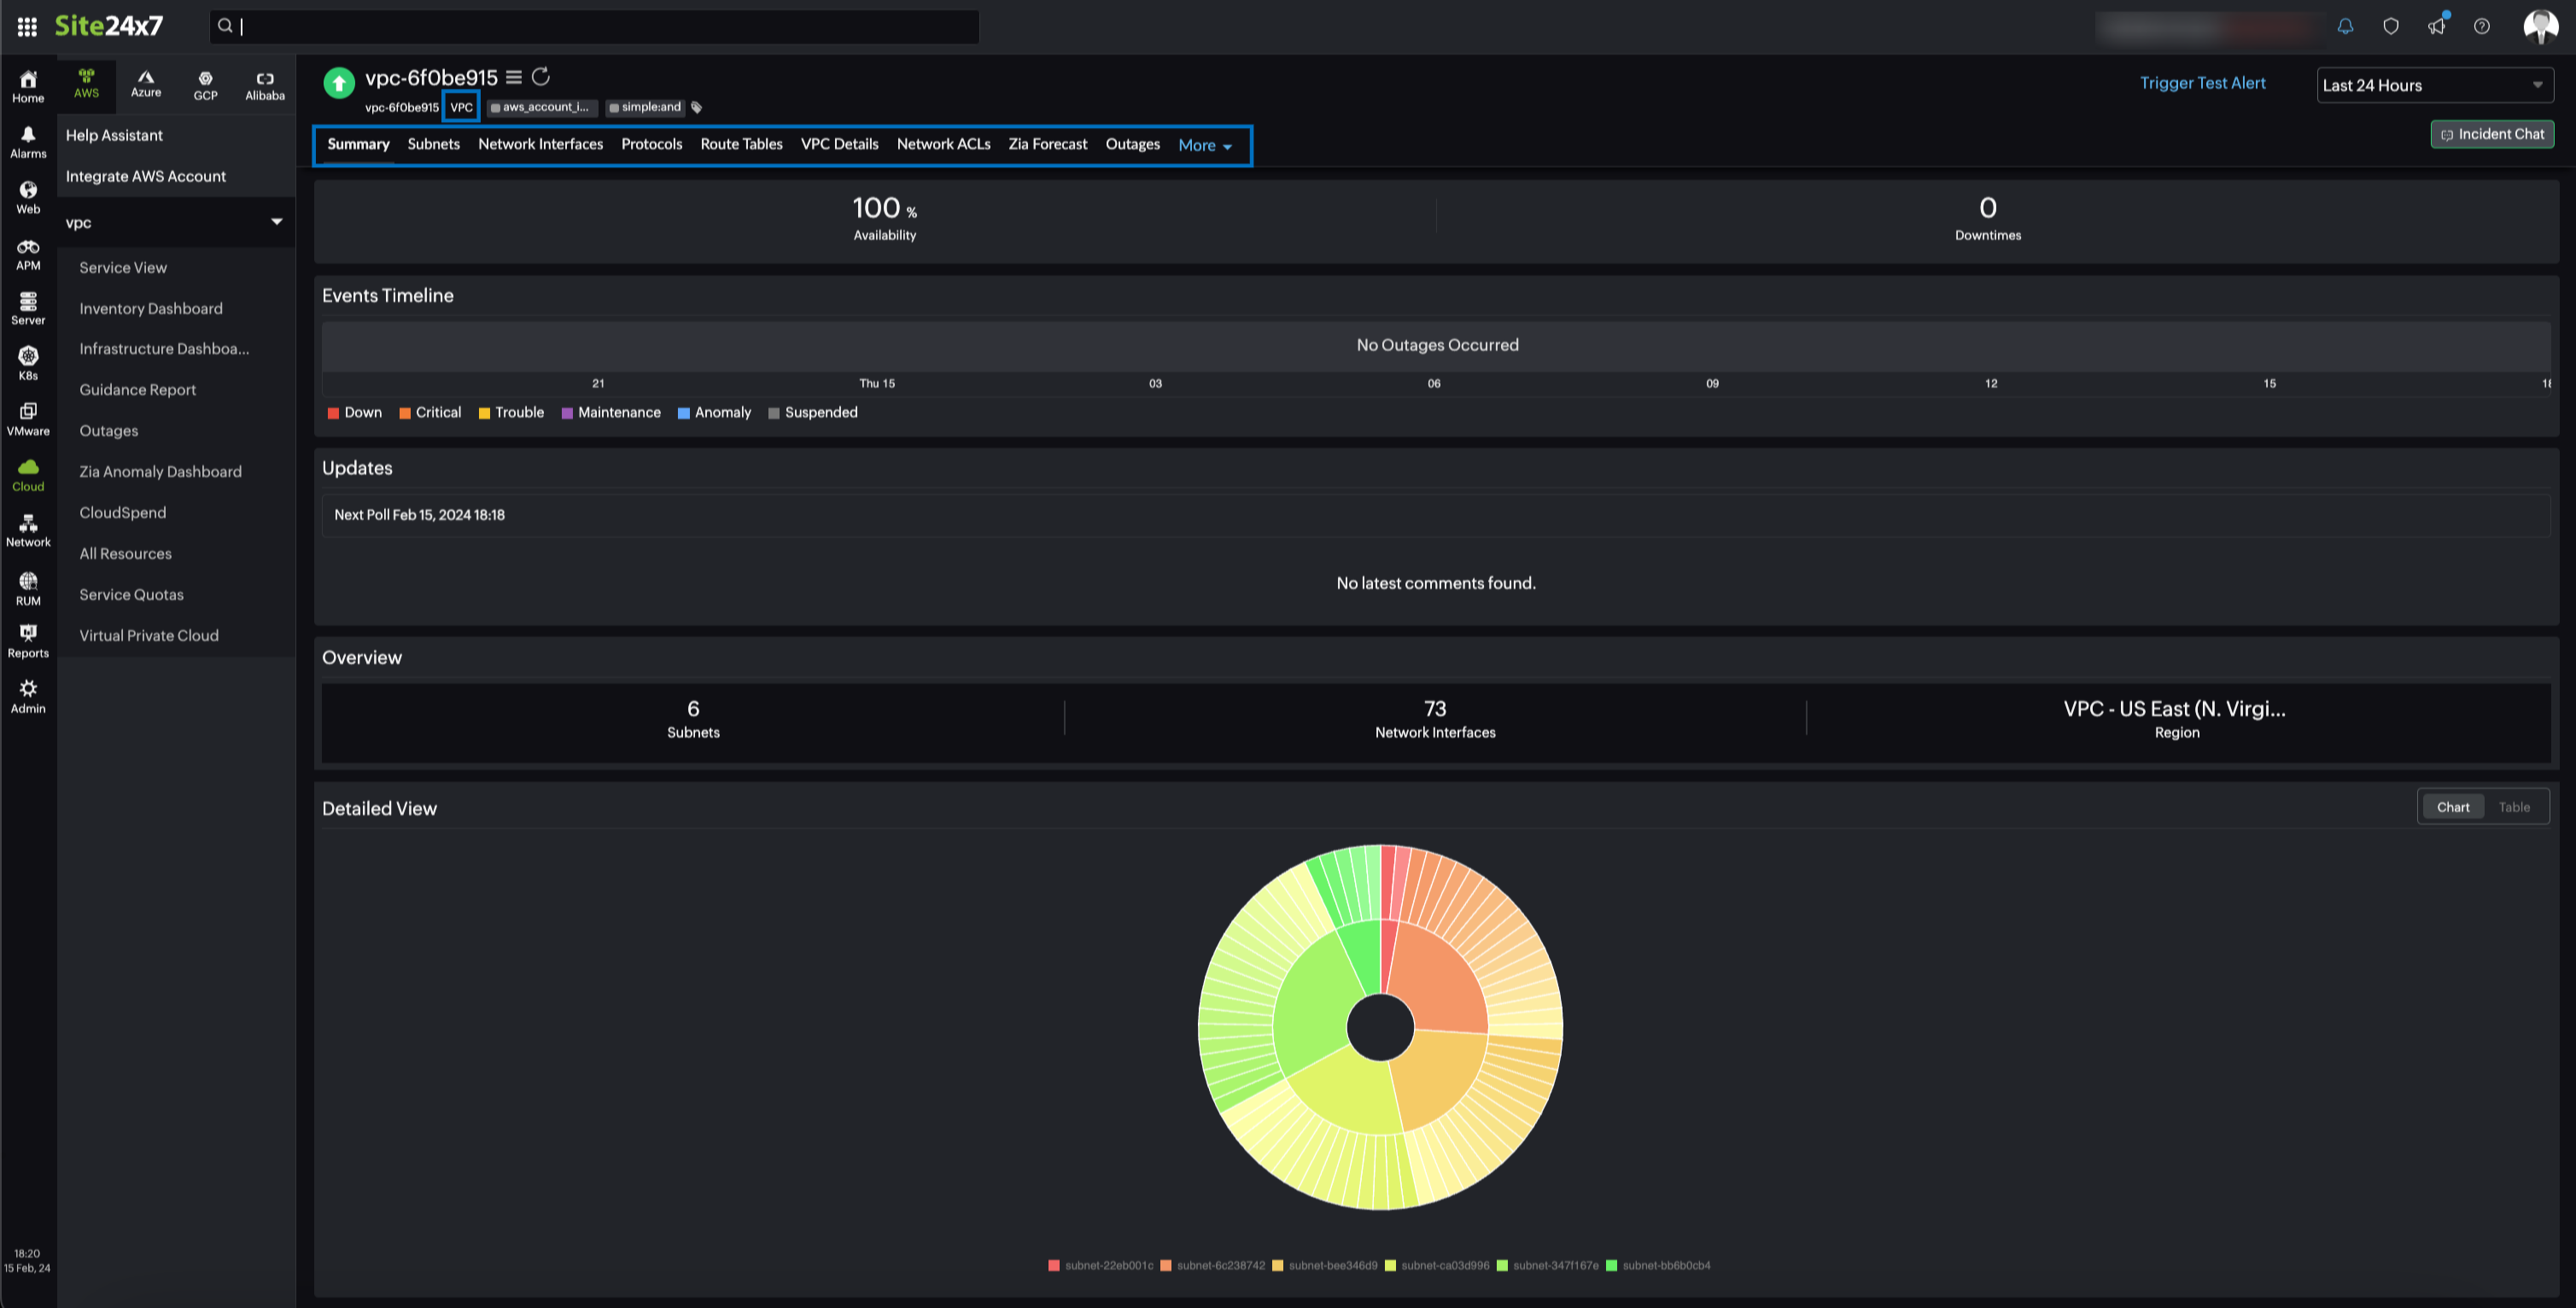
You can view the Amazon Virtual Private Cloud data on the following tabs:
Summary
The Summary tab displays the number of child monitors and their detailed view in the form of a chart or a table.
Regions
The Regions tab displays the VPC Region monitor's data along with the configured metrics data.
Availability Zones
The Availability Zones tab displays the Availability Zones monitor's data along with the configured metrics data.
VPCs
The VPCs tab displays the VPC monitor's data along with the configured metrics data.
Subnets
Obtain the Subnet monitor's data along with the configured metrics data from the Subnets tab.
Network Interfaces
The Network Interfaces tab shows the Network Interface monitor's data along with the configured metrics data.
Protocols
The Protocols tab displays the top 10 protocol chart by volume along with the volume data of all the protocols.
Route Table
The Route Tables tab displays the Route Table monitor's data.
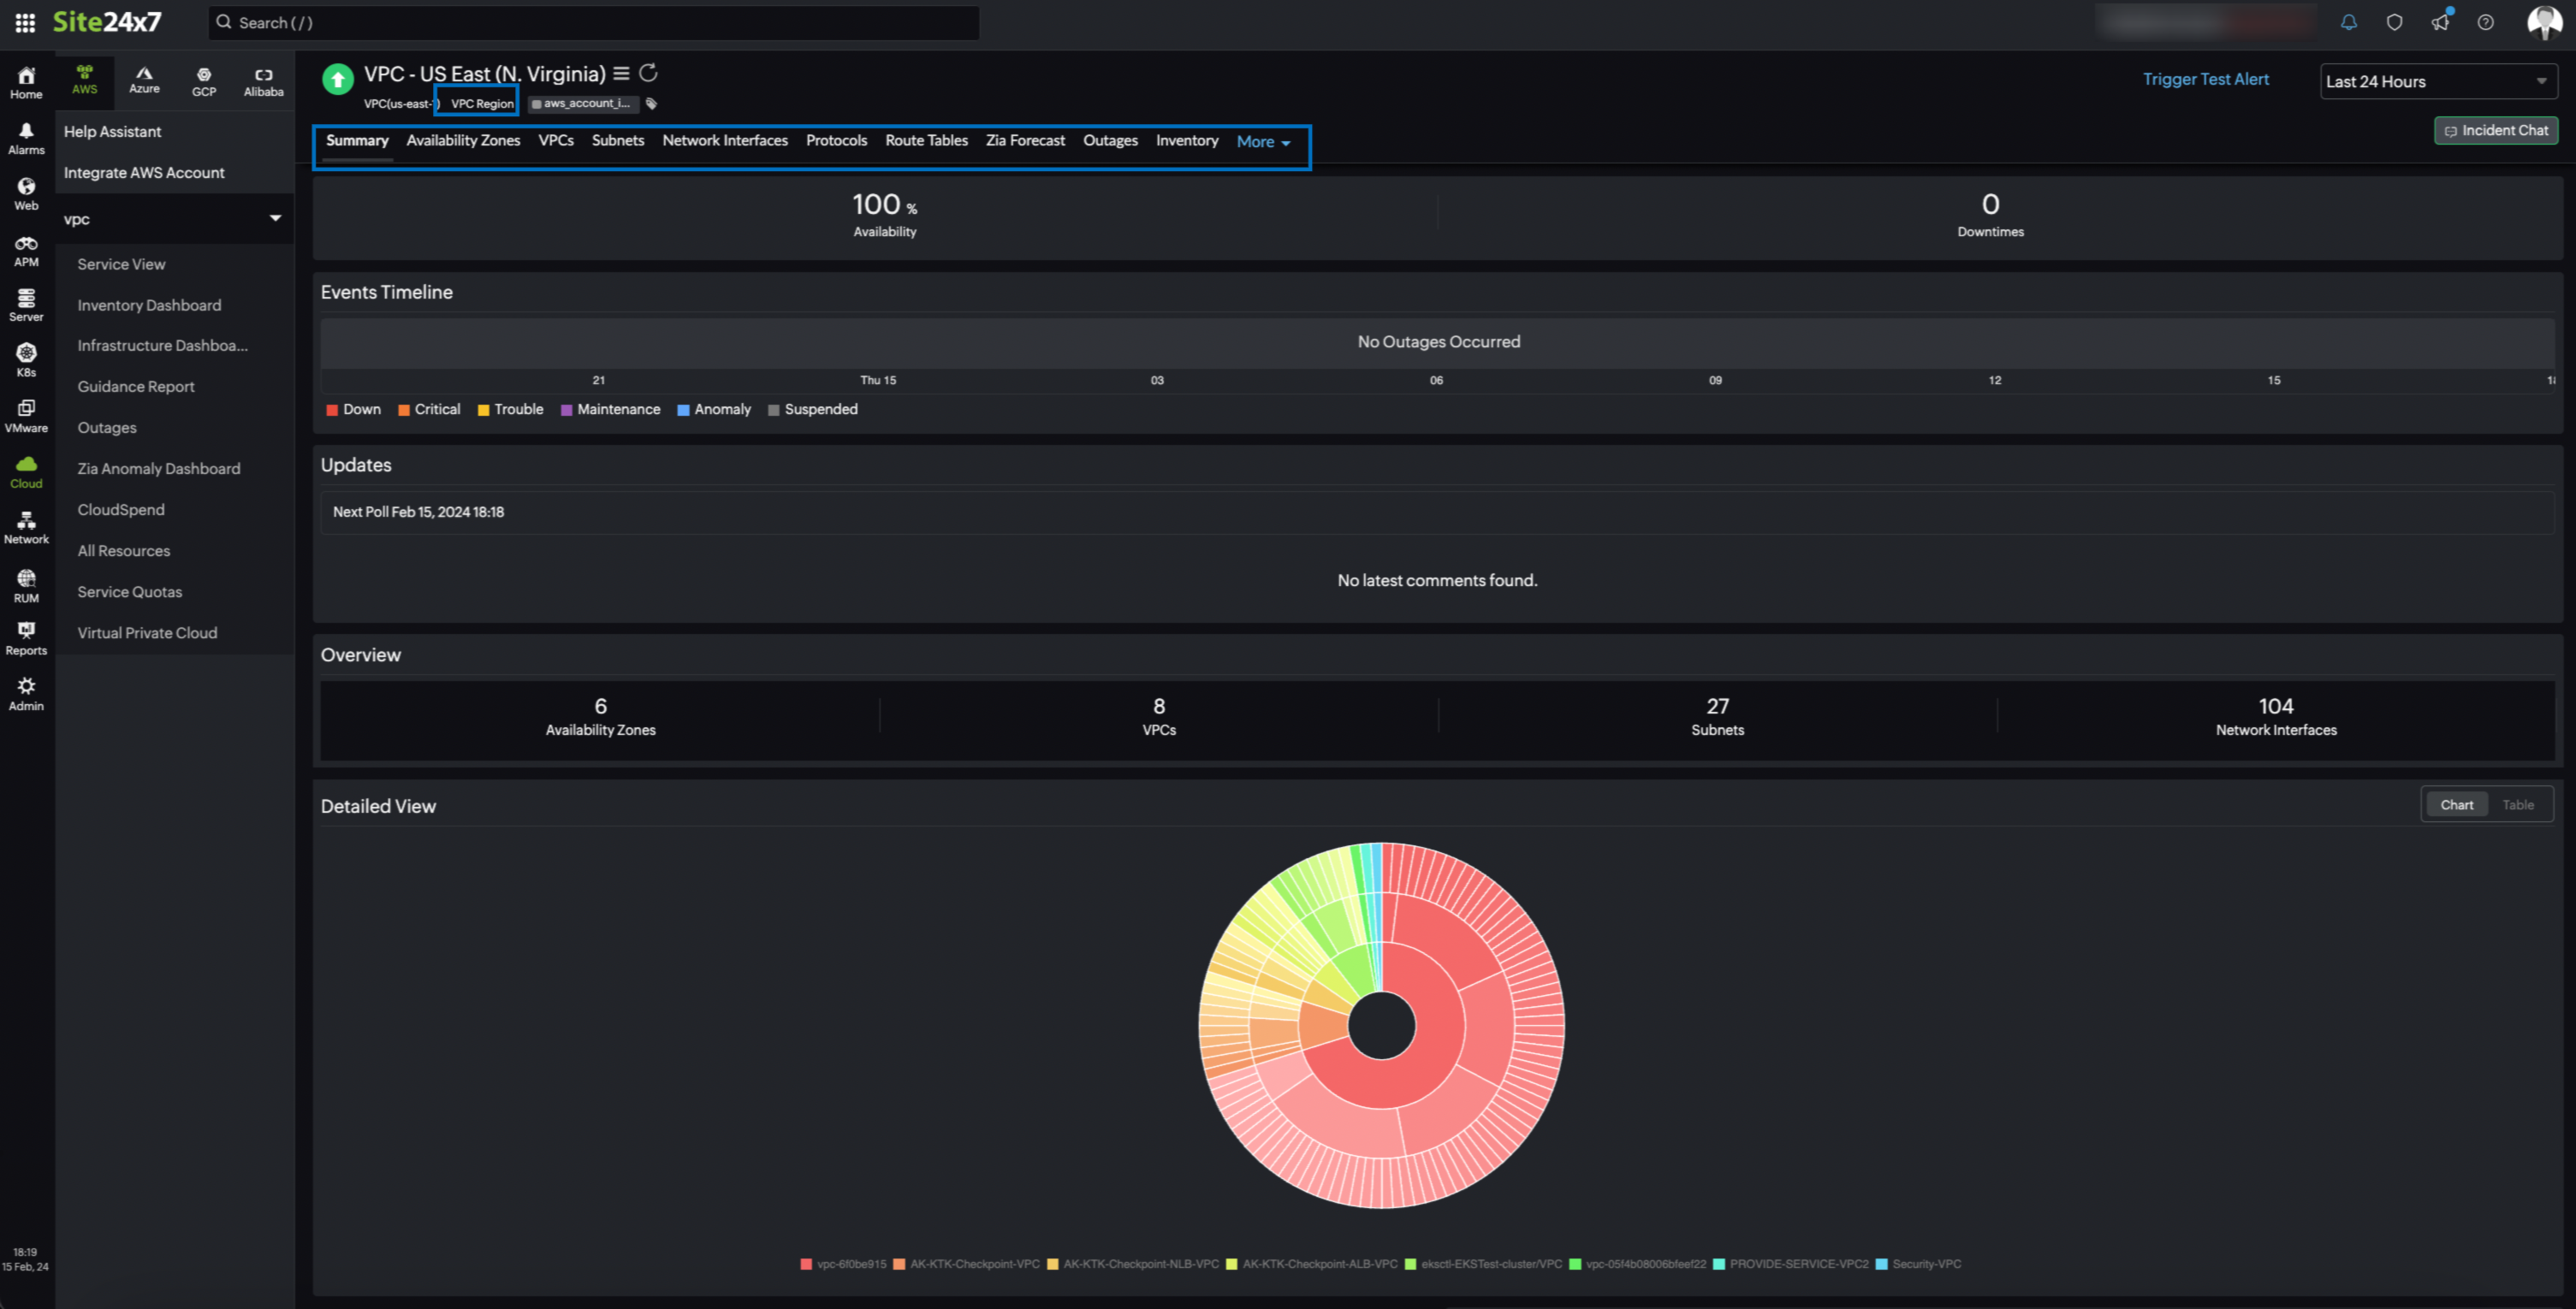
VPC Region monitor data
You can view the VPC Region monitor data on the following tabs:
Summary
The Summary tab shares the number of child monitors and their detailed view in the form of a chart or a table. You can also view the data for metrics such as Number of Free IPs, Number of VPCs, and Number of Subnets.
Availability Zones
The Availability Zones tab displays the inventory data of the availability zones.
VPCs
The VPCs tab displays the VPC monitor's inventory data.
Subnets
The Subnets tab displays the Subnet monitor's inventory data.
Network Interfaces
The Network Interfaces tab displays the Network Interface monitor's inventory data.
Protocols
The Protocols tab displays the top 10 protocol chart by volume along with the volume data of all the protocols.
Route Table
The Route Tables tab displays the Route Table monitor's inventory data.
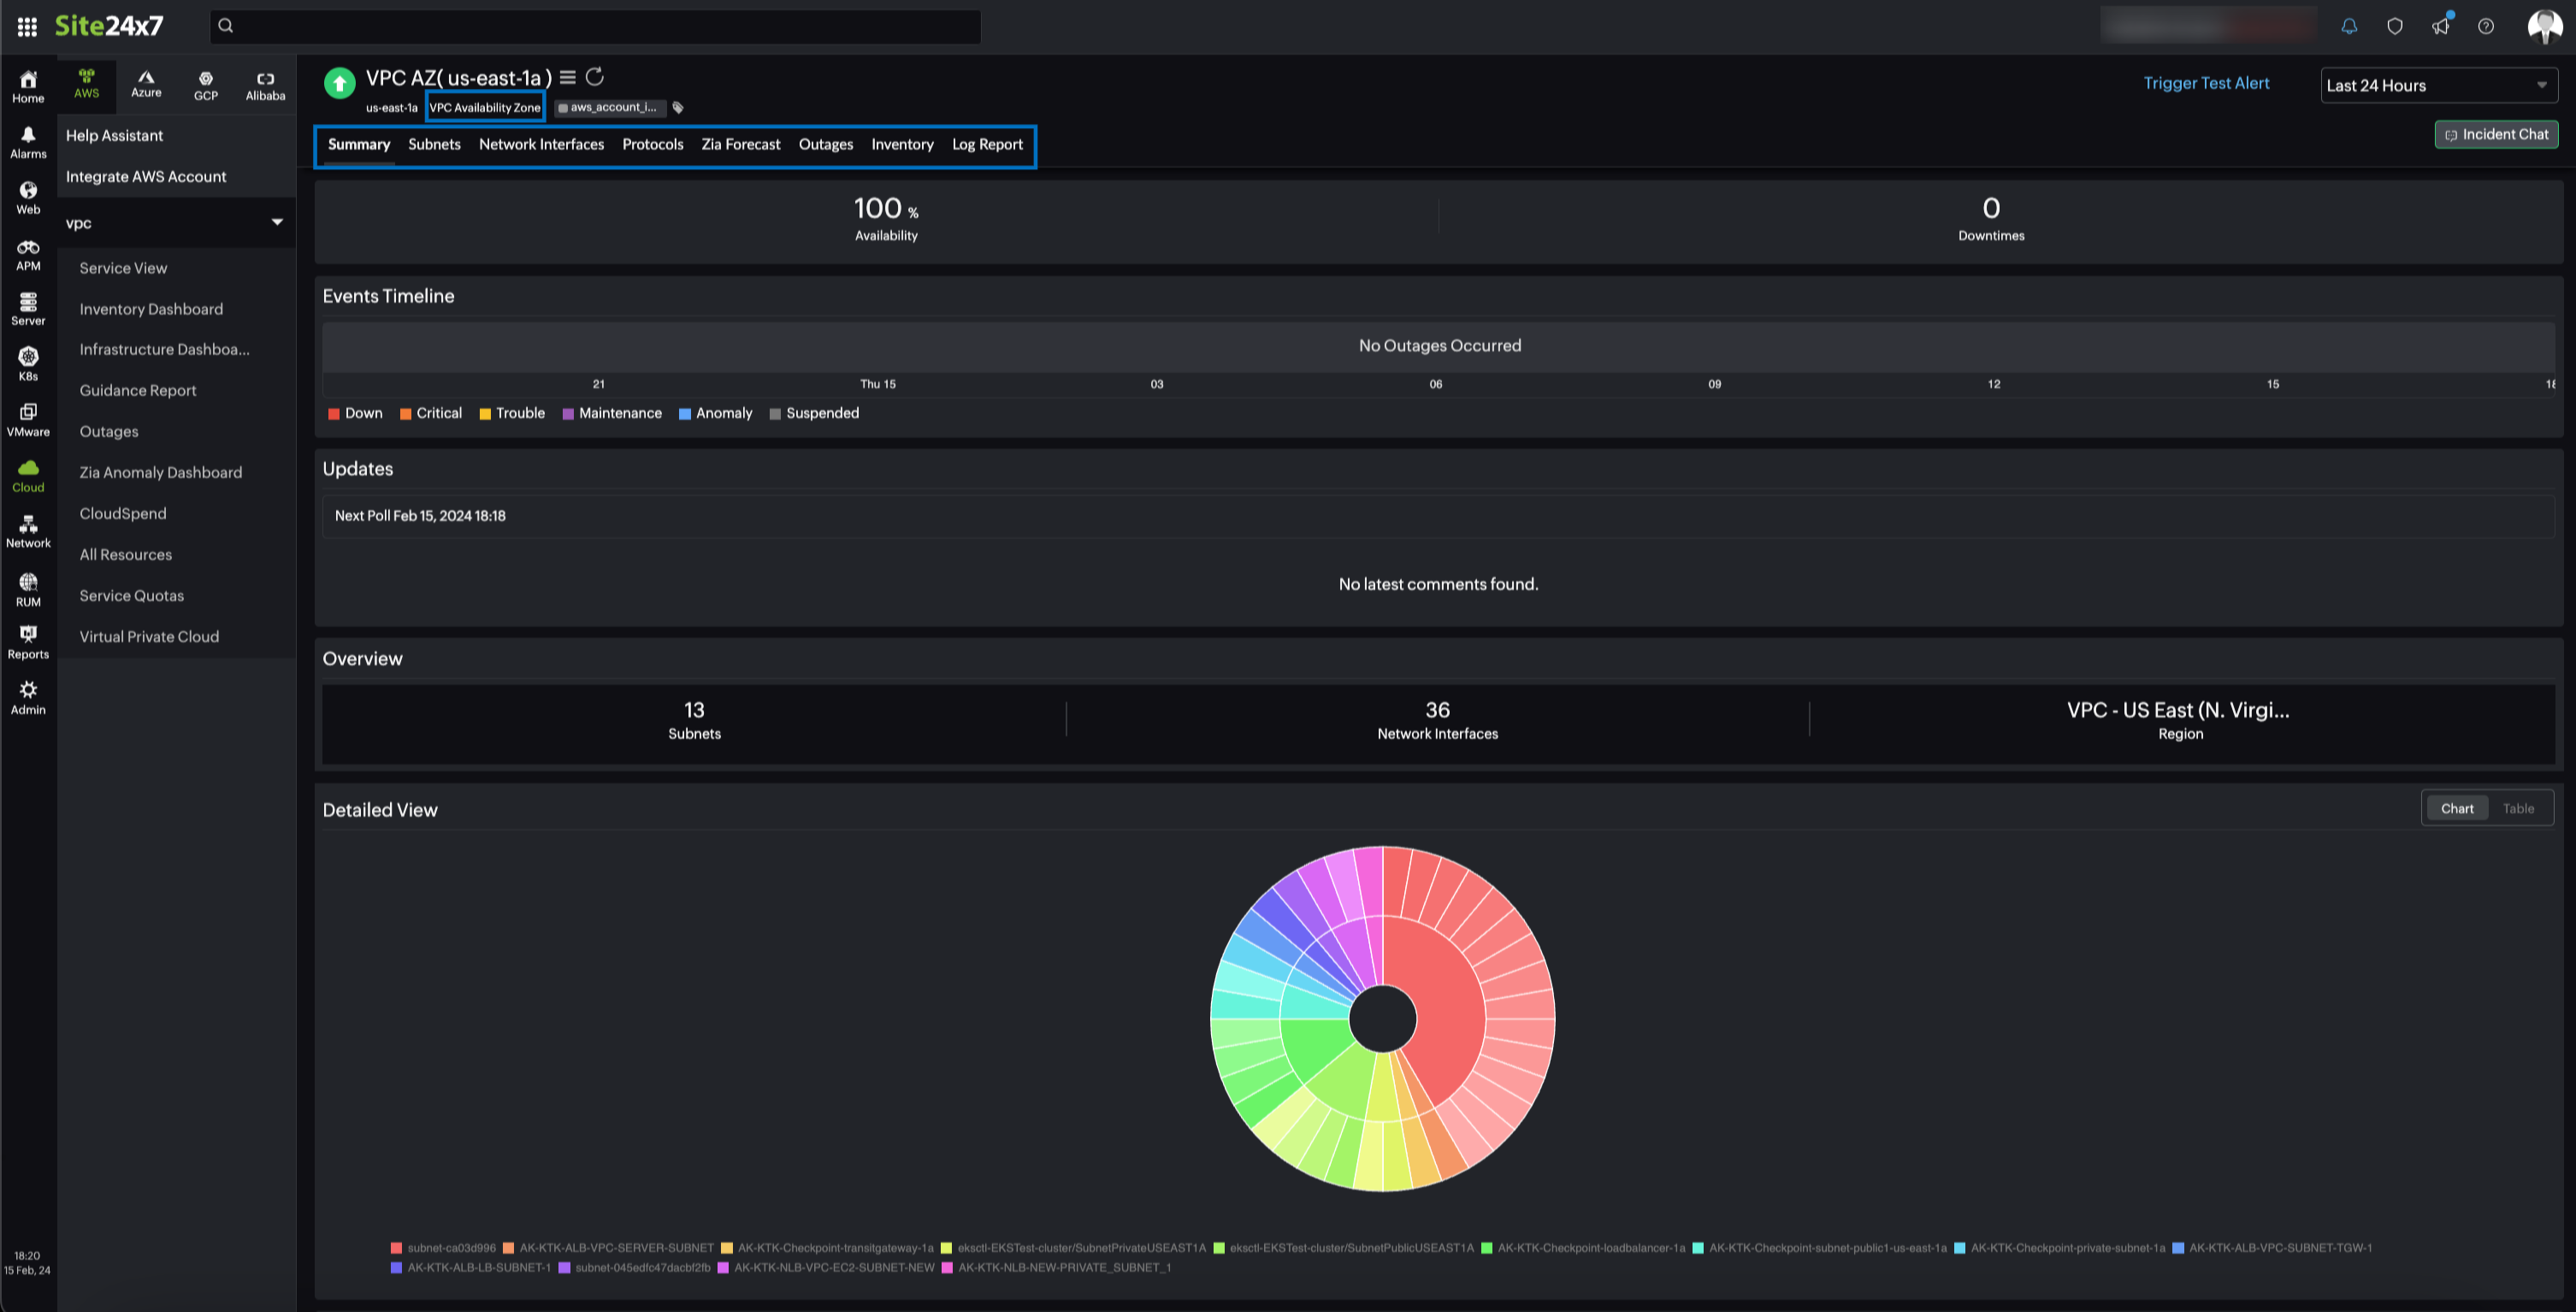
Availability Zone monitor data
You can view the Availability Zone monitor data on the following tabs:
Summary
The Summary tab displays an overview of the Availability Zone monitor along with the number of child monitors. You can also view the data for metrics such as Number of Free IPs, Number of Network Interfaces, and Number of Subnets.
Subnets
The Subnets tab displays the Subnet monitor's inventory data.
Network Interfaces
The Network Interfaces tab displays the Network Interface monitor's inventory data.
Protocols
The Protocols tab displays the top 10 protocol chart by volume along with the volume data of all the protocols.
VPC monitor data
You can view the VPC monitor data on the following tabs:
Summary
The Summary tab displays an overview of the VPC monitor along with the the number of child monitors. You can also view the data for metrics such as Number of Free IPs, Number of Network Interfaces, and Number of Subnets.
Subnets
The Subnets tab displays the Subnet monitor's inventory data.
Network Interfaces
The Network Interfaces tab displays the Network Interface monitor's inventory data.
Protocols
The Protocols tab displays the top 10 protocol chart by volume along with the volume data of all the protocols.
VPC Details
The VPC Details tab displays the configuration details of the VPC monitor such as VPC Description, IPv4 CIDR Blocks, and IPv6 CIDR Blocks details.
Route Table
The Route Tables tab displays the Route Table monitor's inventory data.
Network ACLs
The Network ACLs tab displays the details of the network access control lists (ACLs) associated with the VPC monitor.
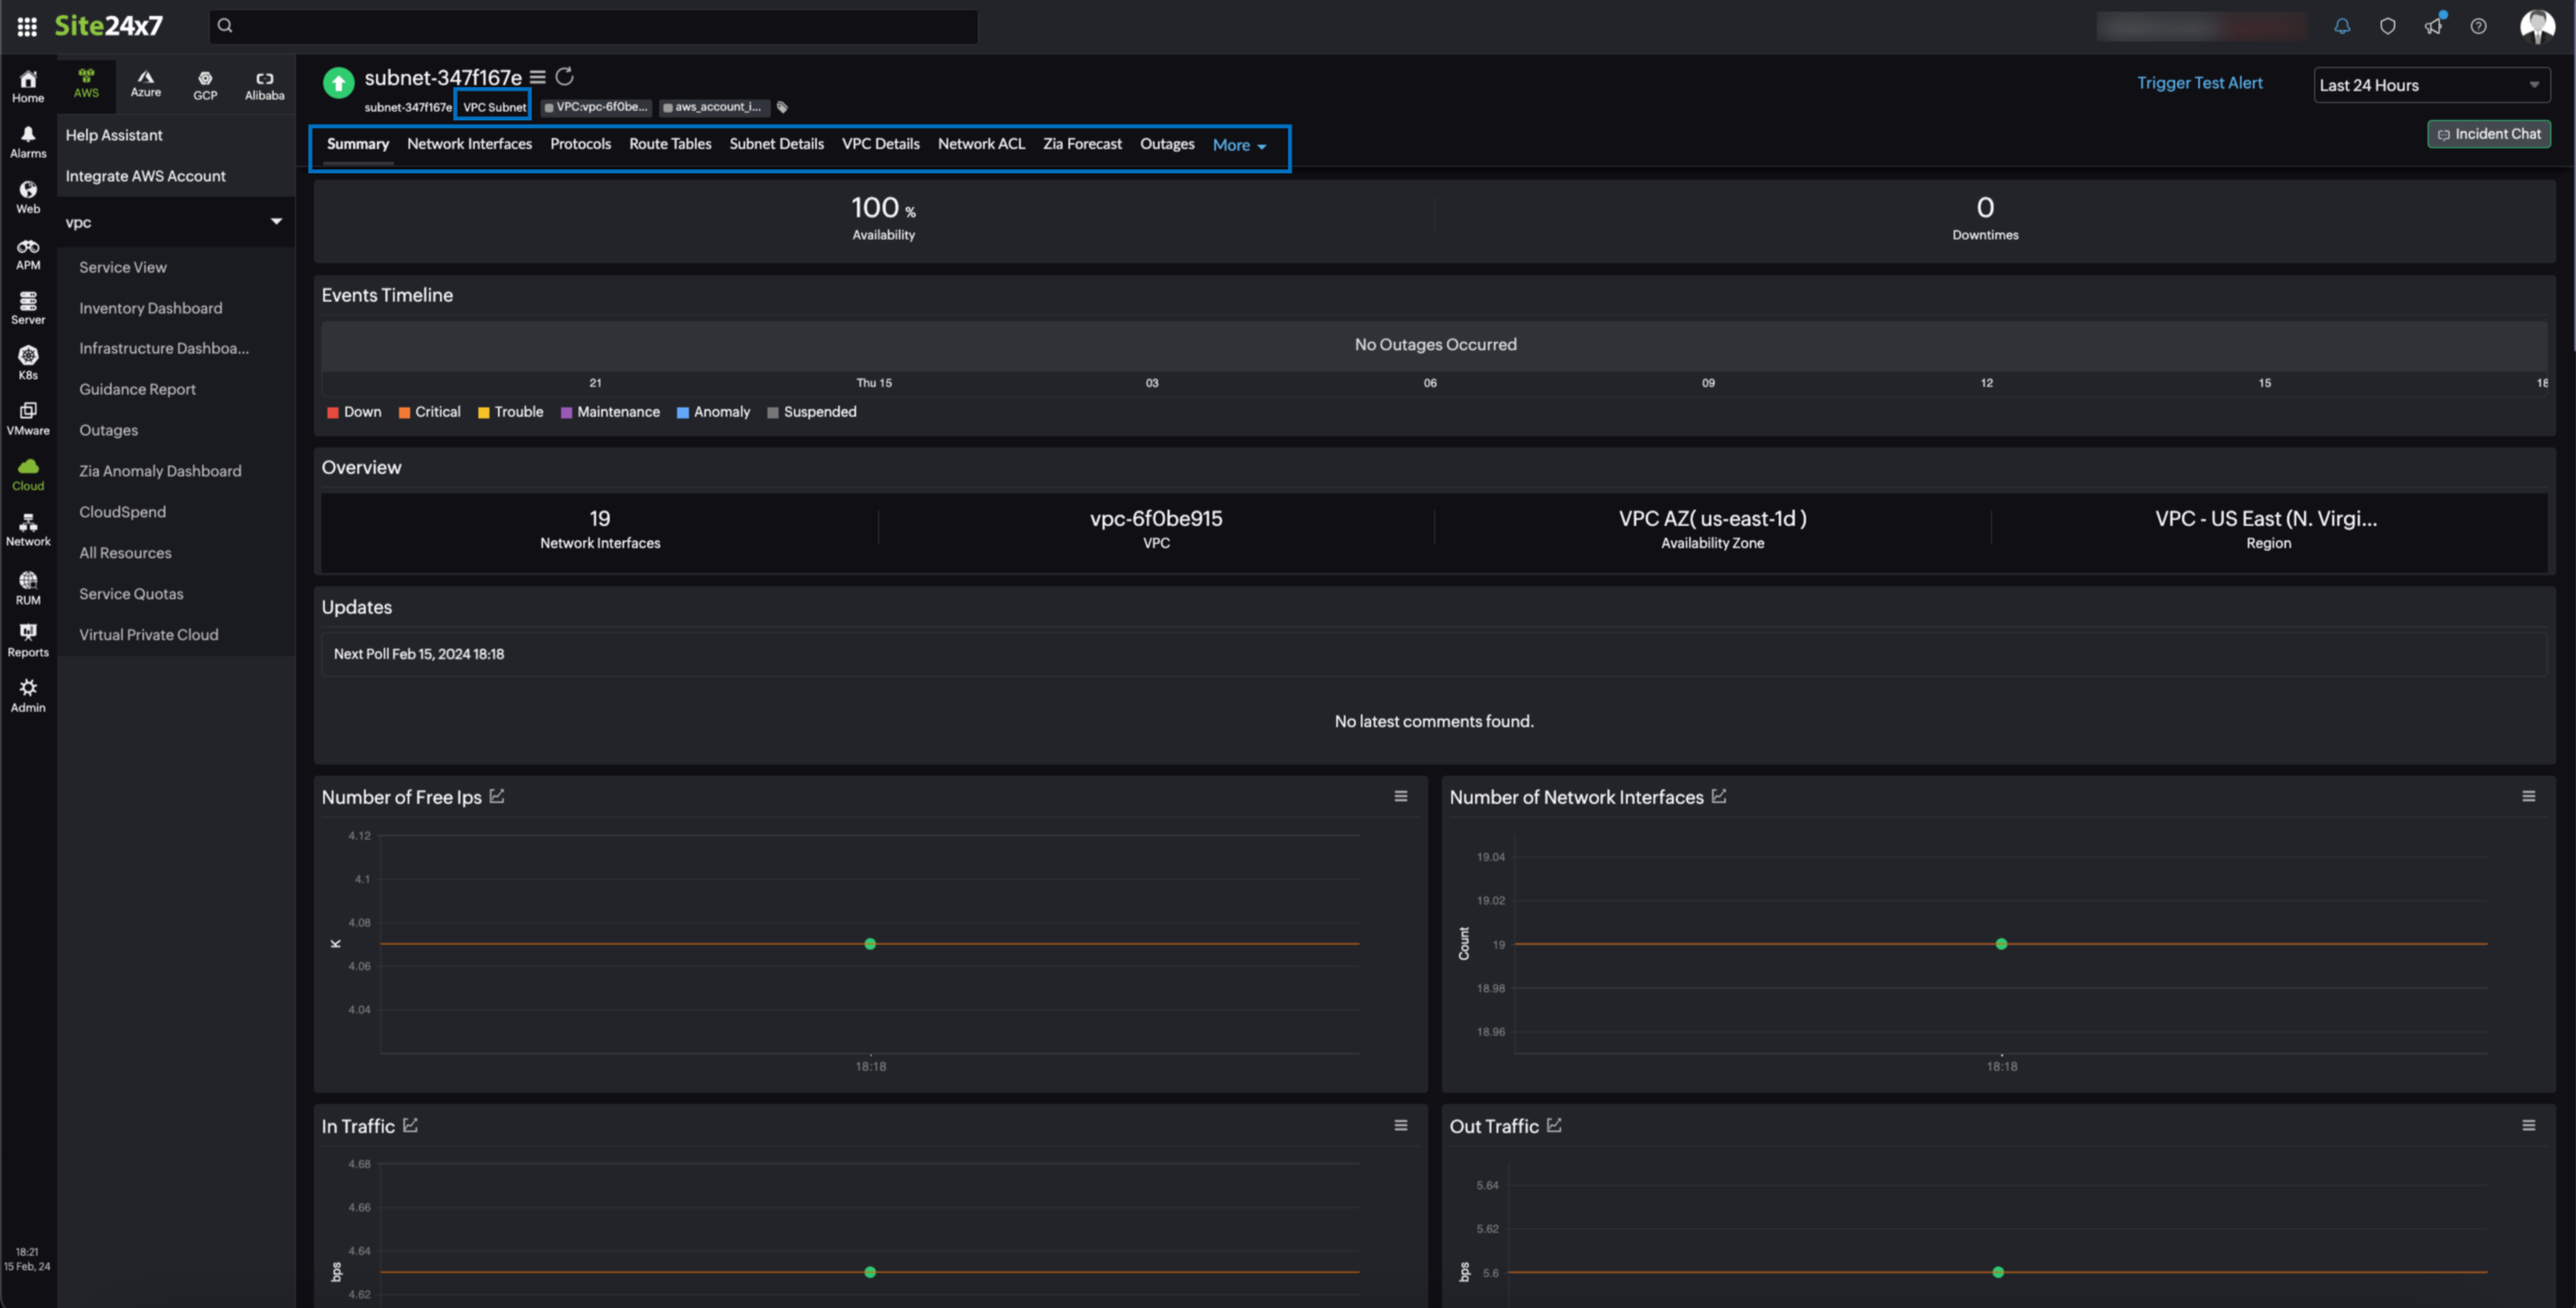
Subnet monitor data
You can view the Subnet monitor data on the following tabs:
Summary
The Summary tab displays an overview of the Subnet monitor along with the number of child monitors. You can also view the data for metrics such as Number of Free IPs, Number of Network Interfaces, and In Traffic.
Network Interfaces
The Network Interfaces tab displays the Network Interface monitor's inventory data.
Protocols
The Protocols tab displays the top 10 protocol chart by volume along with the volume data of all the protocols.
Subnet Details
The Subnets tab displays the Subnet monitor's inventory data.
VPC Details
The VPC Details tab displays the configuration details of the VPC monitor such as VPC Description, IPv4 CIDR Blocks, and IPv6 CIDR Blocks details.
Route Table
The Route Tables tab displays the Route Table monitor's inventory data.
Network ACLs
The Network ACLs tab displays the details of the network ACLs associated with the Subnet monitor.
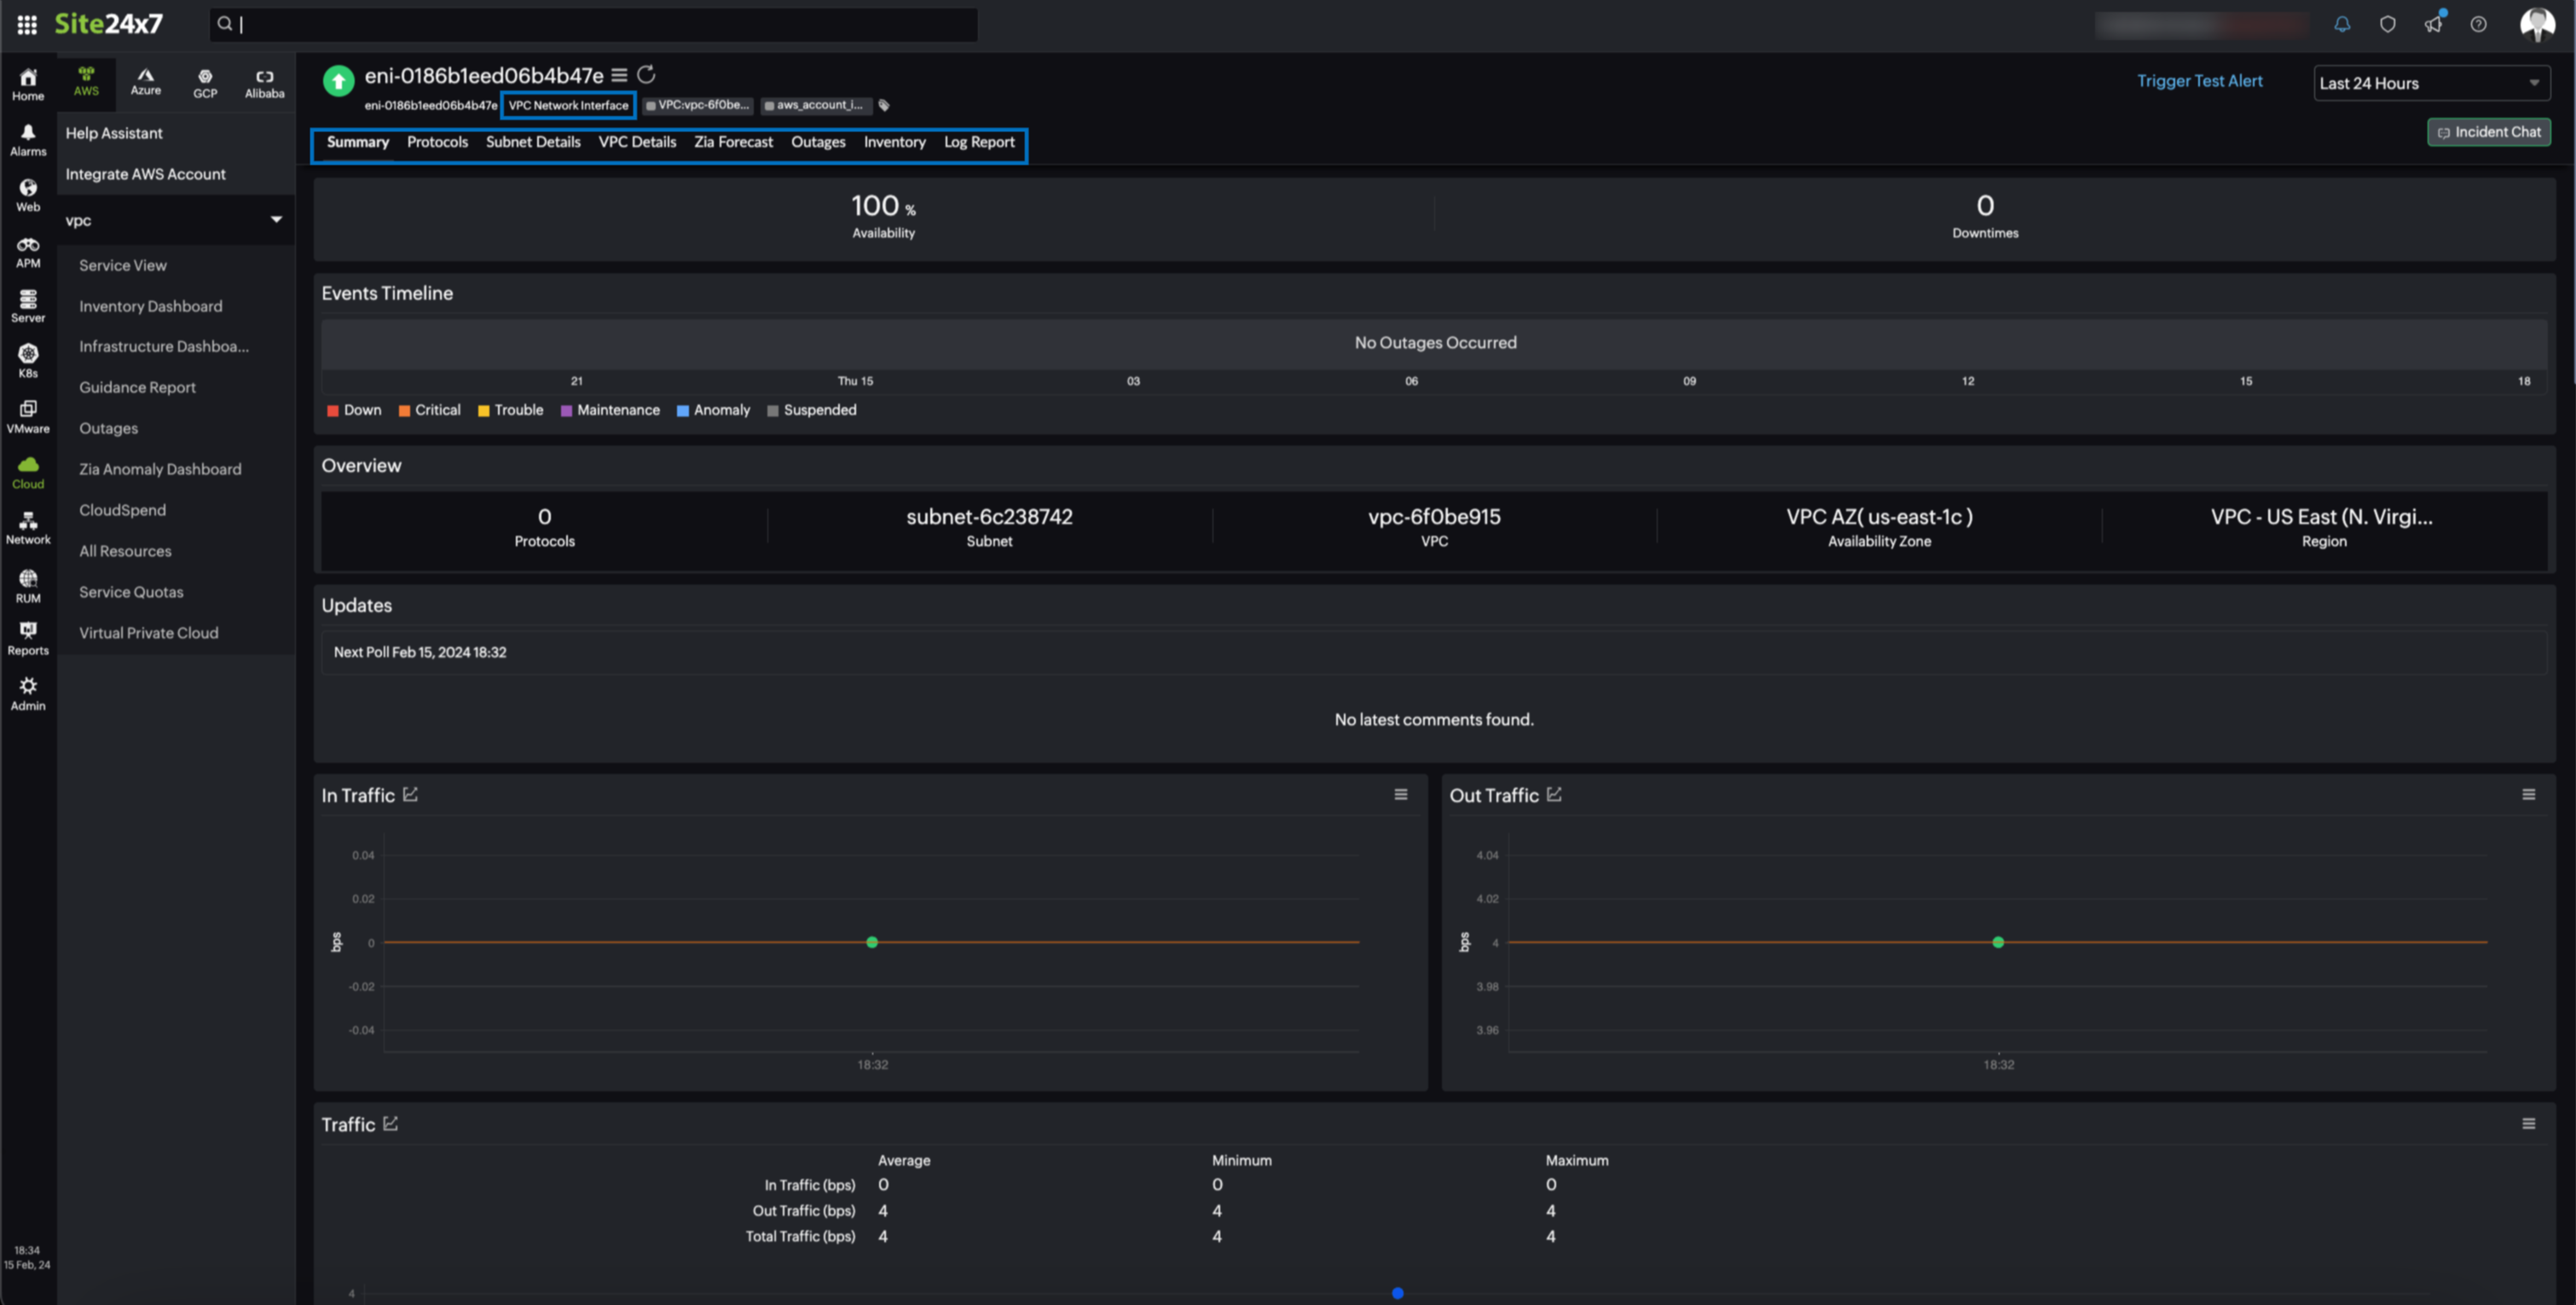
Network Interface monitor data
You can view the Network Interface monitor data on the following tabs:
Summary
The Summary tab displays an overview of the Network Interface monitor along with the number of child monitors. You can also view the data for metrics such as In Traffic, Out Traffic, and Rx Volume.
Protocols
The Protocols tab displays the top 10 protocol chart by volume along with the volume data of all the protocols.
Subnet Details
The Subnet Details tab displays the configuration details such as Subnet Description, Flow Logs, and Route Table of the Subnet associated with the Network Interface monitor.
VPC Details
The VPC Details tab displays the configuration details of the VPC monitor such as VPC Description, IPv4 CIDR Blocks, and IPv6 CIDR Blocks details associated with the Network Interface monitor.
Protocol monitor data
You can view the Protocol monitor data on the Summary tab. The Summary tab displays an overview of the Protocol monitor along with the number of child monitors. You can also view the data for metrics such as In Traffic, Out Traffic, and Rx Volume.
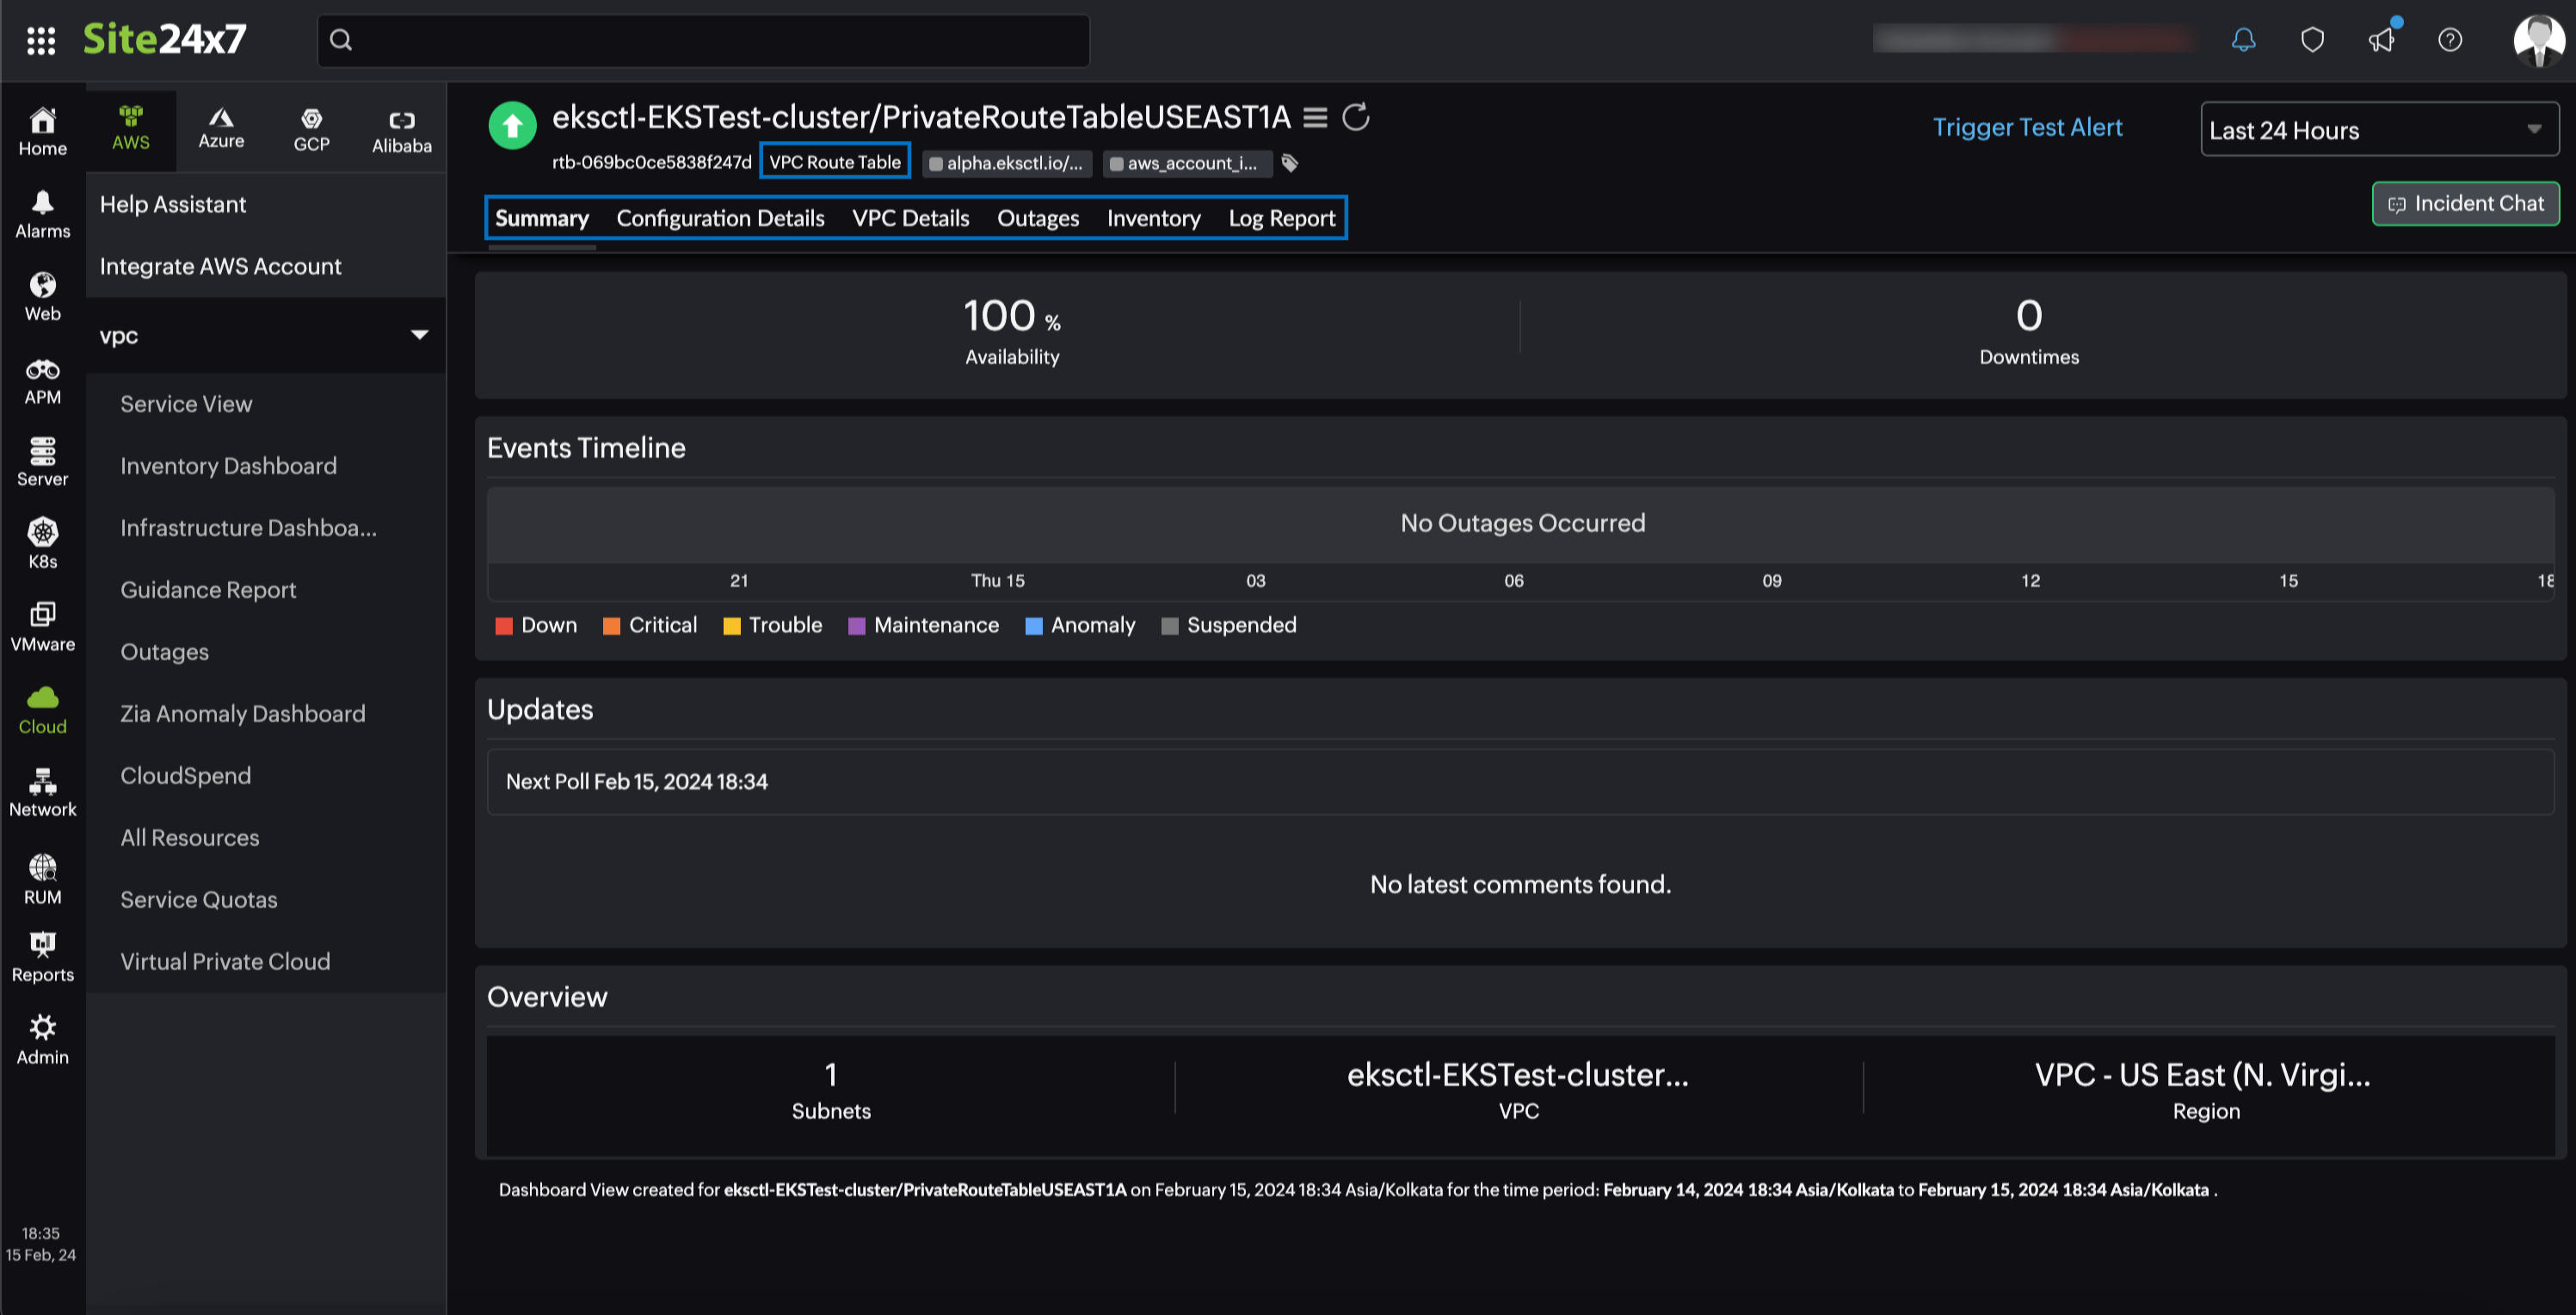
Route Table monitor data
You can view the Route Table monitor data on the following tabs:
Summary
The Summary tab displays an overview of the Route Table along with the number of subnet monitors and parent monitor details.
Configuration Details
The Configuration Details tab displays the configuration details of the Route Table monitor along with subnet association details and route's details.
VPC Details
The VPC Details tab displays the configuration details of the VPC monitor such as VPC Description, IPv4 CIDR Blocks, and IPv6 CIDR Blocks details associated with the Route Table monitor.
-
On this page
- Use case
- Benefits of the integration between Site24x7 and Amazon Virtual Private Cloud
- Setup and configuration
- Permissions
- Polling frequency
- Supported metrics
- Virtual Private Cloud
- Region
- Availability Zone
- VPC
- Subnet
- Network Interface
- Network Interface and Protocol
- Threshold configuration
- Licensing
- Viewing Amazon Virtual Private Cloud monitor data
- Monitor data