MSP Alarms View
Site24x7's MSP control panel has an inbuilt Alarms View controller to manage all monitor alarms across your customers' accounts. It lets you keep a tab on all the monitor issues across your customers' accounts by grouping all alerts by monitor name and severity. However, an MSP will only be able to see monitor alarms from those customer account to which he is associated with. The Alarms list showcases all monitors that are currently in a Down/Trouble/Configuration Error status. Monitors that are in any other status are not listed here. Incase the issue is resolved automatically or the monitor is deleted from your list–the monitor status will render itself as UP inside the monitor details page,until the next poll and the alarm will be removed from the Alarms list. Individual alarms listed in the alarms dashboard will have links to their corresponding alarm specific details page, where information is grouped into Alarm Summary, Outage history, Inventory, log report, and Alert logs for the monitor. The alarm classification based on the severity levels help you to pin-point alarms that need to be given the highest priority and should be addressed first. Additionally, you can assign alarms to any technician according to your need. A manual filter enables you to extract the down and trouble alerts for a specific monitor category. In addition to all these, the alarms can also be filtered based on the alarm acknowledgement status by technicians.
A Mute Alerts option is provided inside the MSP customer account to temporarily disable alerting for a specified time duration. You can suppress alerts for a specific set of monitors, monitor groups, or even for all the resources in your account. Any outage during this time slot will have no alerts triggered (including voice, SMS, email, alerting integrations) for it. All alerts will be suppressed automatically. Nevertheless, the reason for the alerts can be still obtained from the Alert Logs control panel.
Access Alarms List
- Log into your Site24x7 MSP account.
- Click the Alarms icon listed on the dock, then select the customer group from the drop-down in the header to display alarms filtered by the selected customer group.
NoteAn MSP can manage alarms of monitors with statuses (Down, Critical, Trouble, and Configuration Errors) only for the customer accounts with which they are associated based on their customer group.
- A tablular list of all monitors in your customers' accounts that currently show a Down, Trouble, or Configuration Error status alone is shown here.

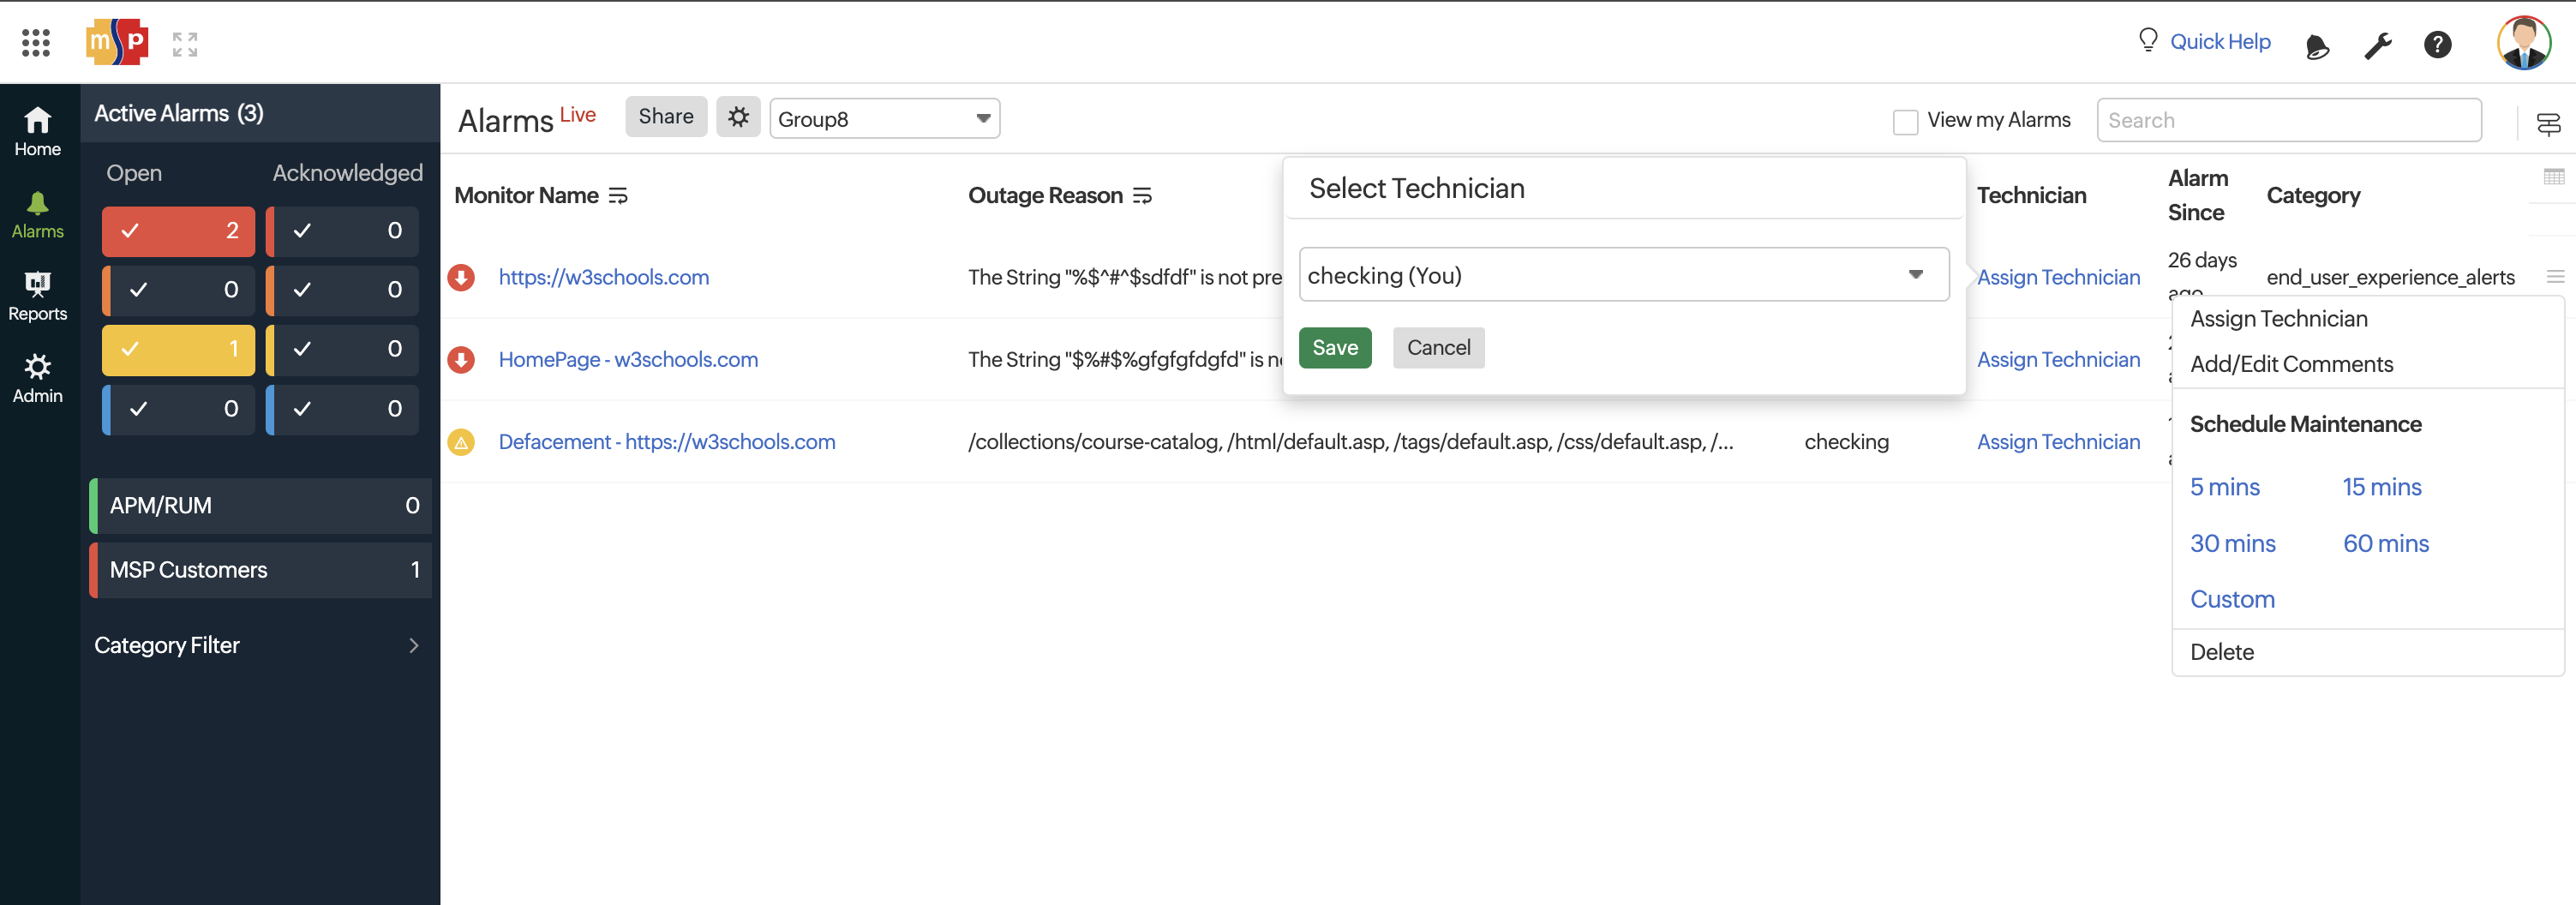
- View details like individual monitor's Name, Message, Main Account Contact Name or (Customer Company Name, if specified), Designated Technician's name, and the exact time since when the alarm is active for the monitor.
- Hover over a preferred alarm in the listing page to click on the
 icon and navigate to the respective monitor's dashboard.
 - Click the
 icon on an alarm ribbon to execute the following actions:
- Assign Technician: Choose a technician (User) from the drop-down list to designate the alarm to that user. Once this is done, click Save.
NoteThe MSP Users associated with the relevant customer accounts alone will be listed in the technician drop-down. Learn how to associate MSP User to a Customer account.
NoteAs and when an alarm gets assigned to a technician, an email will automatically be triggered to the User Alert Group informing about this.
NoteWhen an alert gets assigned to a technician, persistent alerting (part of the notification profile) for that monitor will be automatically suppressed, unless the technician unpicks the alarm.
- Schedule Maintenance: If the downtime is a reccuring activity due to some pre-planned maintenance, you can schedule this downtime as maintenance for a specified period. Learn how to schedule a downtime as maintenance.
- Delete: Submit Delete to remove the alarm from the list. Once the alarm is deleted, the monitor status will render itself as UP inside the monitor details page,until the next poll.

- Assign Technician: Choose a technician (User) from the drop-down list to designate the alarm to that user. Once this is done, click Save.
Filter Alarms
Filter alarms based on their acknowledgment and severity status. Additionally, you can filter your APM/ RUM alarms or Configuration Errors. Users with MSP Admin and MSP Operator roles can filter their alarms using the View my Alarms option.
Features in Alarms page
- The alarms page can now be exported as a CSV file or PDF.
- In the Alarms list view configuration errors.
- Switch between dark or light mode.
Acknowledge Alarms
You can filter the real-time alarms based on their "Acknowledgement Status". All alarms those were "designated to/accepted by" Technicians are marked as Acknowledged Alarms. Those alarms that are not yet assigned to any technicians are marked as Open Alarms.

Alarms Sorting Using Acknowledgement filter
There are two different ways to acknowledge an Alarm. Below we've discussed the same:
Assign Technician:
- Click the
 icon on an alarm ribbon and select "Assign Technician".
 - Choose a technician (User) from the drop-down list to designate the alarm to that user. Once this is done, click Save. This will assign the alarm to the technician.
NoteThe MSP Users associated with the relevant customer accounts alone will be listed in the technician drop-down. Learn how to associate MSP User to a Customer account.
NoteAs and when an alarm gets assigned to a technician, an email will automatically be triggered to the User Alert Group informing about this.
NoteWhen an alert gets assigned to a technician, persistent alerting (part of the notification profile) for that monitor will be automatically suppressed, unless the technician unpicks the alarm. Escalation alerts will not be suppressed during this action.
Pick this Alarm:
- Choose a specific alarm from the alarms list and click on that alarm ribbon.
- You'll be navigated to the relevant Alarm details page.
- Press the Pick this Alarm button listed on the top of the details page to auto-designate the alarm to your name.
- Later you can click Un-pick this Alarm to remove this alarm from your list and re-delegate it to another technician by selecting a user from the Select Technician drop-down list.
NoteThe MSP Users associated with the relevant customer accounts alone will be listed in the technician drop-down. Learn how to associate MSP User to a Customer account.
NoteAs and when you pick an alarm, an email gets automatically triggered to the User Alert Group informing about this.
NoteWhen you pick an alarm, persistent alerting (part of the notification profile) for that monitor will be automatically suppressed, unless you decide to unpick the alarm. Escalation alerts will not be suppressed during this action.

Interpret Alarm Details
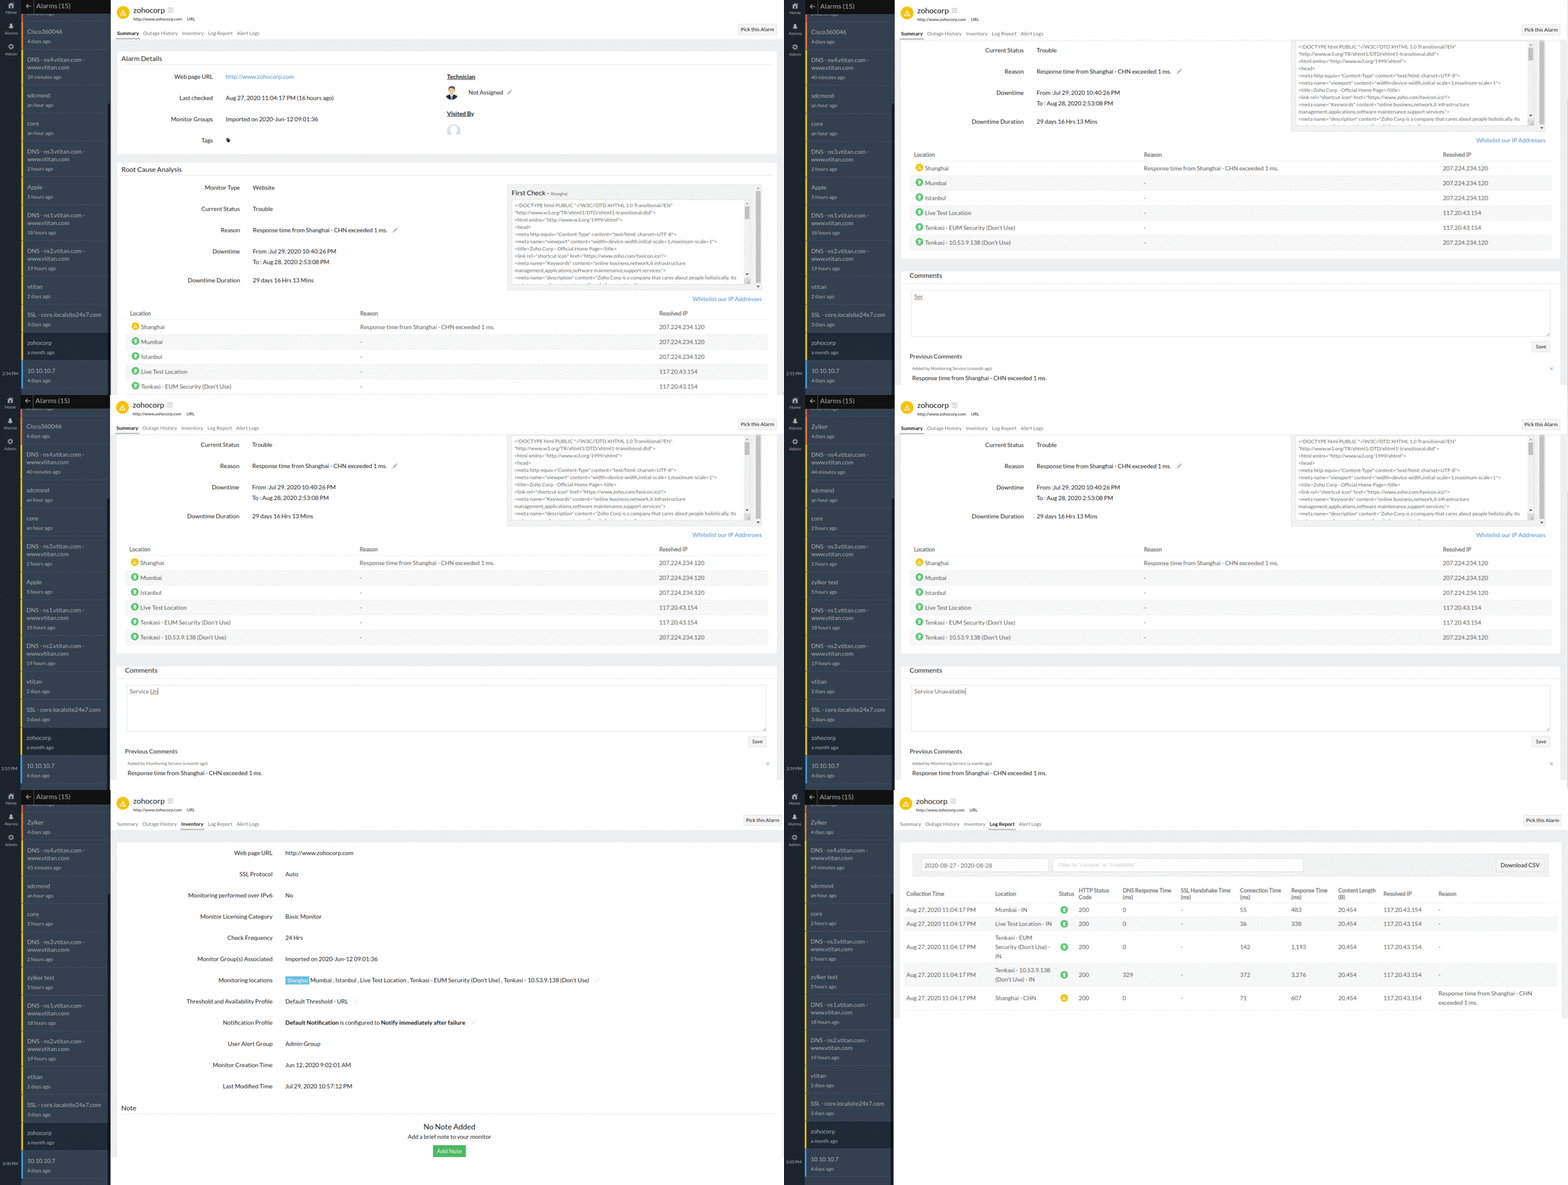
If you decide to click on a specific Alarm ribbon in the Alarms list, you'll be redirected to the alarm details page of that monitor, where you can gather in depth information about the downtime. The Alarm details page displays the critical reports and logs related to the monitor's downtime in a tab-like interface. Using these tabs, you can easily navigate through various sub-pages of the monitor and view your monitor's Alarm Summary, Outage history, Inventory, log report, and Alert logs for the monitor.
Press the relevant buttons listed on top of the dashboard to perform the actions listed below:
- Pick/Un-Pick this Alarm: Click this button to assign an alarm to your name. Learn how to pick up alarm.
- Mark as Maintenance: Click the Mark as Maintenance button to convert the downtime to maintenance period. On marking a specific downtime as maintenance, the alarm will be automatically removed from the Alarms list and grouped under the maintenance list in the monitor details page, until the next poll.
- Schedule Maintenance: If the downtime is a recurring activity due to some pre-planned maintenance, you can schedule the downtime as maintenance by simply clicking this button. However, after the schedule maintenance period has ended, Site24x7 will recheck the status of the monitor. Learn how to schedule a downtime as maintenance.
- Delete: Submit Delete to remove the alarm from the list. The alarm is automatically marked as UP, and will not trigger any more notifications, until the next poll.
Alarm Summary
Alarm Summary offers insight into your specific monitor's Alarm details, Root Cause Analysis report, and Ping Analysis report. Further, you can add comments or even associate your alarm to create tickets in a third-party helpdesk tool. Under the Alarm Details section, you can assign Alarms to a technician by clicking the pencil icon or even view the users who have accessed the relevant alarm details page.
An email consolidating the summary of all the incidents for the monitor along with comments added by the Users will be automatically sent out to the User Alert Group. However, there need to be at least one monitor incident recorded to have this mail triggered. If you do not wish to receive this email, click on the settings icon beside the Mute Alerts button and disable this preference.
This preference can be set only by an MSP Admin and will be refected across all the customers in that account.
Notification Settings
Incident Summary Report: An email, Incident Summary Report, consolidating the summary of all the incidents for the monitor along with comments added by the users will be automatically sent out to the technician and all contacts in the User Alert Group.If you do not wish to receive this email, click on the settings icon beside the Mute Alerts button and disable this preference. You can enable the toggle button to receive the report.
Outage History
It offers detailed insight into the outage history of your monitor. You can view the real-time status, the exact downtime period and duration, and specific reason for the down status. You can also view detailed downtime RCA details. You can access the ![]() to edit comments and share privately, mark a maintenance as downtime, or even delete an alarm.
to edit comments and share privately, mark a maintenance as downtime, or even delete an alarm.
Inventory:
This section captures the basic monitor information and also its various configuration settings including polling locations, poll interval, associated monitor groups, threshold configurations, licensing type, and more.
Log Report:
With our integrated log records for individual monitors, you can get an in-depth knowledge about the various log details for the configured monitor, over a period of time. You can also filter the log based on location and availability. Various data including availability status, HTTP status codes, DNS response time etc. are captured here. You can also export the log report in CSV format.
Alert Logs:
Alert logs help you pip-point the exact reason for a monitor's downtime, and provide details about alert emails sent to your contacts.
