Top server monitoring tools for 2026: A comprehensive comparison guide
IT infrastructure is now hyper-distributed. We are in a scale-in-seconds era and that means, a typical IT landscape is spread across on-premises data centers, public clouds (AWS, Azure, GCP), containerized environments, and edge locations.
With many components comes more points of failure. A single server outage can cascade into customer-facing incidents, SLA violations, and revenue loss measured in thousands per minute.
The decision is not easy
The challenge? With dozens of tools competing for attention, selecting the right platform demands rigorous evaluation across architecture, scalability, ease of deployment, total cost of ownership (TCO), and integration depth.
That is why at Site24x7, we have analyzed the top server monitoring tools on the market, offering IT professionals an evidence-based framework for selection.
The essential criteria for evaluating server monitoring solutions
Before diving into specific tools, IT decision-makers should assess monitoring platforms against these core dimensions:
Unified visibility across IT infrastructure
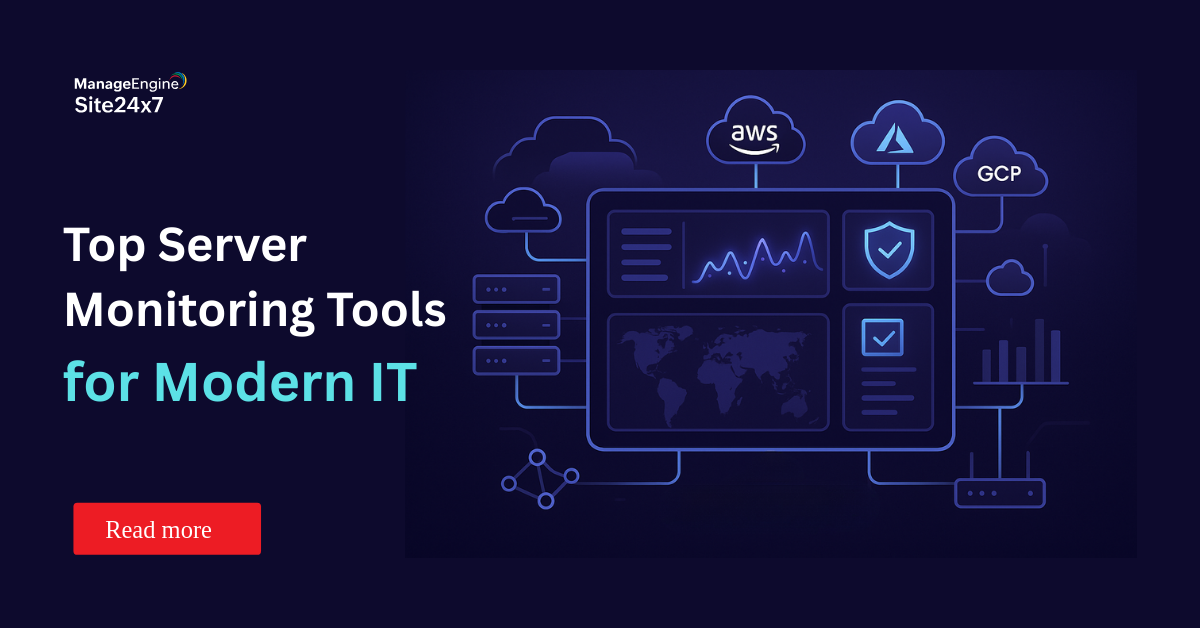
Modern enterprises operate across heterogeneous environments: physical servers, VMs (VMware, Hyper-V), containers (Kubernetes, Docker), cloud VMs, and serverless workloads. The ideal platform consolidates metrics, logs, and traces from all layers into a single pane of glass.
If you are working on different platforms for each environment, your team is already overloaded with tool-sprawl.
Proactive anomaly detection and root cause analysis
Static thresholds generate alert fatigue. Advanced platforms leverage ML to detect dynamic anomalies, predict failures before they occur, and automatically correlate symptoms across infrastructure tiers to pinpoint root causes and reduce mean time to repair (MTTR) from hours to minutes.
File integrity and configuration monitoring
Post-breach forensics reveal that most of the security incidents involve unauthorized file modifications or configuration tampering. Integrated file change detection like monitoring file permissions, timestamps, sizes, and content integrity, is essential for compliance (SOC 2, PCI-DSS, HIPAA) and incident response.
Operational scalability and economics
Monitoring should scale elastically without proportional cost increases. Evaluate per-monitor pricing models, data retention, and whether the platform supports distributed monitoring across multi-site or multi-region deployments. Total cost of ownership matters more than headline pricing.
Integration depth and extensibility
Modern monitoring platforms must orchestrate with incident management tools (PagerDuty, ServiceNow), communication channels (Slack, Microsoft Teams), and automation frameworks (Terraform, Ansible). Robust APIs and webhook support enable custom workflows.
Top server monitoring tools compared
ManageEngine Site24x7: Top-rated, enterprise-friendly, and all-in-one
Best for: Mid-market to large enterprises seeking unified, easy-to-deploy, and cost-effective infrastructure monitoring.
Why Site24x7 stands out
Site24x7 has emerged as the preferred choice for IT teams seeking simplicity without sacrificing depth. Unlike point solutions that only monitor servers or applications, Site24x7 integrates server monitoring, website monitoring, application performance monitoring (APM), network monitoring, and RUM into a cohesive platform—all accessible from a single console.
Pros
- True all-in-one solution: Website, server, app, network, and real user monitoring consolidated into one solution
- Integrated file integrity monitoring: Native file change detection, permission auditing, and compliance reporting
- Ease of deployment: Agent-based setup in minutes; 450+ templates; minimal configuration
- Superior value: Unified licensing eliminates multi-tool cost multiplication
- MSP-optimized: Multi-tenant, white-label, automated billing, and customer portals
- AI-driven insights: Baseline-aware anomaly detection and auto-remediation
Cons:
- UI modernization: Interface could benefit from design modernity
Best for:
- Mid-market SaaS companies consolidating monitoring infrastructure
- Enterprises standardizing on a single platform to replace legacy point solutions
- MSPs and hosting providers seeking white-label, customer-facing monitoring
- Organizations prioritizing TCO efficiency and rapid deployment
Datadog
Best for:
DevOps-first enterprises and organizations deeply invested in cloud-native architectures (microservices, Kubernetes, serverless).
Why Datadog stands out
Datadog dominates the DevOps and cloud-native monitoring space through its purpose-built architecture for dynamic infrastructure. The platform excels at correlating metrics, logs, traces, and application events across distributed systems running in containerized and serverless environments.
Core strengths
- Unified observability stack: Single platform for metrics, logs, traces, and APM—eliminating data silos
- Deep cloud-native support: First-class monitoring for Kubernetes orchestration, AWS Lambda, Azure Functions, Google Cloud Run, and containerized workloads
- Automated service discovery: Auto-maps microservice dependencies, eliminating manual configuration
- Developer-centric workflow: Alert conditions, dashboards, and run book integrate seamlessly into CI/CD pipelines
- 14-day free trial for unlimited hosts
Pros:
- Proficient at dynamic, containerized infrastructure
- Rich integration ecosystem
- Powerful distributed tracing and service dependency mapping
- Strong support for developer teams and DevOps workflows
Cons:
- Steep pricing: Reports of costs escalating rapidly with high-cardinality metrics or long retention requirements
- TCO complexity: Licensing tiers for different data types (metrics, logs, traces) can result in unexpected costs
- Operational overhead: Configuration complexity increases significantly for hybrid (on-premises + cloud) environments
- Learning curve: Advanced features require deep platform expertise
- Limited monitoring extensions: Features like file change detection requires additional integrations or custom development
Dynatrace
Best for: Large enterprises requiring AI-powered root cause analysis, advanced capacity planning, and support for the most complex, mission-critical systems.
Why Dynatrace stands out
Dynatrace's OneAgent and Smartscape technologies deliver the deepest, most detailed monitoring of complex, distributed systems. Its AI-causation engine (Davis) correlates thousands of signals to identify the precise root cause of performance issues.
Core strengths:
- OneAgent architecture similar to Site24x7's Full-Stack Agent: Single agent automatically instruments applications, services, and infrastructure without code modification
- Predictive analytics: Forecasts capacity constraints and performance degradation before they impact users
- Agent-based security: Granular access control and audit trails
Pros:
- Predictive capabilities: Forecasts failure modes and resource constraints
- Granular security: Multi-level access control; improved compliance posture vs. SNMP-based monitoring
Cons:
- Complexity and learning curve: Steep onboarding; requires specialized training and expertise
- Pricing complexity: Licensing tiers and consumption-based metrics make budgeting challenging
- Implementation overhead: Requires significant consulting and professional services for large deployments
Splunk
Best for:
Organizations generating massive volumes of high-cardinality metrics (thousands of unique combinations of dimensions) or requiring seamless integration with Splunk's broader logging and SIEM platform.
Why Splunk stands out
Splunk Infrastructure Monitoring (formerly SignalFx) pioneers streaming analytics—processing metrics in real-time, in-flight, rather than batch processing after collection.
Core strengths:
- Streaming pub/sub architecture: Ingest, analyze, and alert on metrics in seconds, not minutes
- High-cardinality metrics: Efficient storage and querying of millions of unique metric combinations
- Seamless Splunk integration: Correlate metrics with logs and security events across the entire Splunk platform
- eBPF network monitoring: Real-time network topology discovery and service dependency mapping
Pros:
- Real-time streaming analytics: Fast alert-to-actionable-insight pipeline
- Integration with Splunk ecosystem: Correlation with logs, security, and TDIR data
- High-cardinality metrics: Handles unbounded metric dimensions efficiently
- Network observability: eBPF-based network topology discovery and anomaly detection
Cons
- Standalone licensing complexity: Requires separate licensing for metrics vs. logs vs. traces
- Implementation overhead: Complex multi-component architecture (agents, collectors, backends) requires operational expertise
- Steep learning curve: PromQL-like syntax and advanced features demand specialized skills
- Limited file integrity monitoring: File change detection requires custom integrations
- Higher TCO for mixed workloads: Consuming logs, metrics, and traces simultaneously escalates costs rapidly
New Relic
Best For:
Organizations seeking comprehensive observability (metrics, logs, traces, APM) with extended data retention and strong support for full-stack instrumentation.
Core strengths:
- 13-month retention: Store historical data for trend analysis, compliance, and capacity planning
- Unified NRQL query language: Single syntax for querying metrics, logs, traces, and events
Pros:
- Prometheus compatibility: Ingest and correlate Prometheus metrics without switching platforms
- Comprehensive observability: Similar to Site24x7, support for all metrics, logs, traces, and APM in single platform
- Flexible API: Extensive integration options for custom workflows
Cons:
- Pricing opacity: Consumption-based model makes budgeting difficult; per-GB ingestion costs can escalate unexpectedly
- Operational complexity: Configuration requires understanding of multiple data types and ingestion pipelines
- Support costs: Enterprise support carries additional fees; self-service tier less comprehensive
Zabbix
Best for:
Enterprises seeking cost-effective, self-hosted monitoring with deep infrastructure coverage, SNMP support, and distributed multi-site deployments.
Why Zabbix stands out
Zabbix delivers scalable, self-hosted monitoring to 10,000+ organizations globally. It excels at non-cloud infrastructure and distributed environments.
Core strengths:
- Distributed architecture: Native support for multi-site, multi-region deployments through proxy-based federation
- SNMP and IPMI integration: Deep monitoring of network devices, storage arrays, and hardware without agents
- Low operational footprint: Supports MySQL, PostgreSQL, or Oracle as backends; runs on modest hardware
- Custom plugins and extensions: Flexible templating language and trigger evaluation engine
Pros:
- Self-hosted control: No vendor dependencies; full data sovereignty
- Distributed architecture: Designed for multi-site, multi-region deployments
- SNMP support: Deep monitoring of network and storage infrastructure
- Low operational overhead: Runs efficiently on modest infrastructure
Cons:
- Operational expertise required: Setup and scaling demand systems administration and database knowledge
- UI modernization needed: Web interface less polished than SaaS competitors
- Limited cloud-native features: Kubernetes and container support trails Site24x7
- Integration complexity: Custom scripts required for non-standard environments
- Vendor support gaps: Community-driven support; no guaranteed SLAs
The Site24x7 advantage
All-in-one architecture
Rather than stitching together fragmented tools, Site24x7 consolidates infrastructure, application, and digital experience monitoring into one unified solution. This eliminates:
- Tool sprawl and dashboard fatigue
- Data silos between teams
- Redundant integrations and licensing overhead
- Complex inter-tool troubleshooting workflows
- Organizations benefit from a reduction in overall operational overhead when consolidating from multi-tool stacks to a unified platform.
Enterprise wide deployment in minutes
Site24x7's agent-based architecture deploys in minutes on Windows, Linux, and BSD systems. Prebuilt templates for GPOs, AD, and cloud VMs (AWS, Azure, GCP, VMware, Kubernetes) accelerate time-to-value. The intuitive UI requires minimal training, enabling smaller teams to manage large-scale infrastructure.
AI-powered insights at scale
Baseline-aware anomaly detection reduces false positives inherent to static thresholds. Auto-remediation policies enable self-healing infrastructure—restarting failed services and executing runbooks, without manual intervention.
Multi-tenancy and MSP excellence
For managed service providers (MSPs) and cloud service providers (CSPs), Site24x7's multi-tenant architecture enables white-label, policy-driven monitoring of 100+ customer accounts from a single console, with automated billing, SLA reporting, and customer self-service portals.
Scalability without complexity
Site24x7 monitors 250,000+ resources for top enterprise customers through distributed proxy architecture, eliminating single points of failure and enabling monitoring of geographically dispersed, air-gapped, and private networks.
Conclusion: Making your server monitoring investment
The server monitoring landscape has matured from monolithic, single-purpose tools to integrated platforms offering comprehensive observability. The "best" choice depends on your infrastructure composition, organizational maturity, and financial constraints.
Site24x7 emerges as the top-rated, enterprise-friendly, all-in-one solution for mid-market enterprises seeking unified monitoring with integrated file integrity detection, global scale, rapid deployment, and superior TCO. Its unified platform eliminates tool sprawl, accelerates time-to-value, and delivers measurable cost savings.
Your monitoring platform is the foundation of operational excellence. Choose wisely.
Glossary of terminologies used
- MTTD (Mean time to detect): Average time from incident occurrence to first alert; lower is better
- MTTR (Mean time to repair): Average time from incident detection to resolution; lower reduces customer impact
- SLA (Service-level agreement): Contractual uptime guarantee (e.g., 99.9% = 43 minutes downtime/month)
- RCA (Root cause analysis): Process of identifying the underlying cause of an issue, not just symptoms
- Cardinality: Number of unique combinations of metric dimensions; high cardinality = millions of unique metric combinations
- Observability: Ability to understand internal system states from external outputs (metrics, logs, traces)
- APM (Application performance monitoring): Monitoring of software application performance and user experience
- RUM (Real user monitoring): Monitoring actual end-user interactions; contrasts with synthetic monitoring
- Synthetic monitoring: Simulated user transactions to validate application availability and performance
- FIM (File integrity monitoring): Real-time detection of unauthorized or unexpected file modifications
- TCO (Total cost of ownership): Complete cost of owning and operating a solution across 3-5 year horizon
- FinOps: Financial operations discipline for optimizing cloud spending
- eBPF (Extended berkeley packet filter): Kernel-level technology enabling real-time network observability
Last Updated: December 10, 2025
Author: IT Infrastructure monitoring Team
Comments (0)