How to Automate Alerts for Critical Directory Changes with Site24x7 Server Monitoring
This should never happen.
The Hidden Risk Living in Your File System
Here's something that keeps IT teams up at night: the file system is often the last place teams think to monitor, yet it is frequently the first place problems manifest.
Think about it.
- Configuration drift? It shows up as changed files in /etc/.
- Security breach? Attackers drop payloads into directories.
- Application misbehavior? Runaway log growth.
- Backup failures? Missing files in your backup staging directory.
Yet most monitoring stacks obsess over CPU, memory, and network metrics while treating the file system as an afterthought. That is a mistake enterprises have learned to correct the hard way.
Over the past few months, we have been refining directory monitoring suite by Site24x7 and we thought you would love to learn more about this feature.
The aim is to prevent events from escalating into incidents. What follows is everything we have learned from you: the configuration nuances, the threshold strategies that actually work, and the automation patterns that have saved multiple teams countless hours of firefighting.
What you should've been actually monitoring and why it matters
Before diving into implementation, let us get clear on what Site24x7's Directory Check feature captures. Understanding these metrics is essential because misconfigured thresholds are almost worse than no monitoring at all. They create alert fatigue and train teams to ignore warnings.
The agent tracks several key measurements for each monitored directory:
- Directory Size: Measures the total bytes consumed by all files within the path. This seems obvious, but the recursive option changes everything. A shallow check on /var/log tells you very little; a recursive check reveals whether your application logs, system logs, and audit logs are collectively consuming more space than expected.
- File Count and Folder Count: Tracks the number of objects within the directory structure. These metrics are goldmines for detecting anomalous behavior. A sudden spike in file count often indicates a misbehaving application creating temp files, while unexpected new folders might signal unauthorized access or misconfigured deployments.
- File Age Metrics: This is where things get interesting. The agent tracks both the oldest and newest file modification times. Why does this matter? Consider a backup directory that should receive new files every six hours. If the newest file age exceeds that threshold, your backup job has silently failed. Conversely, an audit log directory where the oldest file should never exceed 90 days can alert you when log rotation breaks.
Here's a mental model to use when deciding what to monitor:
Directory Purpose | Primary Metric | Secondary Metric |
Log directories | Size growth | File count |
Config directories | File count change | File age |
Backup staging | File age | Directory size |
Upload directories | File count | Size growth |
Deployment targets | Folder count | File count delta |
How to set up Directory Monitoring, the practical way
Step 1 is choosing what to monitor.
The temptation is to monitor everything. Resist it. Each directory check consumes agent resources and contributes to your metric volume. Instead, focus on directories that meet at least one of these criteria:
- Business-critical data lives there (uploads, exports, staged files)
- System stability depends on it (logs, temp files, cache directories)
- Security-sensitive content resides there (configs, credentials, deployment files)
- Operational processes expect changes (backups, data feeds, sync targets)
For a typical web application server, a monitoring shortlist usually looks something like this:
- /var/log/: System and application logs
- /var/log/nginx/: Web server specific (if applicable)
- /etc/nginx/: Web server configuration
- /opt/myapp/config/: Application configuration
- /var/lib/mysql/: Database files for size tracking
- /tmp/: Temporary files for cleanup validation
(Tip : you can automate running a script to clean up temp files once they reach a threshold with Site24x7 agent) - /home/deploy/releases/: Deployment directory
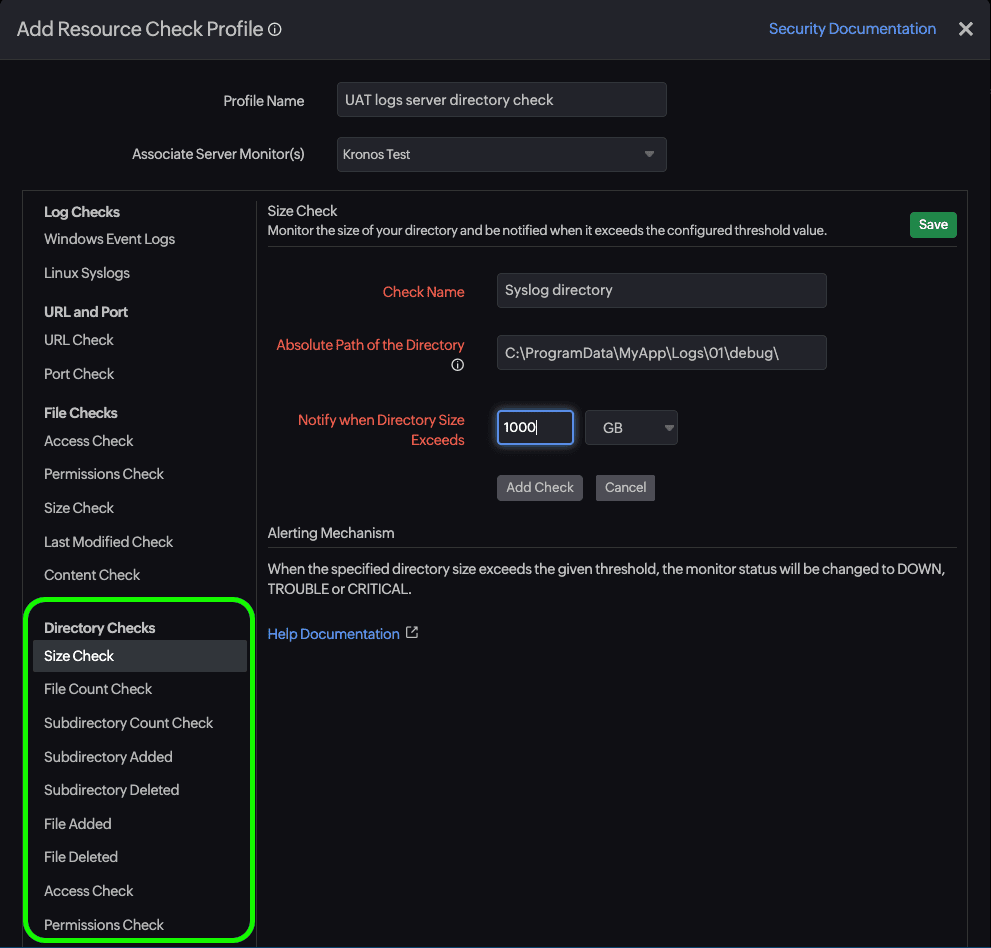
How to configure the monitor
Navigate to your server monitor within the Site24x7 console and locate the Directory Check option under the Resource Check Profiles. You will need to specify the absolute path and decide on a few key parameters.
For a directory with thousands of files across deep nesting, you might want to monitor specific subdirectories individually rather than enabling recursion at the parent level.
Polling interval requires balancing responsiveness against resource consumption. For most production scenarios, a five-minute interval hits the sweet spot. Critical security-sensitive directories might warrant one-minute checks, while stable configuration directories can tolerate 15-minute intervals without meaningful detection delay.
Here's a configuration pattern that most enterprises agreed to qualify as a standard across most deployments:
Production Log Directories
- Path: /var/log/application
- Interval: 5 minutes
- Purpose: Detect log accumulation and rotation failures
Configuration Directories
- Path: /etc/myapp
- Interval: 15 minutes
- Purpose: Detect unauthorized configuration changes
Temporary/Upload Directories
- Path: /tmp/uploads
- Interval: Five minutes
- Purpose: Detect stuck uploads and cleanup failures
Threshold configuration: Where most teams go wrong
This is where directory monitoring either becomes genuinely useful or becomes just another source of noise. The default thresholds Site24x7 suggests are starting points, not solutions. You need to tune them based on actual behavior patterns in your environment.
The baseline-first approach
Before setting any thresholds, let the monitor run for at least a week without alerts enabled. Study the resulting graphs. You are looking for:
- Normal operating ranges: What's the typical size? typical file count?
- Cyclical patterns: Does the directory grow during business hours and shrink overnight?
- Growth trends: Is there steady linear growth? periodic spikes?
A directory that fluctuates between 2GB and 8GB daily due to log rotation needs different thresholds than one that grows steadily at 500MB per week.
Threshold Strategy by Directory Type
Log Directories benefit from size-based thresholds with headroom calculations. Rather than alerting at arbitrary numbers, calculate thresholds based on disk capacity:
- Trouble Threshold = (Available Disk Space × 0.15) + Current Baseline Size
- Critical Threshold = (Available Disk Space × 0.25) + Current Baseline Size
This approach ties your alerts to actual risk i.e., disk exhaustion, rather than abstract size limits.
Configuration Directories should trigger on change, not size. These directories are typically small and stable. Any unexpected file count change deserves investigation. Set a tight tolerance:
- Trouble: File count changes by ±1 from baseline
- Critical: File count changes by ±3 from baseline
Yes, this seems aggressive. That's intentional. Configuration changes should be deliberate and expected. Unexpected changes warrant immediate attention.
Backup and Data Feed Directories flip the typical alerting model. Instead of alerting when values exceed thresholds, you are alerting on staleness:
- Trouble: Newest file age exceeds expected interval × 1.5
- Critical: Newest file age exceeds expected interval × 3
If backups should run every six hours, a warning at nine hours and critical at 18 hours gives you time to investigate without waiting for complete backup failure.
Ready to eliminate blind spots in your files and folders?
Elaborate observability stacks around the metrics that are easy to collect while ignoring the attack vectors that actually take systems down is not a rare sight anymore.
Directory monitoring is not glamorous. It does not generate impressive real-time visualizations or wow stakeholders in quarterly reviews. But it catches the silent killers: the runaway logs, the configuration drift, the failed rotation jobs, and the unauthorized file drops. These are things that sophisticated APM tools miss entirely or ask you to pay more for it.
Site24x7's server monitoring suite gives you directory monitoring along with a plethora of other battle-tested necessities. The baseline-first methodology, the tiered threshold strategy, and the automation integrations: these patterns emerged from real incidents, real outages, and real lessons learned the hard way.
Start your Site24x7 free trial or a personalized demo and configure your first directory monitor today. Your SREs and sysadmins will thank you for not getting PagerDuty alerts at 3 a.m. for a preventable disk space incident.