The role of IT monitoring in digital transformation for Australian SMEs

The importance of visibility over the entire technology environment cannot be overstated. This ensures the health, performance, and security of the technology that organizations rely on to deliver digital services. Technology leaders in Australia’s SMEs understand and appreciate the strategic benefits of monitoring.
The strategic benefits of IT ...
Status page examples

The visual presentation and aesthetics of a company's online presence are crucial in shaping the company's reputation and customer trust. One such vital aspect is the status page, which is often overlooked yet highly influential. By examining the best status page examples, we can see how a well-designed status page not only conveys reliabil...
Top IT challenges Australian SMEs must tackle for better operational efficiency

As digital intensity rises in Australian SMEs, technology teams face significant challenges. The complexity of expanding technology architectures, the proliferation of applications, and reliance on diverse cloud environments exponentially increases the demand for IT support and operations. This intricate tech landscape introduces coordination ch...
A guide to choosing the best cloud infrastructure monitoring tool

The cloud is a complex network of interconnected resources—virtual machines (VMs), containers, serverless functions, and a web of data flowing between them. With so many elements, it becomes challenging to ensure continuous uptime for all cloud services while also maintaining optimal performance and security.
Cloud monitoring tools assist in thi...
Top 7 best practices for monitoring your OpenShift environment

<p>To ensure your OpenShift environment is healthy and stable, consider these seven tips:</p><p>Ensure your OpenShift platform is available at all times. Your monitoring tool is invaluable during these periods. Utilize node redundancy, multiple pod replicas, and load balancing. Regularly back up your monitoring data and configurations, and adjus...
The pros and cons of cloud-native infrastructure

Cloud computing has emerged as a game changer for organizations looking for agility and flexibility from their IT infrastructures. A cloud-native infrastructure further enhances this by using microservices, containers, and DevOps for a scalable foundation for modern applications. However, like any technology, it has its advantages and disa...
Digital transformation and cost savings: How AI benefits Australian SMEs to enhance digital experience

Small and medium-sized enterprises (SMEs) play a crucial role in Australia's economy. Despite this, they face significant challenges in the current economic climate, including rising costs, higher interest rates, and the need to stay competitive in a rapidly-evolving digital market. For these businesses, cutting expenses is the top priority, clo...
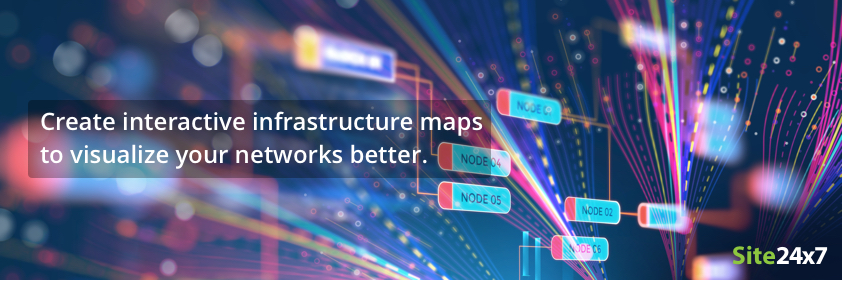
Understanding Network Mapping with Site24x7
With cloud solutions becoming mainstream and hybrid workforces becoming the norm rather than the exception, organizations need to stay nimble and agile for network access that can occur anytime, from anywhere. A thriving organization has a flourishing network that extends its arms globally, yet delivers high speed and performance without any com...
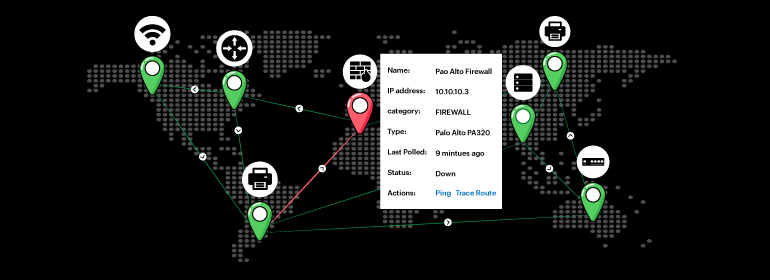
Infrastructure maps: Build and visualize custom network topology maps to dissect network outages and performance bottlenecks in your IT stack
<p>The ability to visualize your IT infrastructure from end to end is critical in fostering successful operations and delivery of service. Being a network admin, you need to keep a close eye on all your network devices, whether they're across the globe or inside your data centers. However, this is difficult to do without an actual location-based...
Breaking down network complexities with network mapping
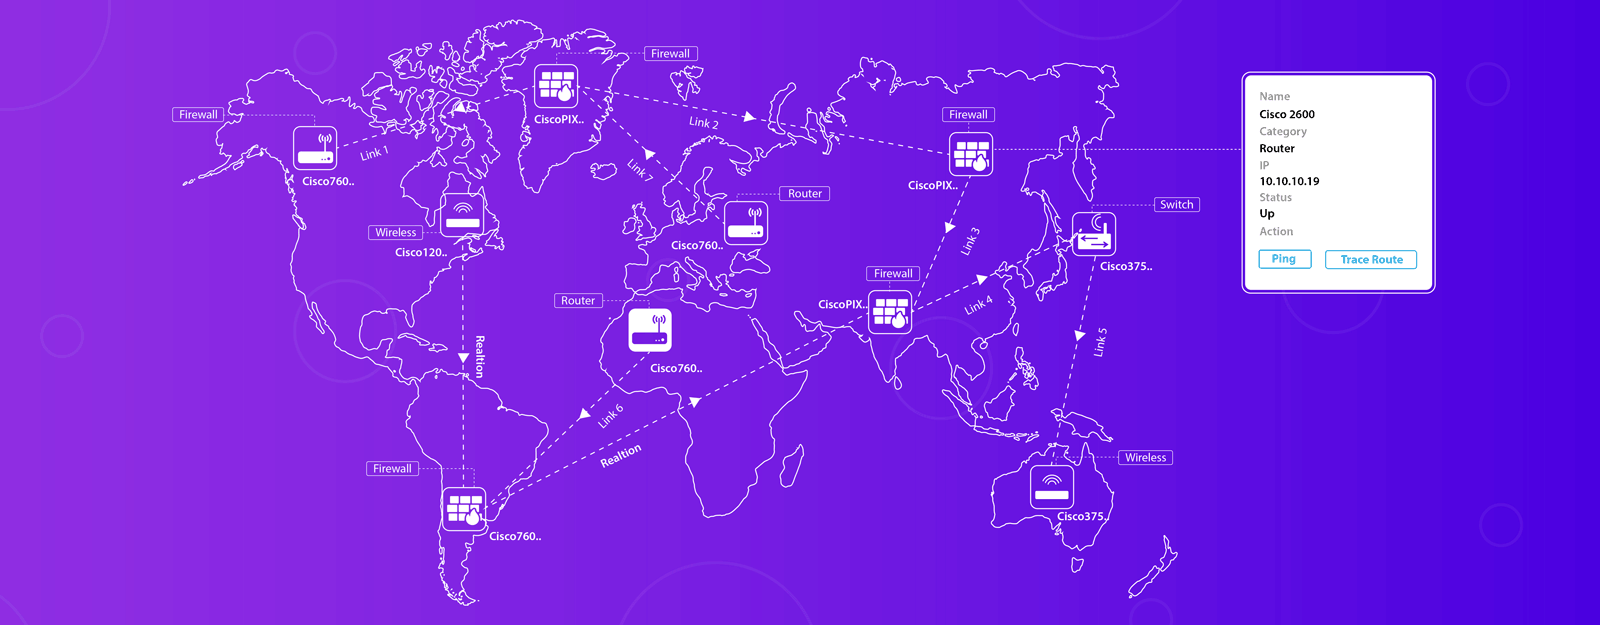
<p>Is it possible for network engineers to gain complete visibility over all the components in an enterprise network? With new devices constantly connecting and disconnecting, creating a mental image of the entire network is impossible.</p><p>This is where network mapping comes in. Using Simple Network Management Protocol (SNMP), you can see a v...