The APM Insight dashboard has a lot more to offer than a view of application statuses. Here are three actionable items designed to make the dashboard easy to use.
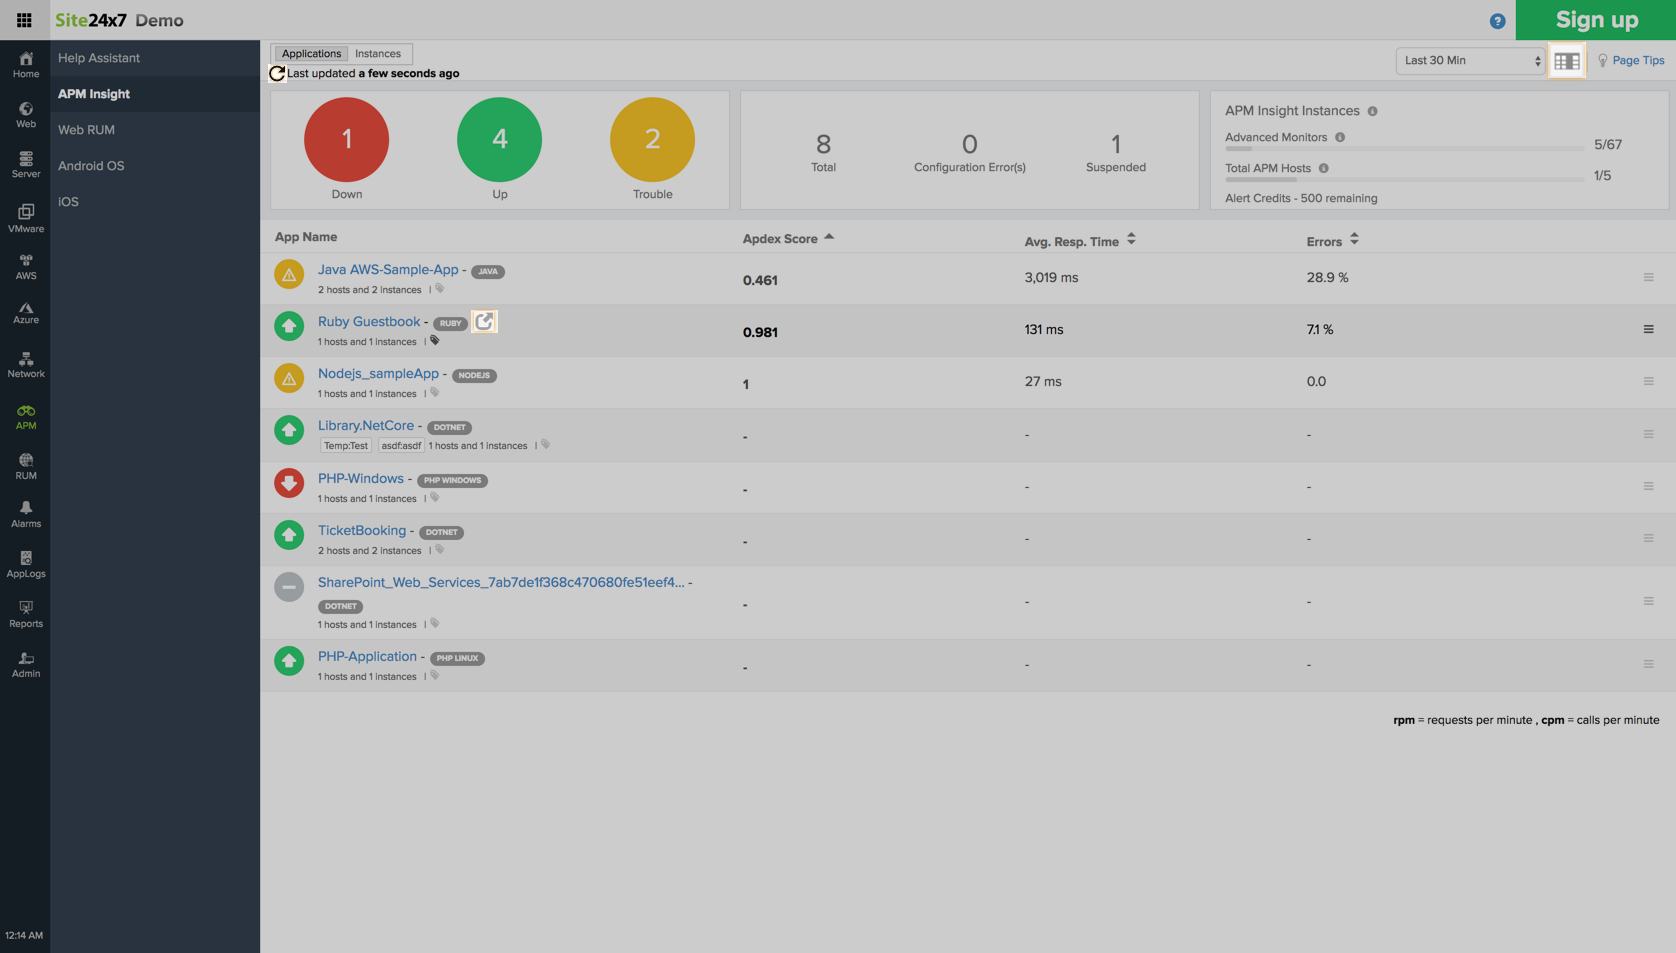
1. Did you know that you can customize metrics that appear for each application in your dashboard? In the APM Insight tab, you'll find this icon ![]() in the top, right corner. By clicking on this icon, you can choose which metrics (Apdex, average response time, throughput, error, and fatal count) need to be displayed for each application in the dashboard.
in the top, right corner. By clicking on this icon, you can choose which metrics (Apdex, average response time, throughput, error, and fatal count) need to be displayed for each application in the dashboard.
2. You can view your application metrics in a separate window with the pop-up icon for individual applications. Clicking on this ![]() icon opens the application metrics in a separate tab.
icon opens the application metrics in a separate tab.
3. You can also manually refresh ![]() your application status; by default, the application status is automatically refreshed every five seconds, but you can do this manually if needed.
your application status; by default, the application status is automatically refreshed every five seconds, but you can do this manually if needed.
Happy monitoring!