People often talk about "finding the needle in the haystack," and this phrase definitely applies when debugging error transactions. In general, not all transactions are successful; issues like corrupted data formats, external component failure, and improper exception handling can contribute to transaction failure.
So how exactly do you identify these transaction problems using APM Insight? With error transactions, inspecting each transaction's stack trace comes in handy.
Stack traces are like reports-they list all method calls along with their trace of execution and line number. Analyzing the stack trace of a particular transaction helps in contextual debugging. You can identify the methods and lines of code causing the error, which makes debugging a breeze.
Ready to get started with debugging? You can view each transaction's stack trace under Error Traces in the Traces tab.
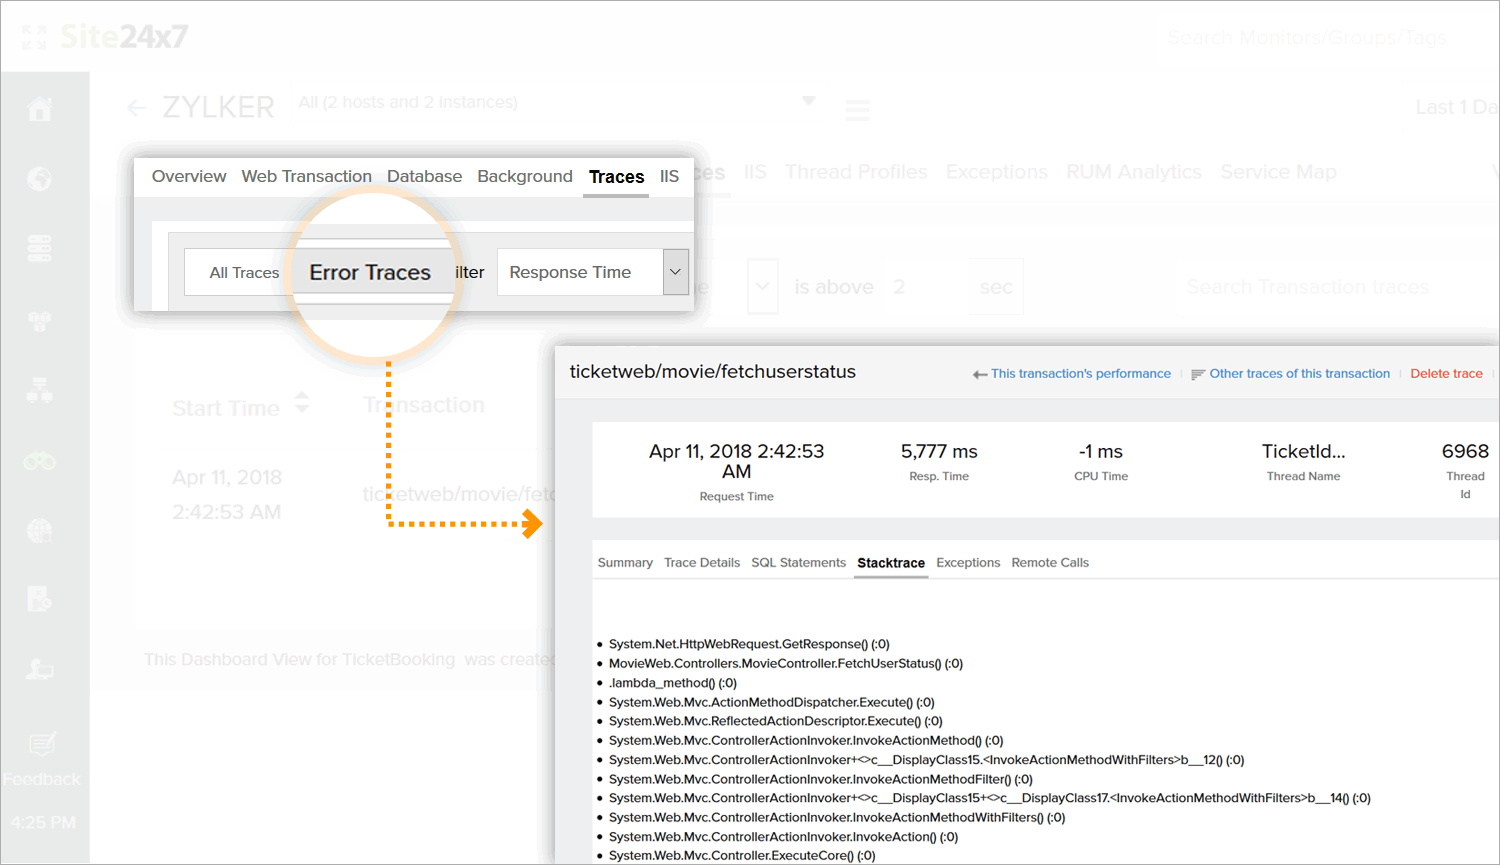
Note: Stack traces are only available for error transactions.