2020 was by no means a normal year. The pandemic had made every business turbulent with growth trends of many businesses going south. But when the backs are against the wall, mankind stands up, unites, and comes back with resilience. We could see all these traits come out in every business and ours was no different.
The situation altered the course of our product roadmap that we'd set for 2020. 2021 gives us the opportunity to implement some of the common features that many customers have asked for. Here's what you can expect this year.
Enhancing the overall product experience
We are in the process of making subtle yet significant changes in the look and feel of the product to give a better contrast to the UI, solving some of the usability issues in search, and bring in filters in key areas of the product to enhance the overall client experience.
Alert Management
We are continuing to put our efforts into enhancing user and alert management. As a natural progression, we are bringing in dynamic thresholds profile based on our existing AI/ML based anomaly detection engine. This will help technicians trim down configuring static thresholds which can be error prone and reduce alert fatigue as businesses adopt modern technologies for scalability.
We are in the process of modernizing the alerting capabilities and addressing the missing pieces where the notification profile will become the common alert configuration section.
Incident Response
To address the shift timings of IT operations teams and to ensure alerts are sent to the right people at the right time, and with the right notifications, we are bringing in on-call scheduling.
For a DevOps/IT Teams to instantly collaborate, share crucial information amongst teams for troubleshooting an incident and to refer to previous resolutions, we will be introducing this year, features that will help teams collaborate through various communication mediums with various stake holders, fix the problem and help reduce the MTTR. Stay tuned for a detailed announcement on this.
Infrastructure, cloud, and virtualized environments
Every modern business runs on the cloud and digitalization has only fast-forwarded the adaptation. We will be bringing in unique cloud monitoring features like service quota monitoring that will help customers with uninterrupted provisioning of resources in the cloud. We will be bringing in more observable metrics to monitor from serverless platforms across clouds this year. We will continue to invest in our guidance report with new recommendations targeting savings.
With digital experience of employees becoming crucial to run the business in this new normal, focus on bringing newer capabilities to monitor employee endpoints which will help sysadmins analyze problems faced in end-user environments will be introduced this year.
We are also bringing in some of the enterprise features our customers have asked in the hypervised environment space.
AppLogs
We've started work in bringing all alerting capabilities that are available in other monitors including third-party integrations, notification profile, etc. Making AppLogs dashboards as part of the custom dashboard framework will be on the agenda for this year. With DevOps ecosystems maturing in the cloud and logs becoming a major part of troubleshooting critical issues, we will be bringing in capabilities to ingest DevOps toolset log types and log types which will address the CDN and DNS technology stack. You can leave a request for any new type you want us to support here.
Network Performance Monitoring
We are continuing to work on the configuration manager which can track change management, and configure backup which helps in making the network disaster-proof. We will work on bringing in the latest network devices as templates and provide out-of-the-box support so that customers can monitor the latest devices natively. Switch stack monitoring for Aruba and Dell switches will be made available this year.
APM Insight and Real User monitoring
We are re-focusing our efforts on building an overall experience in the digital experience monitoring space. W.r.t this we are bringing in enhancements into real user monitoring that will help sysadmins proactively troubleshoot areas that affect the digital experience of end-users. In addition to this, focus will be given in integrating AppLogs which will help DevOps/SRE contextually troubleshoot an incident and get deeper root cause analysis with logs that were generated during an incident from various sources that the application spawns out. We will also continue to focus on integrating with the DevOps Toolchain ecosystem.
Our roadmap is subject to change based on market trends, but our focus to provide you with the best possible product experience in terms of features based on feedback remains steadfast.
We’re thrilled to see you engage with us in our community, and we’d love to see you continue posting requests. We will be considering requests made here with higher priority. This allows us to streamline the requests better and have more community involvement on how to shape that feature. This will help us help you in giving the product that gets your work done. Thank you all for keeping your faith in us.
Do checkout our product roadmap 2021 for Site24x7 CloudSpend and Site24x7 StatusIQ.
From all of us at Site24x7 and Zoho, we wish you all a safe and happy new year.
Team Site24x7.
Hi Jasper,
Re Alert Management
There were quite a few improvements suggested in relation to alert management in 2020 roadmap. I don't see any such improvements yet in alert management, which is desperately needed.
Also, currently there is no way to know if I modify a Threshold value of any existing threshold definition, how many monitors will be impacted by that change. It will be nice to have a button, call it something like, "show linked monitors", which will show what are the monitors currently using that threshold definition. If I have that visibility, I could potentially prefer to create a new threshold definition instead of modifying the existing threshold, if the situation warrants so.
Re AppLogs
1. It will be nice to have a bulit-in applog category for device/monitor inventory in site24x7 (similar to one you already have for "Infrastructure Events"). This will allow us to quickly find all attributes associated with one or group of monitors, which is not easy to find as of today.
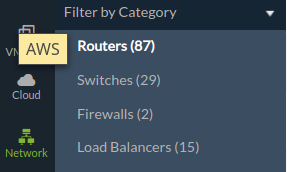
For example, if I would like to list the routers (87) in the screnshot below that has attribute of NOT "RFS Cisco ISR4331" type, Its not easy to find out! Applog can be a very handy tool in such case. There are many more use cases like this.

2. I don't know if there is a way to add items into a custom dashboard based on the value of a performance counter. For example, I want to display in a dashboard only those routers whose one of the performance counters (in my case its the backup link performance counter) value is 5. Which, I don't think is possible currently. However, if you allow the performance counter metrics to be available in applog, then I can easily search those conditions and create a dashboard I need. Its as simple as that.
There are endless possibilities with applog. Its a powerful tool, pl do expose more and more information via applog. That will help all customers.
3. Allow extraction of fields dynamically during search operation and then perform stats on those fields.
For example, I have below logs collected for a log type (syslog or similar) where the $message$ contains the following. I want to capture the device name that appears after the word "false" in the message body and perform some stats on those. I can't do this currently.
I know I can set the field extraction at the time of collecting the logs, but in that case I have to create hundreds of log types, which is not feasible.
This notification is generated if the Interferer device configured for IDR Alarm. Hex-STRING: 24 B6 57 43 3D 40 Gauge32: 0 58565 31 1024 2 Hex-STRING: B2 B2 7D 31 54 E4 false WAP-COONAM01 Hex-STRING: B2 B2 7D 31 54 E4
Re Network Performance Monitoring
1. It will be nice to have an additional column in the tabular performance counters tab for each for the tables to show the current threshold set to raise an alert. In the screenshot below I have setup some thresholds, but there is no way to find out which ones unless I click on each of the entries action button, which no one wants to do it! Its a pain.
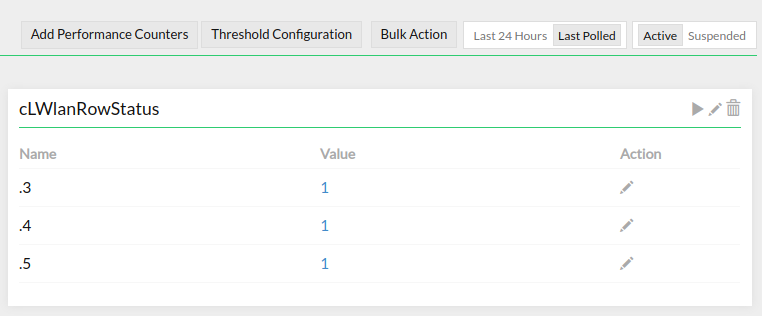
Same applies for non tabular performance counters too! Display the current threshold settings below the counter value.
2. In relation to adding/editing a threshold parameter for a performance counter (as well as tabular performance counters), add a "Bulk Action" button (like the one shown in the screenshot) to modify performance counter thresholds of some or all eligible (display only the monitors that has that particular performance counter metrics) monitors.

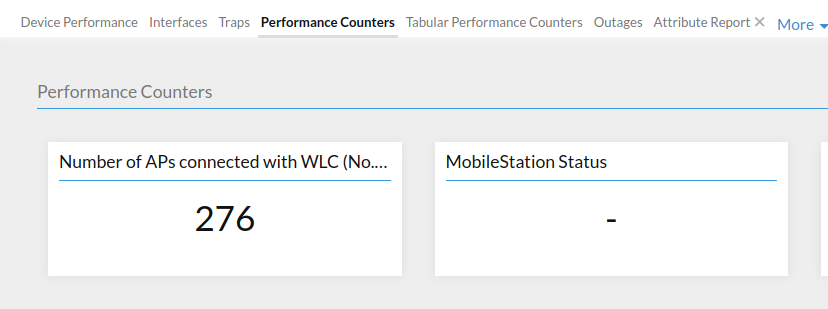
3. When creating an alert from performance counter, the != option is missing. In my case I want to raise an alert when the performance counter value is not equal to 5. Unfortunately, I can't do this with the existing options.

4. It would be nice to capture description field from network device interfaces and display it in one of the columns under network interfaces tab. When there are 100s of network interfaces monitored in a switch, it hardly make any sense what Gi5/2/39 means. But if the description were captured and displayed, it would have showed up something like "uplink to core switch" which would make much more meaningful sense to me. I know, currently I have to hover my mouse for every single interface to find out the description of that interface, who has time for it? A separate description field will be very handy.
5. We we rediscover interfaces on a network device, allow a new category called "suspended". Currently there are only two categories: "New" and "Modified". There is no way to manage suspended interfaces currently within site24x7. For example, if I would like to reactivate some of the suspended interfaces, and want to ensure that those interfaces are up before re-activating, the best way to achieve this is "Rediscover interface", as long as the suspended interfaces shows up there with their current admin and operational status.

Kind Regards,
Ash
Dear Ash,
Thank you for taking the time to list out your requirements with great details. Really appreciate the effort.
Alert management
You had mentioned last year about escalation. We have started work on this already. Due to unforeseen delays we couldn't bring it in.
We have consolidated all requests and are enhancing other options in the notification profile. Sharing moqup of what you will be seeing in the notification profile. This is subject to change but you will be seeing enhancements that will address many alerting capabilities that were requested this year.

Applogs
We will be working on this after analysing how this can be supported in our end. We will get back on this.
Network Monitoring
Understand the difficulties faced, we will address them. Our team is analysing on how to support them.
-Jasper
Product Manager, Site24x7
A few more features would be nice to have:
Dashboard:
1. Currently we cannot publish business view as a dashboard. It would be nice to have the capability to publish business views as a dashboard. I have a group called "Critical Infrastructure" which contains various groups, sub-groups and monitors. I would like to present this view to business via a dashboard without someone logging into site24x7 console, which currently I cannot do.
2. The sub-groups in business view does not appear in alphabetical order. I think it appears in the order they have been added to the parent group. Which is not necessarily the order customer wants to view. Allow either arranging the sub-groups in alphabetical order or the way customer wants to view. Either way it will work for me, but not at its current order.
Applog:
1. Currently the only action possible via Applog is to raise an alert. It would be nice to have more actions such as call an API that would help automation.
2. The pie chart in the applog dashboard shows % value inside the pie chart. Its much easier for people to roughly estimate the % of a pie by looking at the pie. Thats why its a pie chart! It would be nice to have an option to display the numbers or the % value or both - allow the customer to choose their preferred options.
3. Allow customer to choose the log retention period for more than 30 days (at least 12 months). Customer should have that flexibility as long as the total volume of data in a monthly billing cycle does not exceed the lic capacity.
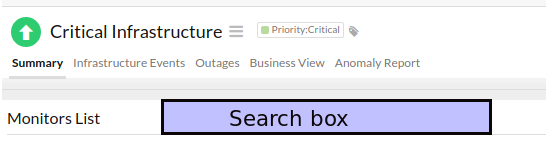
Monitor Group:
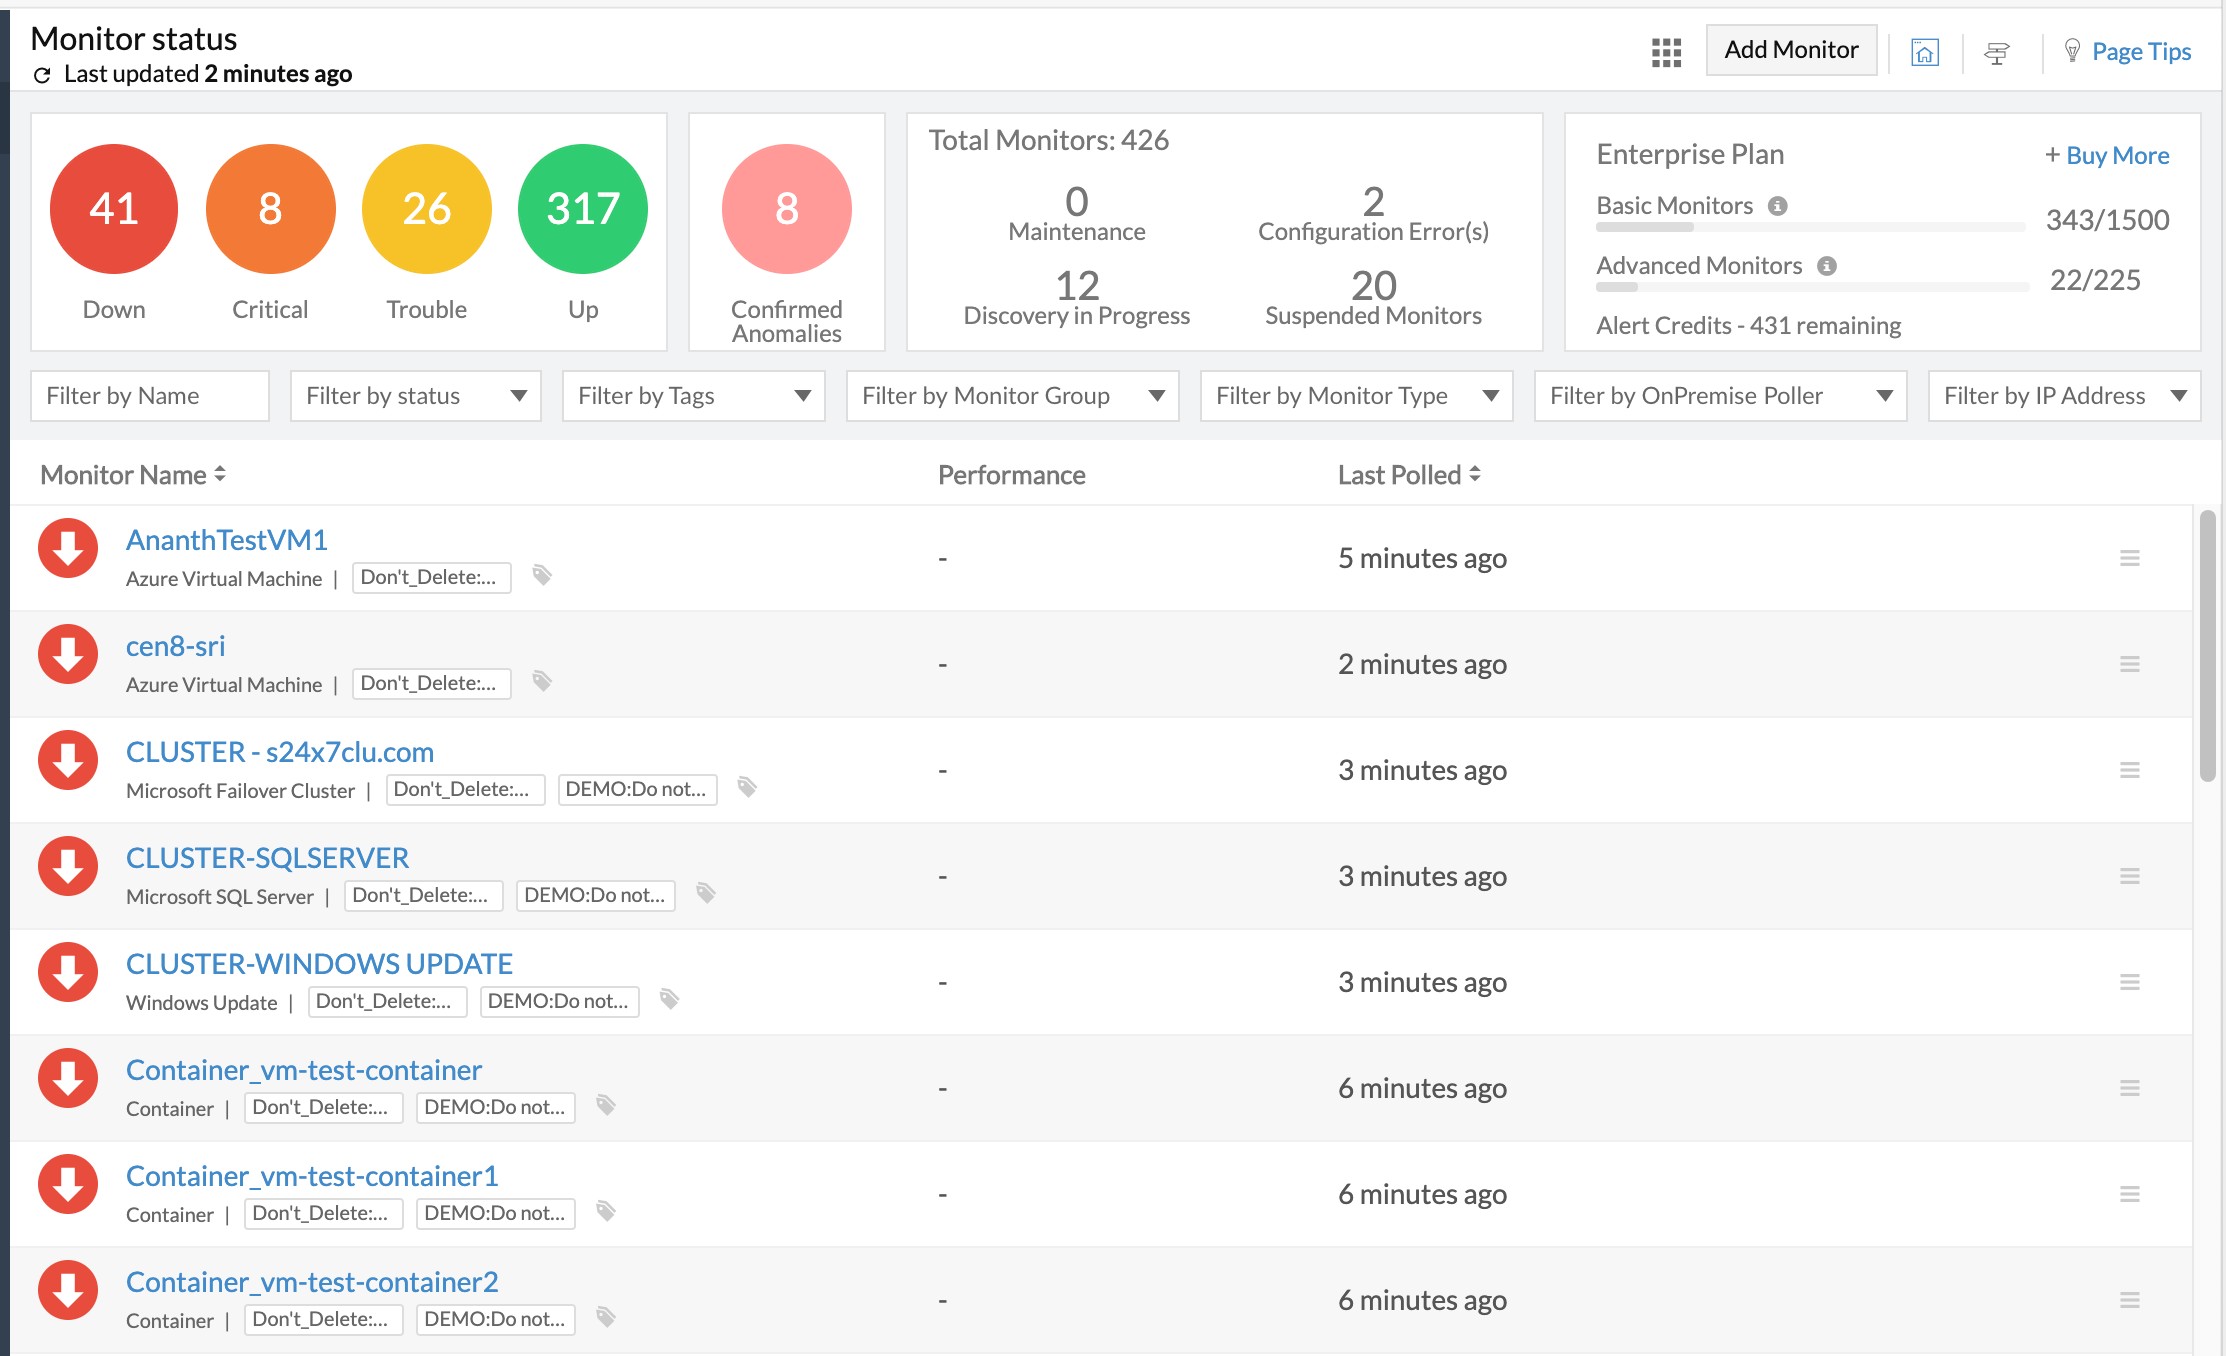
In certain monitor groups we have a large number of monitors (specifically the groups which contains sub-groups). In such situation its hard to find which monitor is part of it (as I have to scroll down through the list). A search box (as shown in the screenshot) would help.
Thanks for your valuable feedback Ash.
Dashboard:
>>>1. Currently we cannot publish business view as a dashboard. It would be nice to have the capability to publish business views as a dashboard. I have a group called "Critical Infrastructure" which contains various groups, sub-groups and monitors. I would like to present this view to business via a dashboard without someone logging into site24x7 console, which currently I cannot do.
It is possible to publish the business view in custom dashboard, Ash. To do that navigate to Home > Custom dashboard > Create a new by clicking on "add new" or open an existing dashboard and edit the dashboard > Here choose current status widgets in Widget Category > Select Monitor Group as the resource type > Select the monitor group for which you want the business view for > Drag the business view widget which will be available with the following icon  .
.

>>>2. The sub-groups in business view does not appear in alphabetical order. I think it appears in the order they have been added to the parent group. Which is not necessarily the order customer wants to view. Allow either arranging the sub-groups in alphabetical order or the way customer wants to view. Either way it will work for me, but not at its current order.
Will work on this, Ash.
Applog:
>>>1. Currently the only action possible via Applog is to raise an alert. It would be nice to have more actions such as call an API that would help automation.
>>>2. The pie chart in the applog dashboard shows % value inside the pie chart. Its much easier for people to roughly estimate the % of a pie by looking at the pie. Thats why its a pie chart! It would be nice to have an option to display the numbers or the % value or both - allow the customer to choose their preferred options.
>>>3. Allow customer to choose the log retention period for more than 30 days (at least 12 months). Customer should have that flexibility as long as the total volume of data in a monthly billing cycle does not exceed the lic capacity.
For point 1, we are working on to get it automation and 3rd party integration. Will be available in Q1.
2. We will check if this usability can be addressed.
3. Our team we will work on it Ash.
Monitor Group:
>>>In certain monitor groups we have a large number of monitors (specifically the groups which contains sub-groups). In such situation its hard to find which monitor is part of it (as I have to scroll down through the list). A search box (as shown in the screenshot) would help.
Search in monitor groups, we will bring it in with filters (and across the product), Ash its in our plan for this year.
I did not know that a Business View can be added into a dashboard. Thank you for explaining, Jasper.
I have added, but.......
I only have one business view in the dashboard, positioning of the view in the dashboard looks strange and has got some serious flaws. Pl see the attached screenshot (its the screenshot of the entire screen). Basically, I cannot present this view to business in its current form! (sorry for being harsh, but when I serve my customer I pay attention to quality. If I am not satisfied, how can I present that to my customer?)
1. Why so much space left in the top, whereas, I can't even see the label in the bottom, (probably because the main big circle is centred on the screen)?
2. Second level nodes are cut from the view in all directions, left, bottom, right. Literally, I can't see majority of the 2nd level nodes, except a few.
3. Its hard to distinguish colours (green or Amber; I think red is solid, which is great!), specially when its projected in the ops area monitors and someone is looking at it from a few metre distance. May be options to display with thicker lines and/or solid circles would help.
4. The font size is also not customisable (I think), that makes it harder to read it from a distance.
5. It will be good to have an option to mark sub-group as down (i.e. marked as red colour), not only based on the number of nodes down in that sub-group (which is already in place), but also based on the number of its sub-group is down. For example, I may have a sub-group called "storage" (under the main group called "Critical Infrastructure"), which may not necessarily contain any nodes, but it will contain a number of subgroups, such as "FC-SAN", "Fabric", Cloud-Storage", "ISCSI-Storage" and so on. I would like to have an option (I know some people may not prefer that way) to mark "Storage" as red, when any of its sub-groups are marked red. That way it will make it much easier to track issues following the red tree to the branch and the troublesome leaf nodes.
6, When I hover my mouse to any of sub-groups, it pops out with a bigger view, which is great. But I cannot get rid of that popped out view until the screen is refreshed or I hover mouse to another sub-group, which will then popped up. Ideally, it should come back to normal size view, when I click on any empty space within the dashboard.
7. When I want to modify the monitors in a group/sub-group, it is not easily identifiable what are the monitors are already part of that group/sub-group. I have almost 2000 monitors in our tenant. Imagine, how difficult it is to find out the existing nodes in that group/sub-group out of 2000! I know I can filter by "sub-group type", but still its a lot of monitors to scroll through. It would be nice to have a check box button to click and view the existing monitors in that group/sub-group.

8. Ideally the dashboard should look like exactly what I see in the business view, the one like below - where I can see all the elements, just cover the full screen with the view that shows all the sub-groups by default, that's all. Leave the pan and zoom functionality for user to choose.

Kind Regards,
Ash
BTW, I love the events timeline feature in the business view, when clicked on any of the events, it pops up the relevant group and shows exactly which node was down. Its a very handy tool. Well thought feature, Site24x7 team!
It would be nice to have this feature available in dashboard view too!
You could also include the time window in the popped up view, i.e. when a node/monitor is highlighted that is currently not green, it should show its in that condition since .... e.g. "trouble since 3:00 AM 30/01/2021". That information helps business!
Kind Regards,
Ash
It will be good to have an option to mark monitors of my choice as favourites and then list them into a separate tab called "Favourites", as shown in the screenshot below.
When we have 2000 monitors in action, its good to have some favourites to save some time. I know there is search option in top right corner, but with keyword search, it still lists quite a big number of monitors. Even worse for me is, we have adopted automated deployment of resources in AWS, and thus in our 4 accounts (DEV/UAT/TRN/PROD) all the resource names are same, Thus, makes it much harder to find a particular monitor. In addition to favourites, search/filter by tag will also be helpful.

Kind Regards,
Ash
Dear Ash,
Apologies for the late reply. We are working on a filter feature from which you can filter monitors from the list pages (like in home tab, monitor type list pages, alarms tab etc). I believe that would work for you.
Here is an early stage moq.
We will take your case of saving the list of monitors.
I hope this will solve your problem.
-Jasper
PM, Site24x7
That looks great, Jasper.
However, this filter feature needs to be available in other areas too, and not only "monitor status" page. e.g. when I want to add a performance metrics of an AWS lambda function in a dashboard, I will encounter similar issues. Same applies to when I want to add that monitor into a monitor group etc etc.
Kind Regards,
Ash
Hi,
any news about the roadmap topic "Incident Response"?
Regards,
Torsten
Yes, Torsten. We are in the testing phase for this. On-call, notification profile enhancement, and grouping of alerts will be released together.
-Jasper
Not sure if anyone else has requested before, a few cosmetic changes will make customer life a little bit easier.
1. Tags - when I have hundreds of tags, it will be nice to have a way to filter them to find a shorter list to find out which is user defined and which ones are system defined tags. There is a current search windows which allows to type free texts, but does not differentiate between system tags or user defined tags e.g. I cannot search only user defined tags that contains word xxx.
Even better option is only show the unique tags (tag name only, NOT values) in the admin --> Tag page with the option to filter either system defined tags or user defined tags or both, and then when someone clicks on a specific tag, then it open ups a new window showing all values for that particular tag. In that way its much cleaner and easy to mange tags.
2. Configuration rule - In the summary page it shows all the rules and actions associated with those rules, which is great. But what is missing is whether the "stop executing other rules" has been ticked or not (it affects heavily how the rule will be applied). It will be good to have another column to show that information, instead of I am clicking on every single rule to find out that information.
3. Should allow customer to back list certain types of monitors in the account. E.g. in our environment, developers are allowed to install SQL express, which is automatically picked up by Site24x7 as a new monitor and causes unnecessary alarms. Current choice is suspend that monitor after we find out an alarm. Its reactive. Rather, it would be much better solution not to discover that particular type of monitor in the first instance, just by blacklisting it in the account level.
Kind Regards,
Ash
Dear Ash,
I've noted down your requests in our backlog.
Point 1: We are making our global search more advanced with multiple filtering with query-like search. We'll see how to make a filter for user tags. (It's in the development stage. We'll update once we have solid working version).
Point 2: This should be done faster. We'll try to get this done asap.
Point 3: This should be like excluding while discovering, possible in the agent itself. May you can add that in the ci/cd pipeline. We'll check the feasibility of this.
-Jasper
Site24x7, PM
Is there any update on the Incident Response feature? This article states there was going to be a detailed announcement?