Understanding OpenTelemetry and the way forward
OpenTelemetry is a vendor-neutral approach that enables DevOps and developers to collect performance metrics in a standardized manner. Currently a Cloud Native Computing Foundation (CNCF) sandbox project, OpenTelemetry was conceived by merging OpenCensus, Google's open-source method of collecting metrics and traces, and OpenTracing, a vendor-neutral API to collect traces.
In short, OpenTelemetry is a vendor-neutral observability framework that aids developers and DevOps with collecting and correlating metrics, logs, events, and traces, commonly known as the pillars of observability.
Need and Evolution
According to Atlassian DevOps Trends Survey 2020, an average of 10.3 tools are used by DevOps teams across organizations, of which around 80% constitute application performance monitoring tools. Also, 36% of the surveyed people say they prefer using a breed of tools over one common toolchain in their pipeline.
While using multiple monitoring tools, the collected telemetry data becomes siloed, making correlation difficult, especially in case of critical failures. On the other hand, relying on a single toolset limits the scope of monitoring and makes it harder to expand or customize to the organization's needs.
Hence it becomes vital to decouple telemetry data from the tool collected to remove the limitations posed on the analysis of the data. This is where OpenTelemetry plays a crucial role.
How does OpenTelemetry work?
OpenTelemetry provides a common framework to collect metrics, traces, events, and logs. This is a boon to application developers as they are no longer stuck with the limitations of their monitoring tools to diagnose and fix issues. Since correlating the data is easier, devops can identify issues across related services and troubleshoot them quickly.
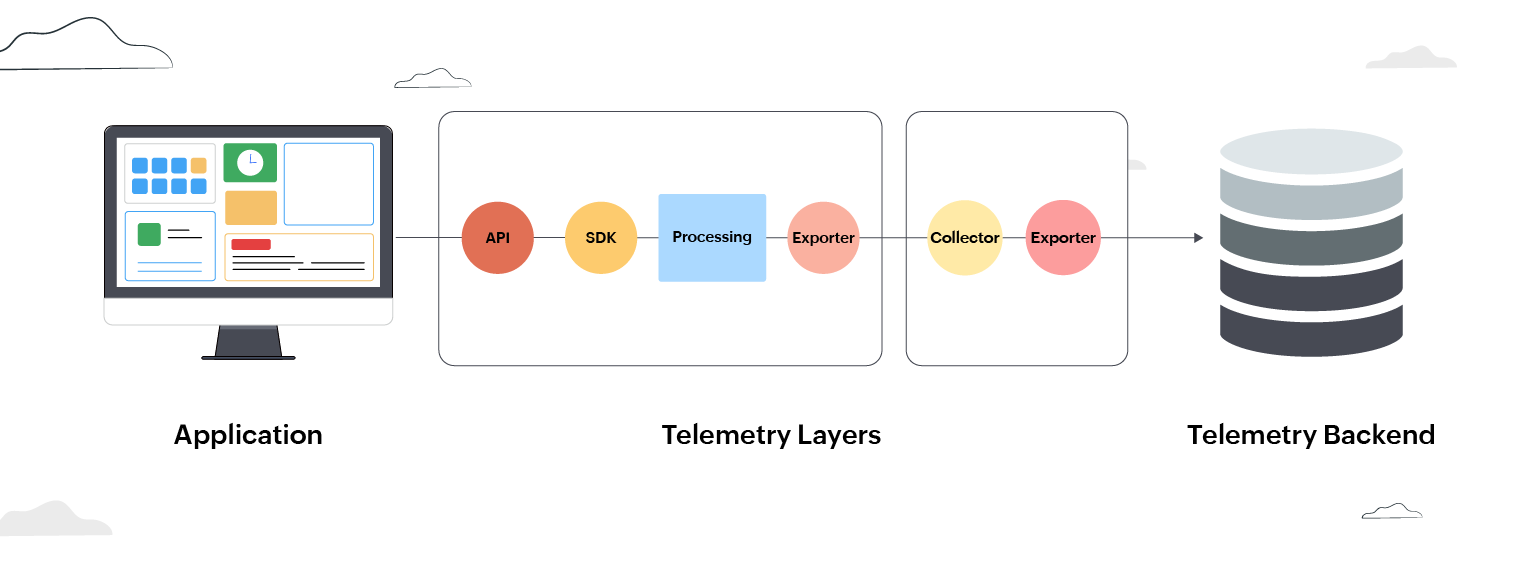
The following components constitute the OpenTelemetry framework:
- Set of APIs, corresponding to individual programming languages, to instrument the code for data
- Exporter, to transmit the telemetry data to the preferred backend for analysis
- Set of SDKs, corresponding to individual programming languages, bridging the APIs and Exporter
Once you have your telemetry data, you can export it either using a vendor-provided exporter or using the open-telemetry protocol (OLTP) for further analysis.
By decoupling telemetry data from individual vendors and tools, OpenTelemetry enables organizations to define and monitor their business-specific metrics without being limited by the tools they use.
The road ahead
Currently, the OpenTelemetry project is in an early release stage. The project supports more than 11 languages now and has stable versions of APIs and SDKs for collecting traces, stable protocols for collecting metrics, and experimental support for capturing logs.
Several developers and vendors have contributed to this open-source project and the market is gradually shifting towards adopting OpenTelemetry.
In the foreseeable future, as more and more organizations adopt OpenTelemetry for their observability needs, DevOps will spend less time learning the toolset, leaving more room for analyzing and optimizing their services. Also, vendor support for OpenTelemetry will increase as the standards mature, giving DevOps various toolsets to derive insights into their applications and services.
Note: Site24x7's support for OpenTelemetry is currently underway. This will provide enhanced insights into your IT environment assisted by Site24x7's powerful reporting and artificial intelligence capabilities. Watch this space for more updates.