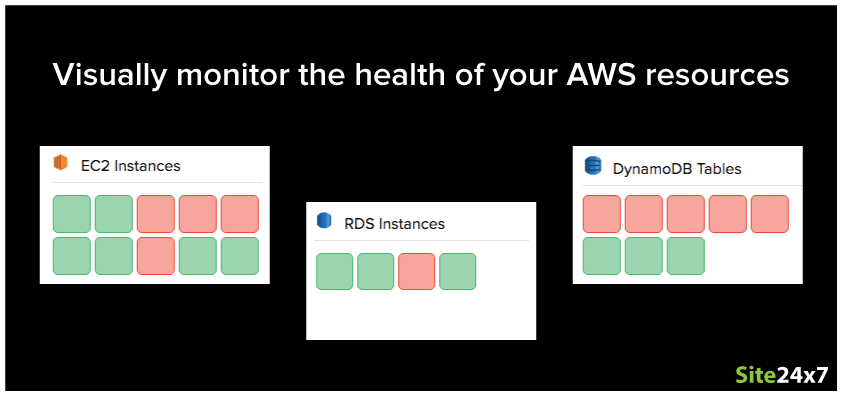
Introducing Site24x7's AWS infrastructure dashboard: Visualize the health and performance of your AWS infrastructure components instantly.
When you're running a complex production application within AWS, odds are there's going to be a lot of moving parts involved. Your application depends on the health and performance of many different components, including load balancers, compute instances, databases, and other application dependency services like S3 buckets and SNS. Although it helps to collect metric data, configure thresholds for key performance indicators, and get notified via multiple channels, wouldn't it be better if you had a single, unified display? One that visually monitors your EC2 infrastructure hosts and other AWS resources at a glance? Well, today I am excited to say that the wait is over!
Introduction
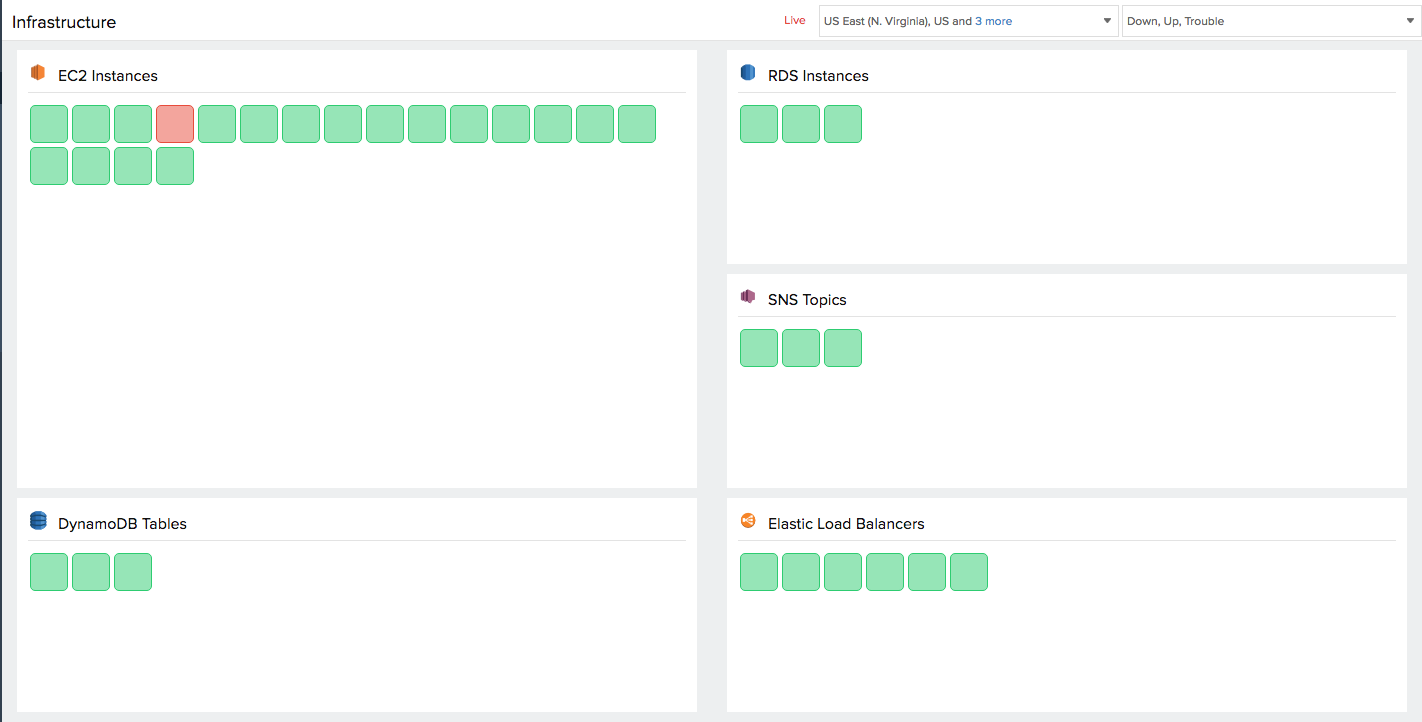
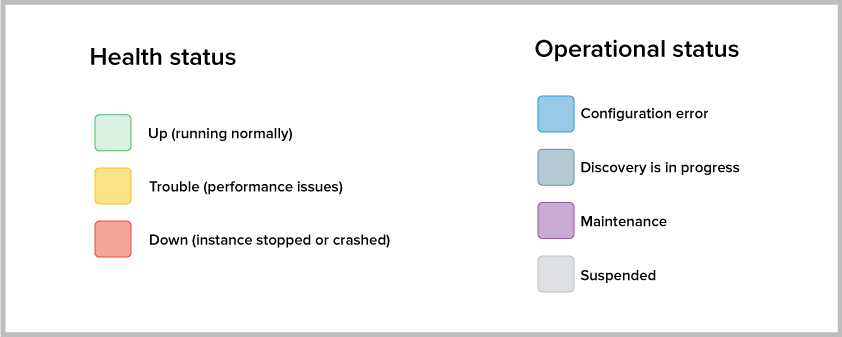
Site24x7's AWS infrastructure dashboard displays the state of all your monitored AWS cloud resources in terms of status and threshold violation. The dashboard provides an overview of what's happening in your AWS account, visually displaying the current status of your AWS resources across all regions and availability zones. With Site24x7's infrastructure dashboard, you and your IT/Ops team can get a quick snapshot of performance and availability from one spot. The AWS infrastructure dashboard has separate resource boxes for each underlying AWS service. Each section provides a color-coded visualization of the various individual instances that are being monitored, with the color representing either its health status or operational status.
Data sources
The AWS infrastructure dashboard combines data from a number of sources to designate the health status of each instance:
Native CloudWatch integration
Resource utilization and performance data collected by polling the CloudWatch API and the value of the data relative to the configured thresholds is monitored for a given time period to determine AWS resource health status.
Agent-based monitoring
The Site24x7 agent can determine the health status of your EC2 hosts by taking into account your threshold setup and comparing it to key system data and application metrics from popular open-source services, including Redis and Memcached.
EC2 instance checks
A change in the health status of your monitored EC2 instance could also occur from a system check failure or an instance check failure. Other factors can also affect the status color, such as the scaling down of AutoScaling instances or user-driven actions such as intentionally terminating or stopping an instance.
Smart alarms
You can create a powerful infrastructure dashboard by configuring multiple alert conditions and advanced alerting strategies for each individual performance counter. That way, only a sustained threshold breach can trigger a status change, rather than a momentary breach.
Key capabilities
Always up-to-date
There's always something going on in your dynamic AWS environment. Even as you read this, new instances are being launched and terminated. With automatic rediscovery, our dashboard is agile enough to track what's happening. Any change is updated in the dashboard automatically, without any additional configuration on your part, so you don't need to worry about any potential performance blind spots.
More contextual information
View metadata information such as resource name and geographic region by hovering your mouse over a resource tile. If you find a particular AWS resource tile in Trouble or Down, mousing over will display the nature of the threshold violation. You can also click on the tile to dive deeper into the performance issue.
Near real-time status
What do we mean by near real-time? Well, to effectively map your AWS platform, Site24x7 periodically queries the Amazon Web Service API using different AWS functions like Describe, Get, List to collect, and track resource state. Once that's done, Site24x7 queries the CloudWatch API every five minutes to collect resource utilization data. This metric data, with respect to the thresholds, determines the health status of your cloud resources.
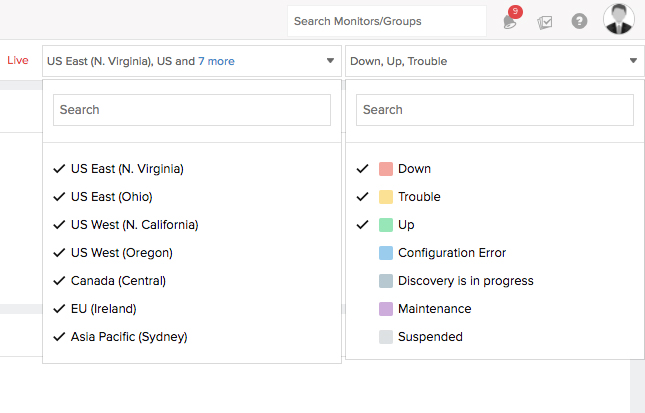
Smart filters
Customize the dashboard with our region and monitor state-based filters. This will remove resource subsets and create distinct status views of your AWS environment, each one focusing on a different facet. Identify and troubleshoot issues faster by learning straightaway which AWS components in your resource farm are down.
Numbers don't matter
Our dashboard is scalable and flexible enough to take care of even the largest of accounts. No matter how large your AWS account footprint is, our dashboard UI is responsive enough to comfortably accommodate hundreds, if not thousands, of resources in a single above-the-fold view. There's no need scroll.
Multiple accounts, one dashboard
Our All Accounts view gives you the ability to track the health and performance of hundreds of compute instances, DB instances, and other AWS resources, spanning across multiple accounts in your development, testing, and production environments.
Future-proof
Our monitoring support for new AWS resources and services continue to grow. Any new resource that pops up whether its SQS, Elastic Cache, or any other resource ? will be seamlessly integrated into the existing infrastructure dashboard.
Getting started
There is no need to build or create anything; the dashboard is preconfigured and ready to use. All you need to do is connect your AWS account with Site24x7. You can either create Site24x7 as an IAM user and generate security credentials (Access Key ID and Secret Access Key), or you can delegate access more securely by setting up a cross-account IAM role between your AWS account and Site24x7's AWS account. So what are you waiting for? Start your 30-day free trial and follow the instructions above to connect your AWS account with Site24x7.
Related reads: