Identify and eliminate bottlenecks in your application for optimized performance.
Poor performing code translates to a poor user experience, causing frequent crashes, unresponsiveness, and ultimately, lost revenue. But how do you identify bottlenecks before they impact your users? The answer lies in robust .NET performance monitoring.
Performance monitoring involves establishing a baseline of your application's resource consumption and tracking deviations to pinpoint slow or inefficient code. Before jumping to solutions, it's a best practice to capture Real User Monitoring (RUM) data and establish clear performance baselines. Once you identify a degradation, benchmarking allows you to test optimizations against each other to find the most efficient fix.
Today, developers have access to a rich ecosystem of tools ranging from cross-platform CLI utilities to comprehensive Application Performance Monitoring (APM) platforms. In this guide, we'll explore the most popular options, including modern dotnet CLI tools, PerfMon, PerfView, BenchmarkDotNet, and DebugDiag:
dotnet-counters and dotnet-trace that provide lightweight, real-time insights for .NET Core and .NET 5+ applications.In this hands-on tutorial, you’ll learn how to evaluate the performance of a .NET application using PerfMon, PerfView, and BenchmarkDotNet. This article also highlights other methods and best practices for measuring the performance of a .NET app.
To illustrate how these three performance tools work, you’ll use a simple .NET API application that you can use for performance profiling. It’s a Windows Form app with a single button.
To follow along with this article, you need:
Create your app using the Windows Forms app (.NET Framework) template for C# on Visual Studio. Then, add a button that calls the function below when clicked. For a more in-depth explanation, see Microsoft’s guide on creating Windows Forms apps.
void slow()
        {
            int[] items = { };
            for (Int32 i = 0; i < 1e8; i++)
            {
                items.Append(i * i);
            }
        }
This function executes a very slow for loop on purpose to help you see how you can monitor performance issues in .NET apps.
Let’s get started!
If you're working with modern .NET (like .NET Core, .NET 5, or later) across different operating systems (Windows, Linux, macOS), the built-in dotnet diagnostic CLI tools are indispensable.
These lightweight, cross-platform tools require minimal setup and do not rely on heavy UI applications, making them perfect for CI/CD pipelines and headless servers.
For example, to monitor your application's health using dotnet-counters, you can simply run dotnet-counters monitor -n YourAppName to see a live view of the .NET runtime metrics right in your terminal.
PerfMon helps track your application's resource usage in a Windows system. It uses the built-in Windows performance counters and provides useful metrics like CPU and memory usage, the number of exceptions thrown, the time spent in garbage collection, and the number of requests in an ASP.NET application, among others. One of the best features of PerfMon is that you can record performance counters in log files to generate reports for further analysis. You can also monitor performance in real time.
To effectively monitor the performance of your .NET application using PerfMon, you need to know the correct counters to track and the threshold values for your configuration. Without these two, the data you collect is ineffective because you won’t be able to identify when the application is underperforming. Microsoft provides a list of performance counters and their threshold values for .NET applications that you can refer to.
To get started with PerfMon, search for perfmon in the start menu and run the Performance Monitor application. Alternatively, run the perfmon command anywhere in the command line.
To view performance data in real time, click Performance Monitor in the left sidebar, as shown below:
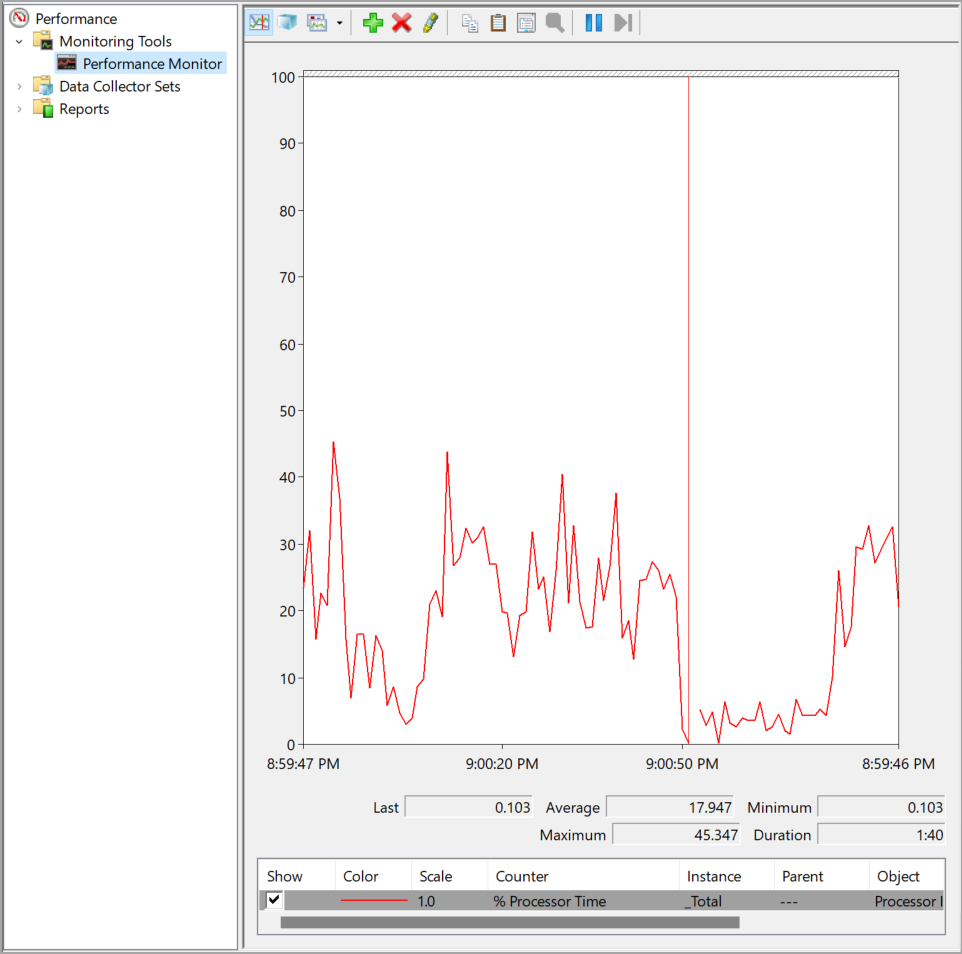 Fig. 1: Real-time performance monitor graph
So far, the performance monitor is only monitoring the processor time. To add more counters, click the green + icon at the top menu bar.
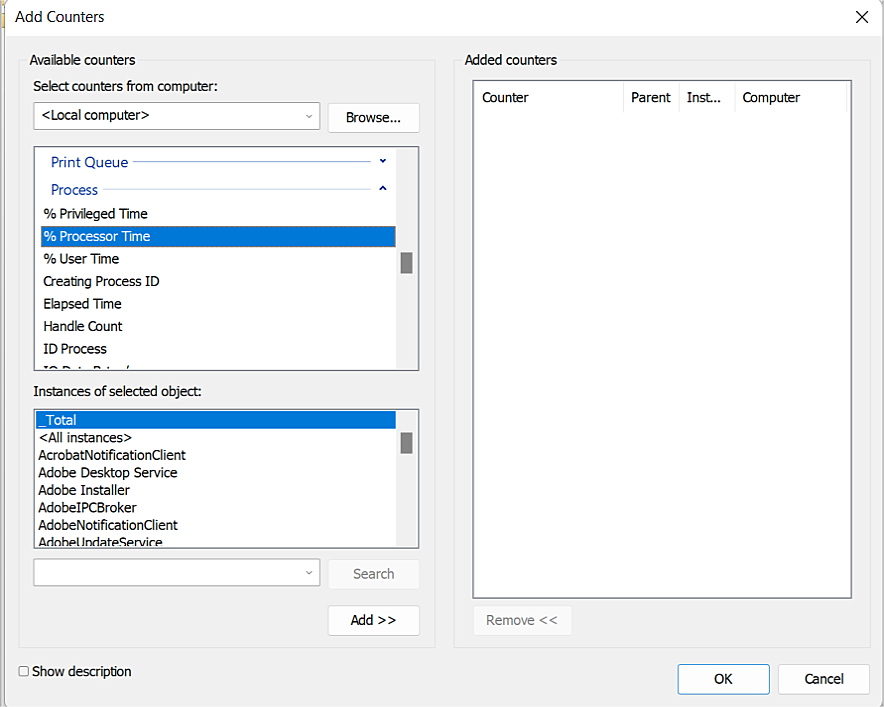 Fig. 2: Available counters on PerfMon
Each category has several counters you can choose from. For example, you can choose % Processor time under the Process category. Additionally, PerfMon lets you specify the application you want to monitor for some counters, like this one.
For the sample .NET application, you’ll monitor the CPU and memory usage to test whether the application hangs. A CPU usage of 100 percent will indicate that a slow calculation is being run or that an infinite loop has started.
Use the Process > % Processor Time to track CPU usage. Ensure that you select the .NET application as the instance. Additionally, track the memory consumption by adding the Process > Private Bytes counter.
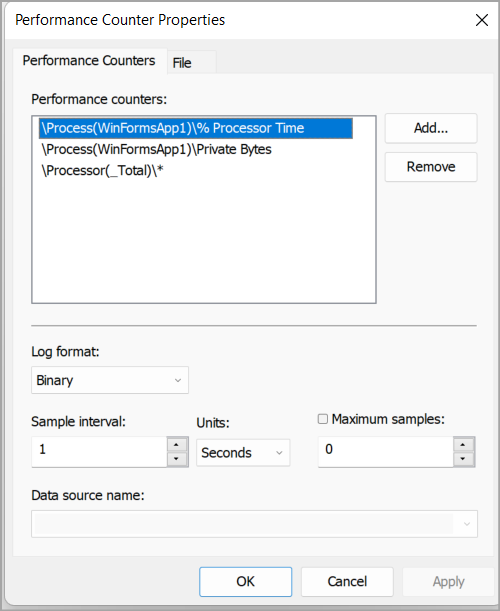 Fig. 3: Adding performance counters to PerfMon
After adding these counters, click OK, then click the button in the Windows Form App to run the slow function.
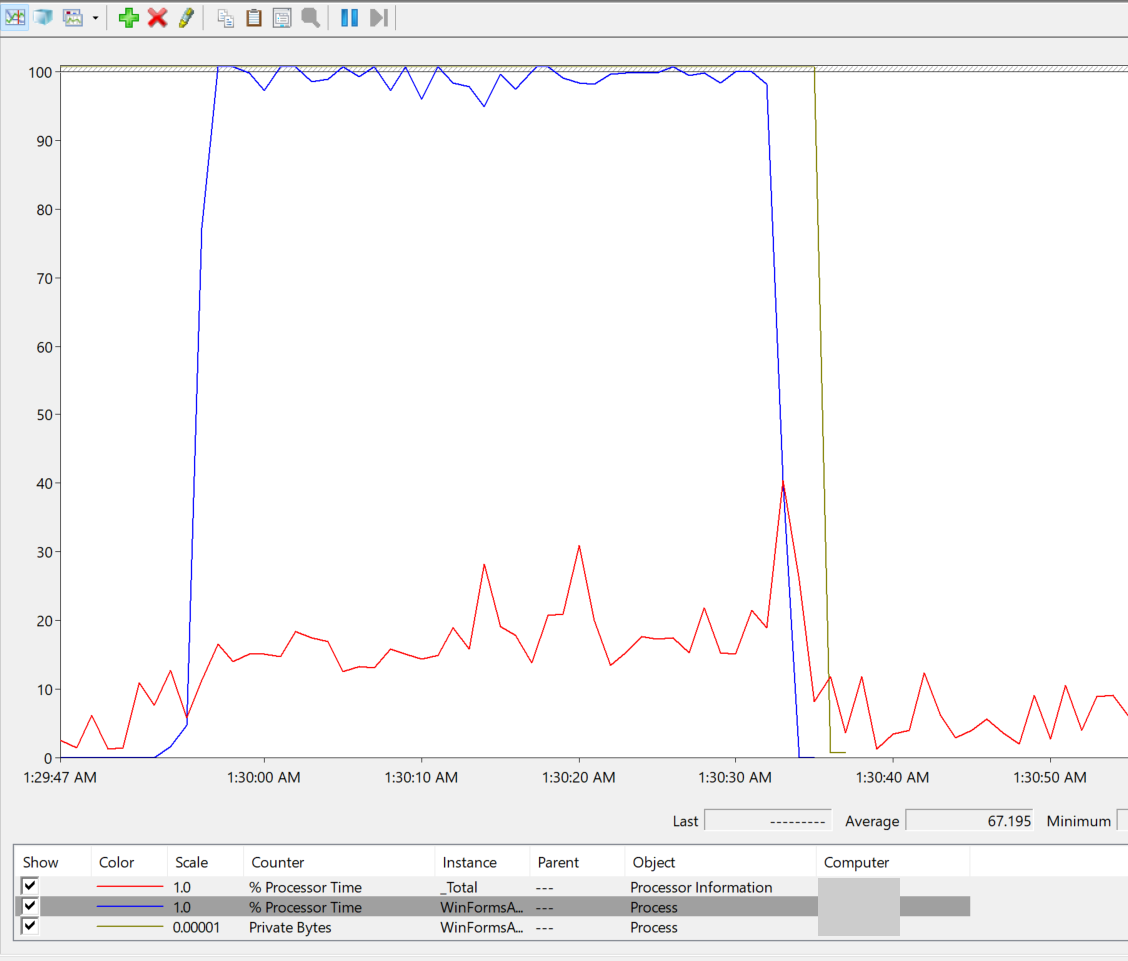 4: Graphical representation of the performance counters when you run the Windows Form app
In the graph generated by PerfMon, you can see the processor time and private bytes go to 100 when you click the button and start the loop. These values remain at that point until you stop the application.
While this data is great because you know the application is heavily consuming resources, it doesn’t show what’s happening inside it. For the sample application, it’s easy to tell because you’re executing only a single function. However, for large .NET applications, it would be more difficult to pinpoint where the performance issue stems from. This is where PerfView comes in.
PerfView provides more visibility into the performance issues in an application. It's also more customizable and provides more fine-tuning capabilities than PerfMon.
For example, you can configure the sample interval (as low as 0 .125 MSec), limit the amount of data collected, turn CPU sampling and garbage collection on or off, set the number of seconds the collection will continue, place markers in the log files during data collection, and many other options.
You set these options before you start collecting data, as shown in the image below:
Fig. 5: Advanced options for collecting data on PerfView
To get started, download PerfView from the GitHub release page, then run the perfview.exe file.
There are two ways to start collecting data in PerfView:
For this demonstration, you’ll use the collect command to start data collection, as shown in the image below:
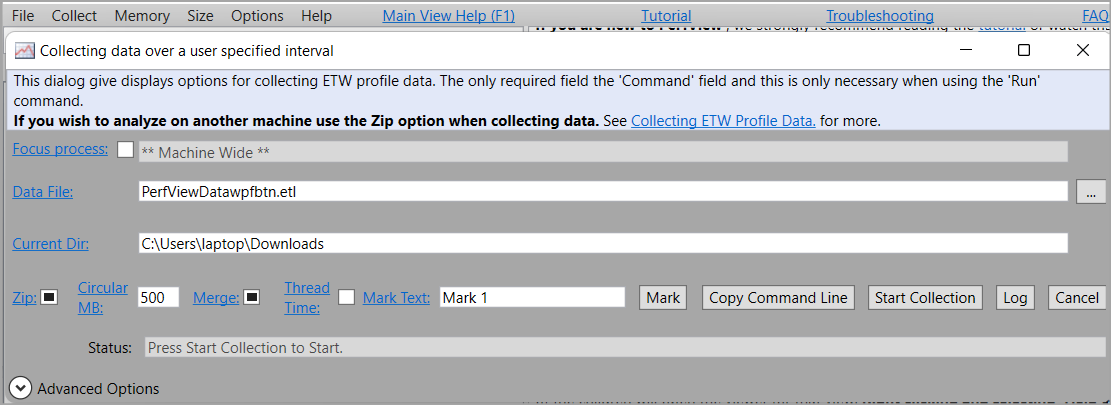 Fig. 6: Collecting data over a user-specified interval
Click Start Collection to begin the data collection process. Ensure that you launch the application you’re monitoring so that PerfView can gather samples.
Once you stop the collection process, PerfView will save the performance data in an ETL file. You can find it on the left pane of the PerfView application. Double-click it to reveal its contents. You’ll see several options like Trace Info, Processes, CPU Stacks, Events, and Memory. Double-click these options to display additional information.
For example, to see the CPU usage of the different processes running during the data collection, double-click CPU Stacks.
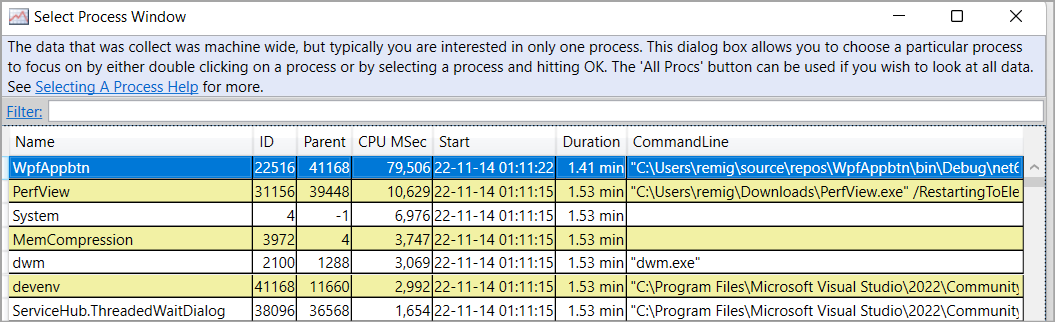 Fig. 7: Table of data collected for each process
Notice that the WPF is at position one. Click it to see the specific functions that were called.
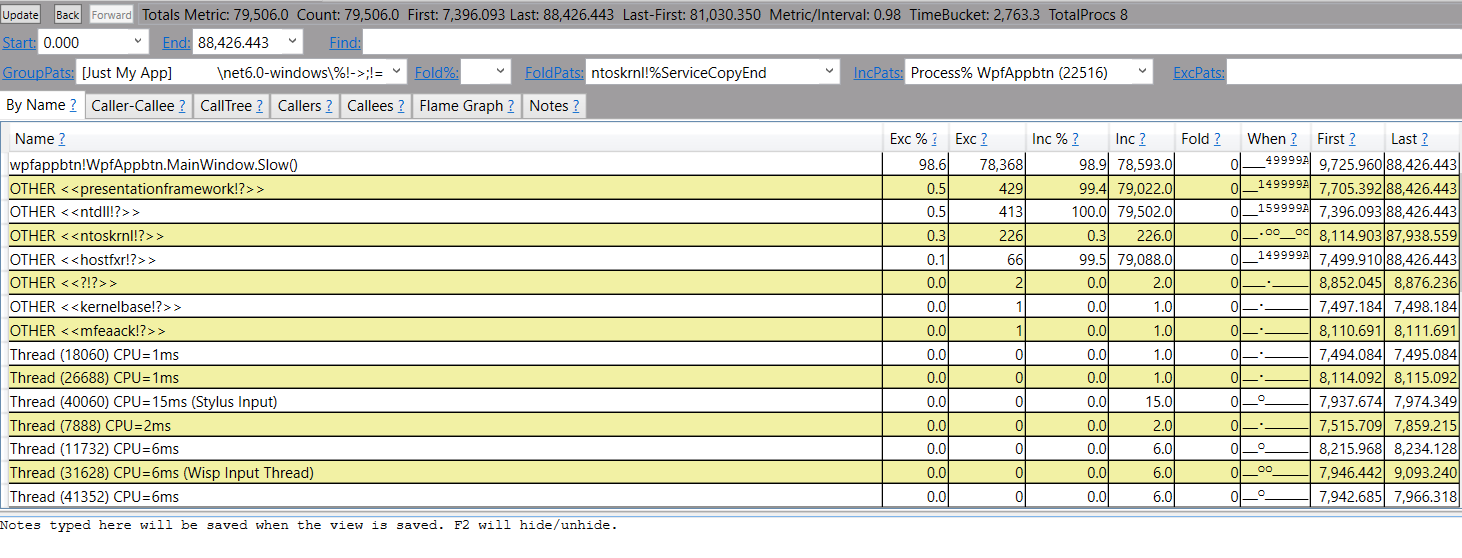 Fig. 8: Expanded view of data collected for a single process
The screenshot above shows that the application spent 98.6 percent of the time exclusively running the slow function. So, to improve performance, you need to optimize this function. This is how PerfView differs from PerfMon. It pinpoints exactly where in your application you should make changes.
However, PerfView doesn’t tell you what changes to make — or which will be the most effective. That’s why you use BenchmarkDotNet.
BenchmarkDotNet is useful for designing custom benchmarks in code and measuring execution times. It helps you decide the best optimization solution by comparing the execution times of different implementations. You can determine whether the changes you make in the application improve or degrade performance.
BenchmarkDotNet converts methods into benchmarks and monitors them to provide useful insights into their performance. You use it after identifying the functions slowing down performance.
For example, when you used PerfView on the Windows Form app, it showed that the slow function consumes a lot of time during execution. To improve performance, you need to optimize this function.
This is where BenchmarkDotNet is helpful. It lets you run different tests of different implementations of the slow function to determine which approach has the greatest impact on performance.
The slow function runs a loop, which you need to optimize to improve the function’s performance. There are several loop patterns you could opt for. Creating benchmarks for each will help you determine which loop to use.
To create benchmarks using BenchmarkDotNet, create a console app in Visual Studio.
Then, install the BenchmarkDotNet NuGet package and add the packages at the top of the app using the code below:
using BenchmarkDotNet.Attributes;
using BenchmarkDotNet.Jobs;
using BenchmarkDotNet.Running;

[SimpleJob(RuntimeMoniker.Net472, baseline: true)]
[SimpleJob(RuntimeMoniker.NetCoreApp30)]
[SimpleJob(RuntimeMoniker.NativeAot70)]
[SimpleJob(RuntimeMoniker.Mono)]
[RPlotExporter]
Next, add a class called SlowFunc that contains methods using the for loop and while loop, each decorated with the Benchmark attribute:
public class slowFunc
{
    [Benchmark]
    public void forloopA()
    {
        int[] items = { };
        for (Int32 i = 0; i < 10; i++)
        {
            items.Append(i * i);
        }
    }
    [Benchmark]
    public void forloopB()
    {
        int[] items = { };
        Int32 i = 0;
        while (i < 10)
        {
            items.Append(i * i);
            i++;
        }
    }

}
Then, add the main function:
public class Program
{
    public static void Main(string[] args)
    {
        var summary = BenchmarkRunner.Run(typeof(Program).Assembly);
    }
}
Run the application to get the benchmarking results. BenchmarkDotNet should return a summary of results similar to this table:
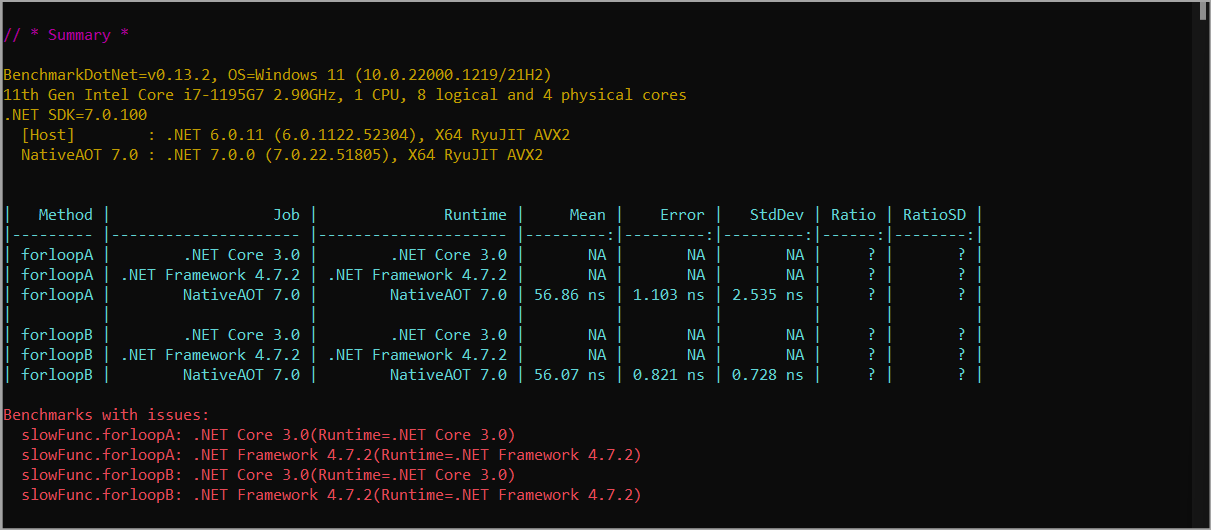 Fig. 9: BenchmarkDotNet summary results
You can see in the results that the forloopB has a lower mean, where mean refers to the average of the measurements made when the function was executed. This means the while loop performs better than the for loop in the forLoopB method.
Apart from methods, you can create benchmarks for modules and even full applications with BenchmarkDotNet. Additionally, you can integrate this tool into your continuous integration (CI) pipeline to ensure that any code going into production won’t hinder performance.
Like PerfMon and PerfView, Microsoft’s Debug Diagnostic Tool (DebugDiag) allows you to collect dumps and analyze them later for performance issues. DebugDiag also has other features that you can use for monitoring process crashes and memory leaks.
To analyze the .NET application, you need to create its DUMP file. You’ll use the built-in Windows task manager. With the application running, open the task manager and right-click on the application. From the menu, click Create dump file.
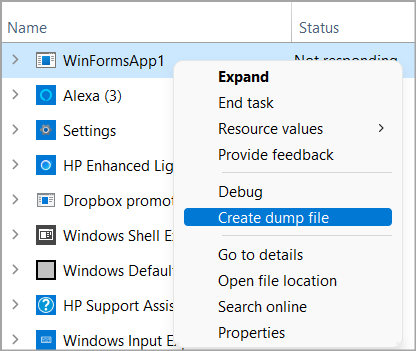 Fig. 10: Create dump file using the Windows task manager
Once the task manager creates the dump file, download Debug Diagnostic Tool from the Microsoft download center and run the .MSI file to install it.
Next, start the Debug Dialog Collection app and the steps below to analyze the dump file.
Click the Add Data Files button at the bottom to add the dump file.
Select Default Analysis, Memory Pressure Analyzers, and Performance Analyzers in the Analysis Rules panel and click Start Analysis to run the analyzer.
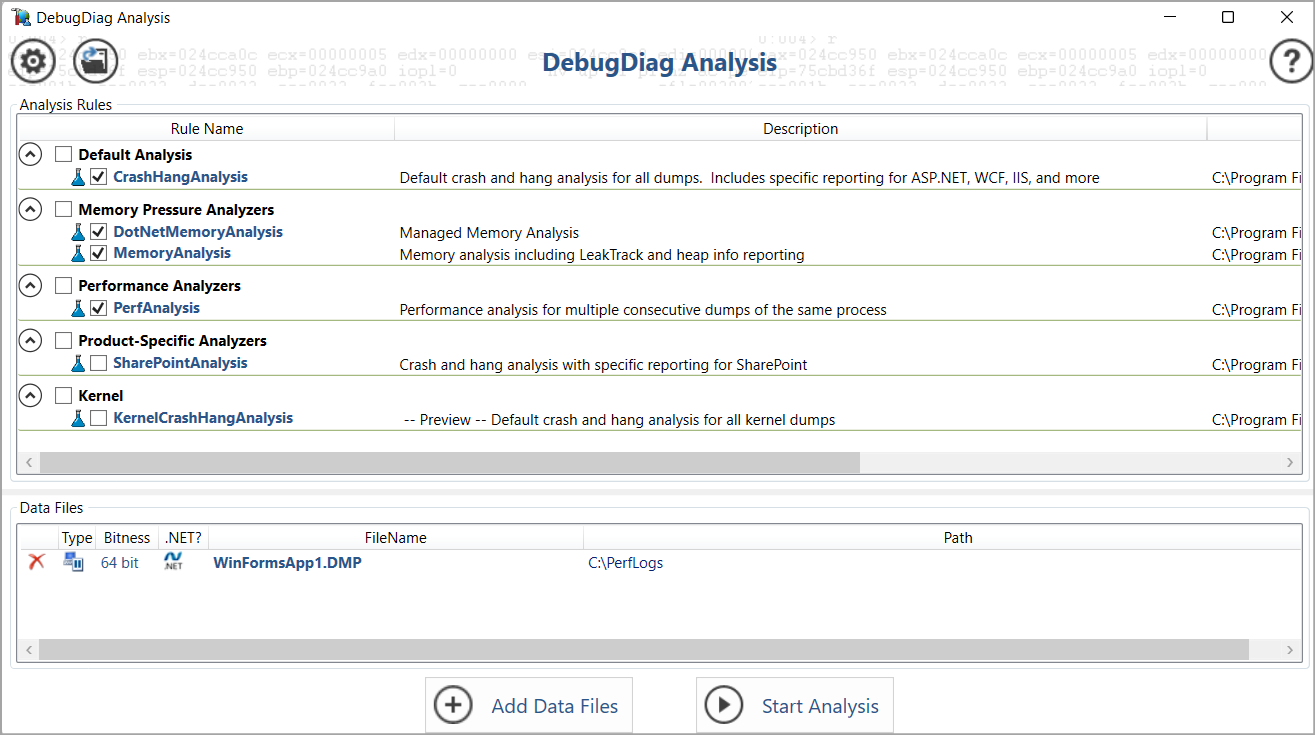 Fig. 11: DebugDiag Analysis settings
DebugDiag will generate a report you can view in a browser.
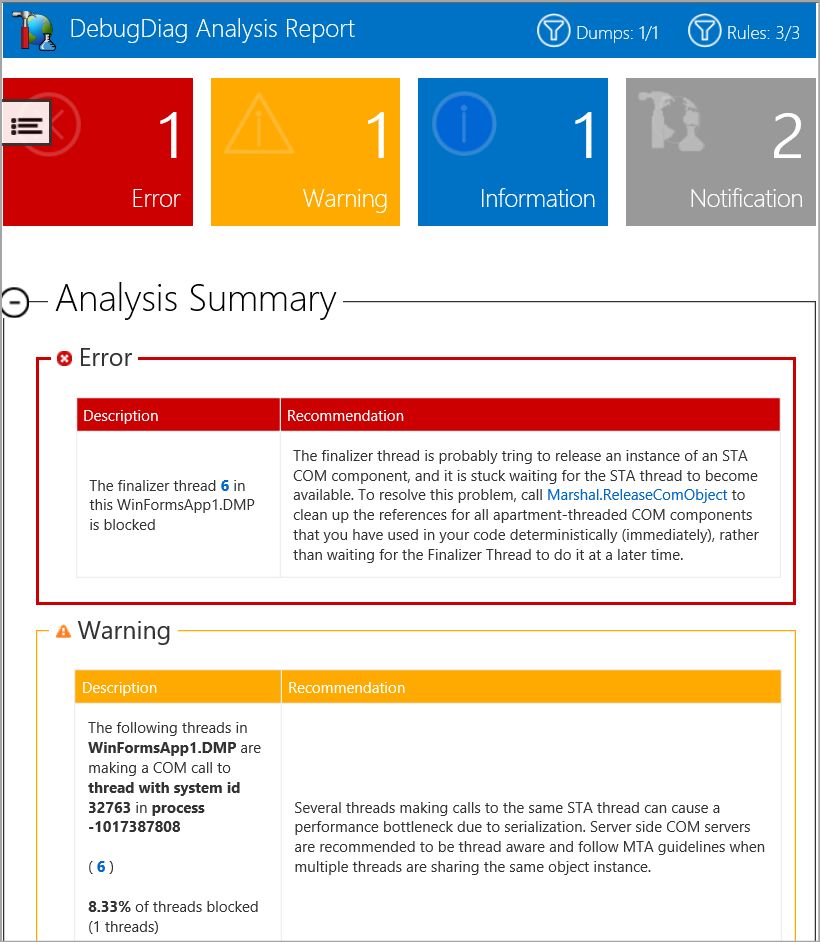 Fig. 12: DebugDiag Analysis report
The report reveals that a finalizer thread was blocked in the Windows Forms app. The finalizer thread runs in a .NET process. The Common Language Runtime (CLR) uses it to call the Finalizer method which is responsible for discarding resources such as memory provisioned by the object that implements it.
If the Finalizer is blocked due to an infinite loop, the finalizer thread stops discarding the memory of other finalizable objects, leading to high memory usage.
If you take a look at the CLR memory analysis section in the report, you'll find the WinFormsApp.Form1 app is among the 40 most memory-consuming .NET object types. This indicates that it's running a process that's consuming a lot of memory.
DebugDiag will generate a report you can view in a browser.
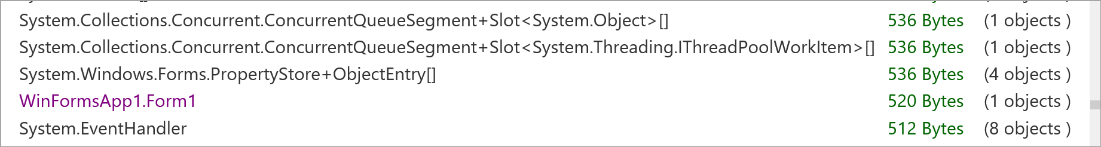 Fig. 13: Most memory consuming .NET object types
The report also shows that the application is taking up a lot of CPU time. In the CrashHangAnalysis section, the WinFormsApp1_exe!wmainCRTStartup of the sample .NET application is one of the top five threads by CPU time.
DebugDiag will generate a report you can view in a browser.
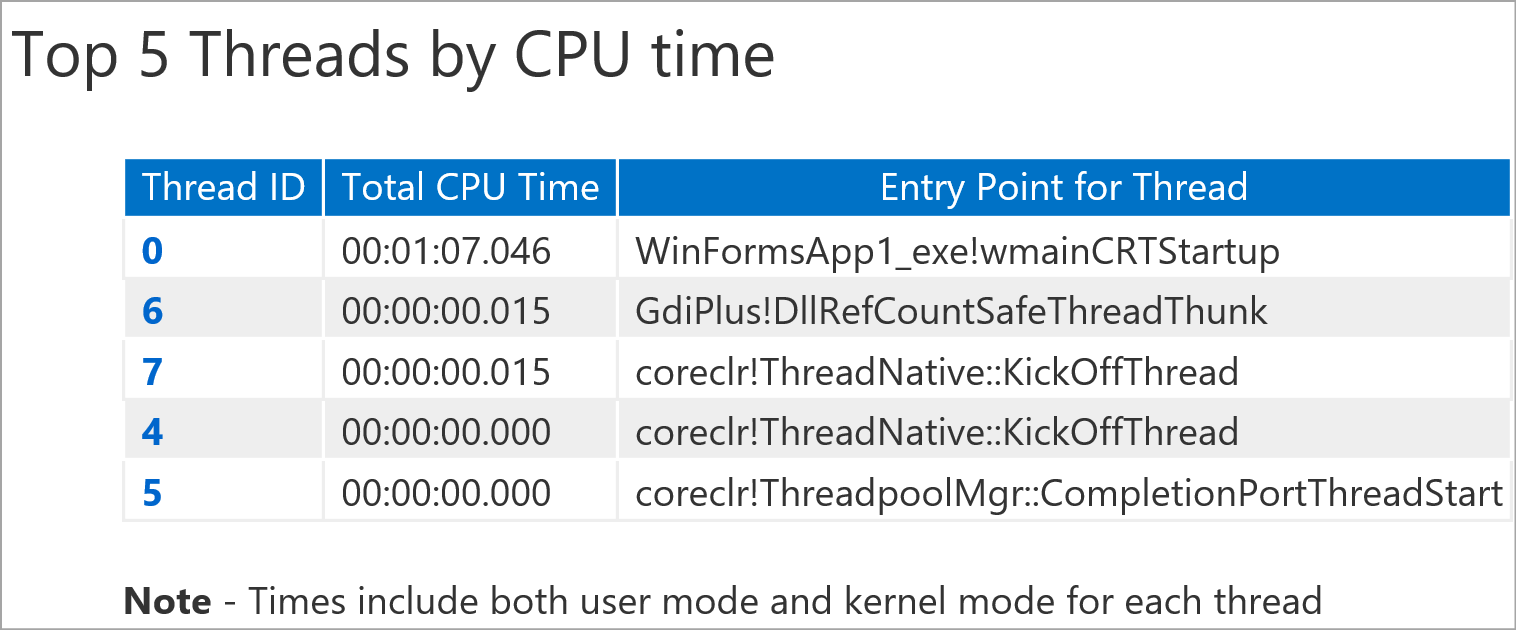 Fig. 14: Top five threads by CPU time
From this report, you can conclude that your application is consuming a large amount of memory and CPU time. To identify the actual methods causing this, you can use PerfView.
While manual diagnostic tools like PerfView, DebugDiag, and the dotnet CLI utilities are incredibly powerful for deep-dive investigations, they require manual intervention and specific knowledge to interpret the data. In a production environment, you need a proactive approach.
This is where full-stack Application Performance Monitoring (APM) solutions like Site24x7 APM Insight come in. Instead of running commands or analyzing dump files after an issue has occurred, APM tools automatically instrument your .NET applications to provide continuous, real-time visibility.
By integrating an APM tool, you shift from reactive troubleshooting to proactive performance management, ensuring your .NET applications remain highly available and performant.
This guide showed you how to use PerfMon, PerfView, and BenchmarkDotNet to monitor performance and create benchmarks for .NET applications. While all these three tools can help fix performance problems in .NET apps, they work differently.
PerfMon monitors and collects system-wide data that you can analyze later to identify issues like excessive resource consumption. DebugDiag also helps you collect dumps that you can later analyze to catch issues, but it has a nice user interface compared to PerfMon. PerfView is more specific. It lets you pinpoint the exact methods slowing down your app and what you need to optimize. BenchmarkDotNet helps you determine which optimization changes lead to higher performance. You can create different benchmarks that run different methods or modules, compare the results, and implement the option with better execution times.
Performance monitoring and benchmarking tools are instrumental. Instead of manually tracking execution times or resource usage metrics like CPU and memory usage, performance tools help you identify the resources your application is overconsuming and the methods hindering performance. This data lets you know which methods to optimize, which code changes are working, and which resources you need to increase.
Yes, Site24x7 APM Insight provides deep-level performance monitoring for .NET applications, helping you identify slow transactions, database queries, and code-level bottlenecks.
Site24x7 tracks critical CLR metrics like Garbage Collection (GC) CPU time, heap sizes, and thread counts to help you quickly pinpoint memory leaks and high CPU usage in your .NET applications.
