Azure PowerShell enables you to schedule scripts to run automatically at defined times. However, tracking the success and output of these tasks can be challenging, especially in environments using multiple scheduling methods or those using different operating systems.
Aggregating each task’s pass or fail results and any relevant error logs often requires deploying your custom solutions. In this article, we’ll explore some solutions to track the execution of scheduled tasks. First, you’ll create a PowerShell script on your local machine that throws frequent errors. Then, you’ll discover four ways to track the pass/fail status of the script. To follow along, you need PowerShell to run the script and a Site24x7 account.
Launch your PowerShell window and execute the mkdir and cd commands to create a directory called powershell-task-monitor on your computer and change into it. This is where you’ll store the PowerShell scripts.
mkdir powershell-task-monitor

 cd powershell-task-monitor
You’ll monitor the PowerShell scripts in four ways:
To manually track the script’s execution status, you write logs into a plain text file.
In your preferred code editor, create a PowerShell script file named task.ps1 and insert the following code:
# This script and task.ps1 should be stored in the "powershell-task-monitor" directory.
$date = Get-Date
Write-Output "STARTING ON: $date" | Out-File -FilePath "./logfile.txt" -Append
# The task.ps1 script is assumed to be in the current directory (powershell-task-monitor)
$taskScriptPath = "./task.ps1"

for (($i = 0); $i -lt 20; $i++) {
   $a = Get-Random -Maximum 20
   if ($a -eq $i) {
       Write-Output 0 | Out-File -FilePath "./logfile.txt" -Append
       Write-Output "TASK FAILED AT ROUND: $i"
       return
   }
}

Write-Output 1 | Out-File -FilePath "./logfile.txt" -Append
Write-Output "TASK SUCCESSFUL!"
In the code above, the success and failure events are represented by 0 and 1, respectively. These are randomly generated events for demonstration purposes.
Upon execution, the script performs the following operations:
Run the command below from your PowerShell terminal to execute the task.ps1 script. (If necessary, change the execution policy from restricted to remote signed.)
.\task1.ps1
To achieve both successful and unsuccessful executions, run the command multiple times, as shown below:
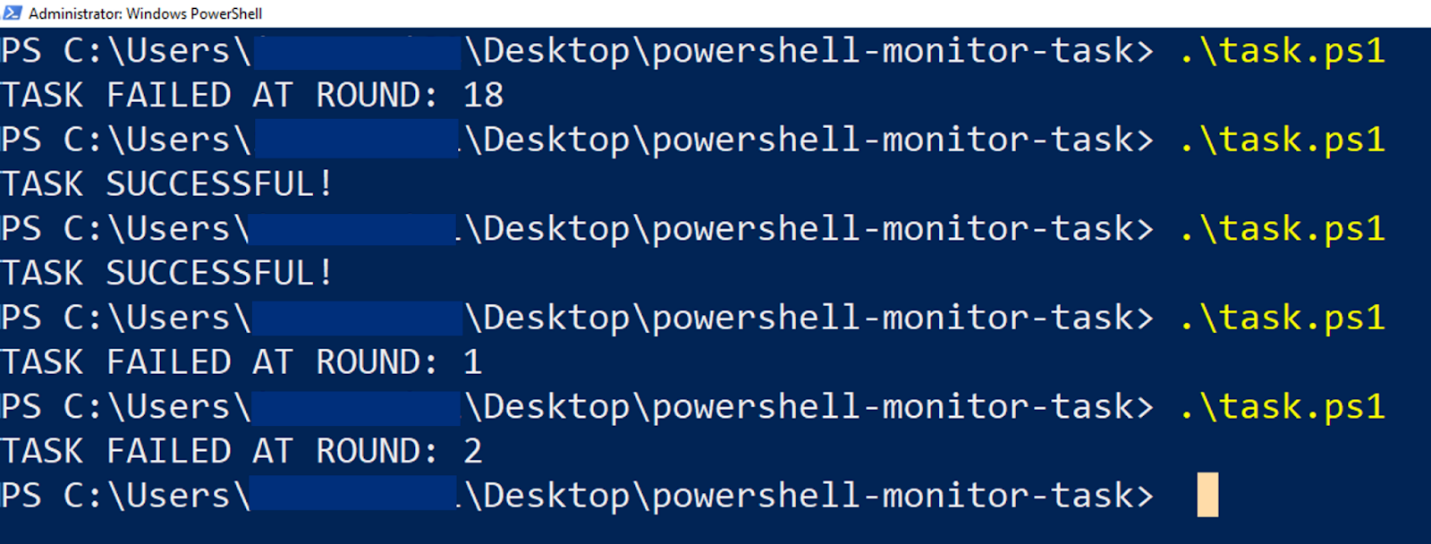 Fig. 1: Running the task.ps1 script multiple times
Next, examine the content of logFile.txt to track your task execution.
cat .\logFile.txt
As the image below confirms, there are two successful executions and three unsuccessful executions.
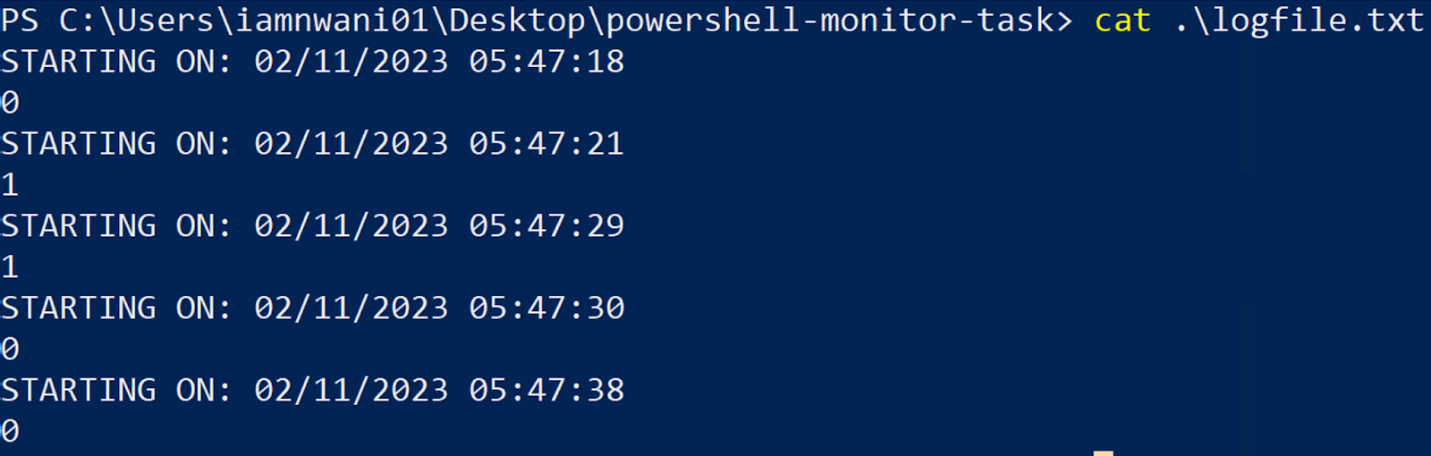 Fig. 2: Contents of the logfile.txt file
By analyzing the date, time, and numerical values, you can track the executions of the script to know when it passed or failed.
While this manual approach works for simple scripts, there are more scalable solutions for monitoring scripts executed within your cloud environment. For example, you can use Site24x7, a scalable cloud-based solution that provides features to monitor your website, cloud, and server solutions in real time.
The following monitoring approach uses a PowerShell job to track the execution state of a script.
A PowerShell job allows you to automate script executions without human oversight or a designated schedule. After executing a job, you can use the Get-Job cmdlet to get the job object, which contains valuable details.
To start, create a job.ps1 file to store the script for job creation. Then, add the code below to it:
# Both job.ps1 and task.ps1 are stored in the "powershell-task-monitor" directory.

$taskScriptPath = "./task.ps1"I
Start-Job -Name "Guess-ops" -ScriptBlock { param($path) & $path } -ArgumentList $taskScriptPath | Out-Null

$job = Get-Job -Name "Guess-ops" -IncludeChildJob

$job | Wait-Job | Out-Null

Write-Output $job
Similar to task.ps1, in the job.ps1, you’ve orchestrated a series of randomized successes and failures as a part of this demonstration.
The code above uses the Start-Job cmdlet to create a job named Guess-ops, which executes the task.ps1 script. The Out-Null cmdlet prevents the script from immediately logging the job result. Then, the Get-Job cmdlet retrieves the job by name and writes the object to the console.
Execute the job.ps1 script multiple times to see the script in action:
./job.ps1
./job.ps1
./job.ps1
./job.ps1
The image below shows that the job object contains a State property with a Boolean value to indicate whether the script passes or fails. Though task.ps1 repeatedly fails when running the job, it eventually passes, as highlighted below:
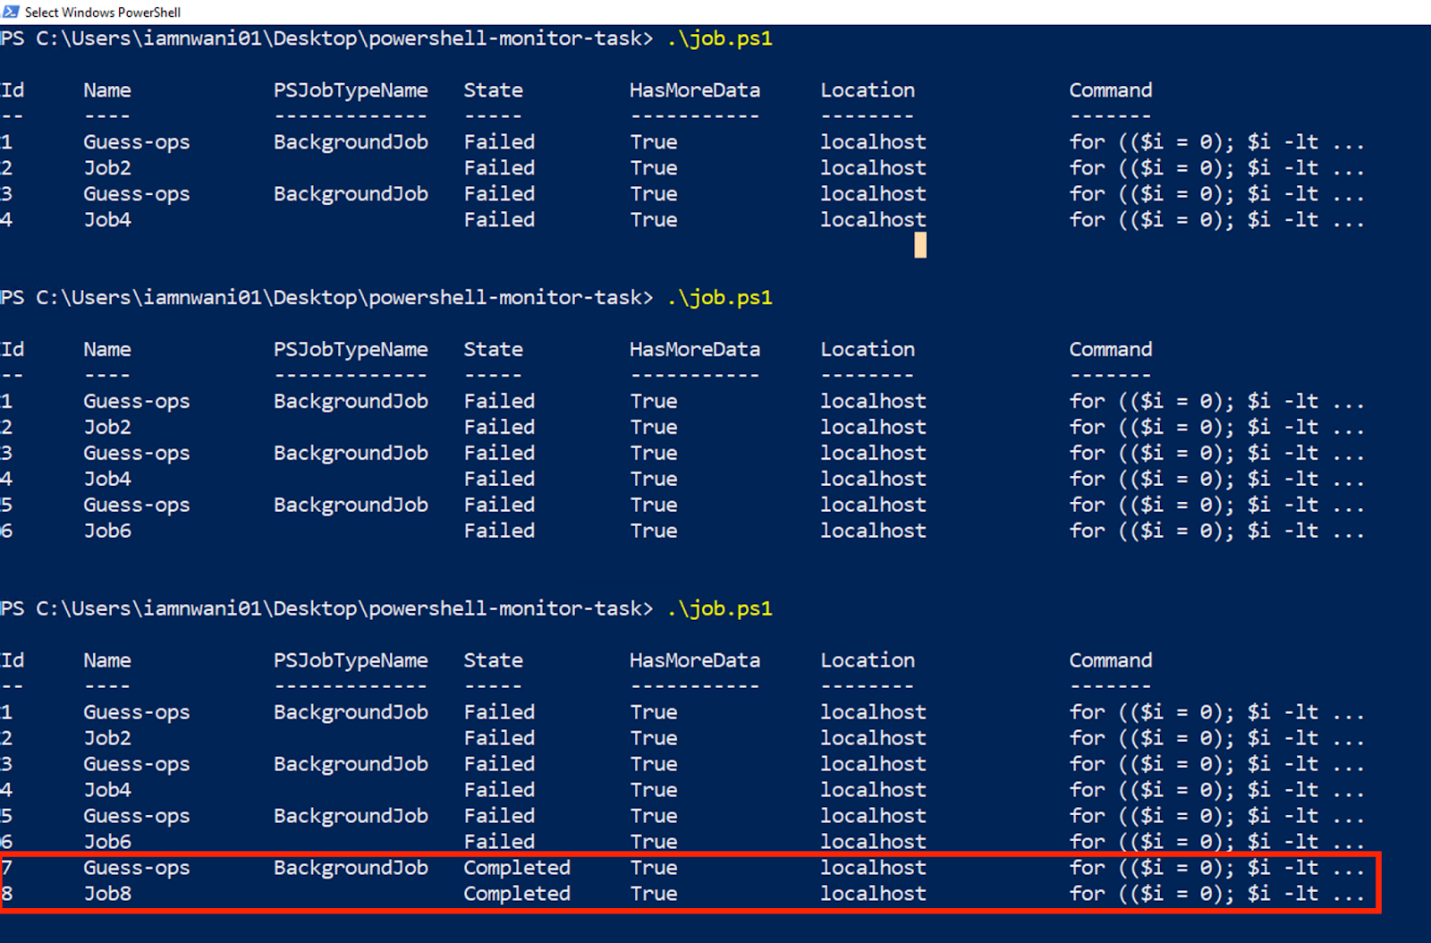 Fig. 3: Execution of the job.ps1 script
By using a PowerShell job, you benefit from the ability to automate your task execution and monitor its state in the job object.
This method is more efficient and informative than using log files manually. However, running the Get-Job cmdlet within a managed cloud environment might be impossible.
The next approach uses the PowerShell transcript to automatically record the execution of a script and analyze the data generated within the transcript.
A transcript provides a feature to automatically record all or part of your PowerShell session to a text file without manually writing the entries using an output cmdlet.
Execute the commands below to start a transcript session using the Start-Script cmdlet and run the task.ps1 script several times, then stop the transcript session using the Stop-Script cmdlet:
 # This script is meant to be stored and run from the "powershell-task-monitor" directory.
Start-Transcript -Path ./transcript.txt -Append

./task1.ps1
./task1.ps1
./task1.ps1
./task1.ps1
./task1.ps1
./task1.ps1

Stop-Transcript
With the -Path parameter, the transcript records the activities into a transcript.txt file within the project. Additionally, the -Append parameter causes the cmdlet to add new transcripts into the same file without overwriting any existing content.
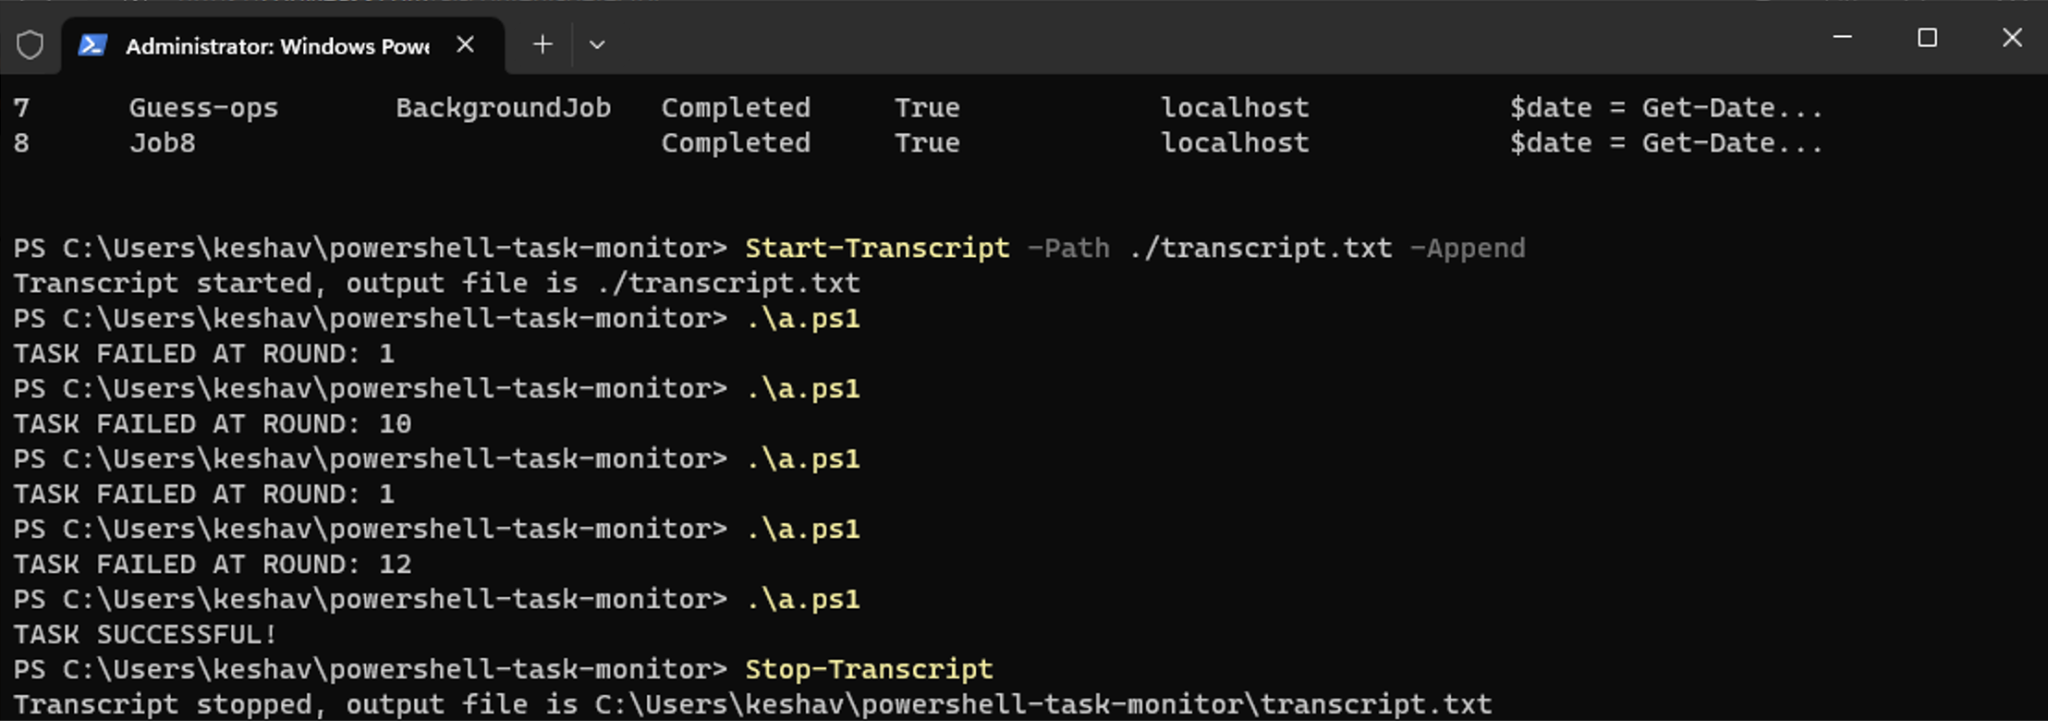 Fig. 4: Executing the task.ps1 script
Next, use the cat command to output the content of the transcript.txt file to the console:
cat transcript.txt
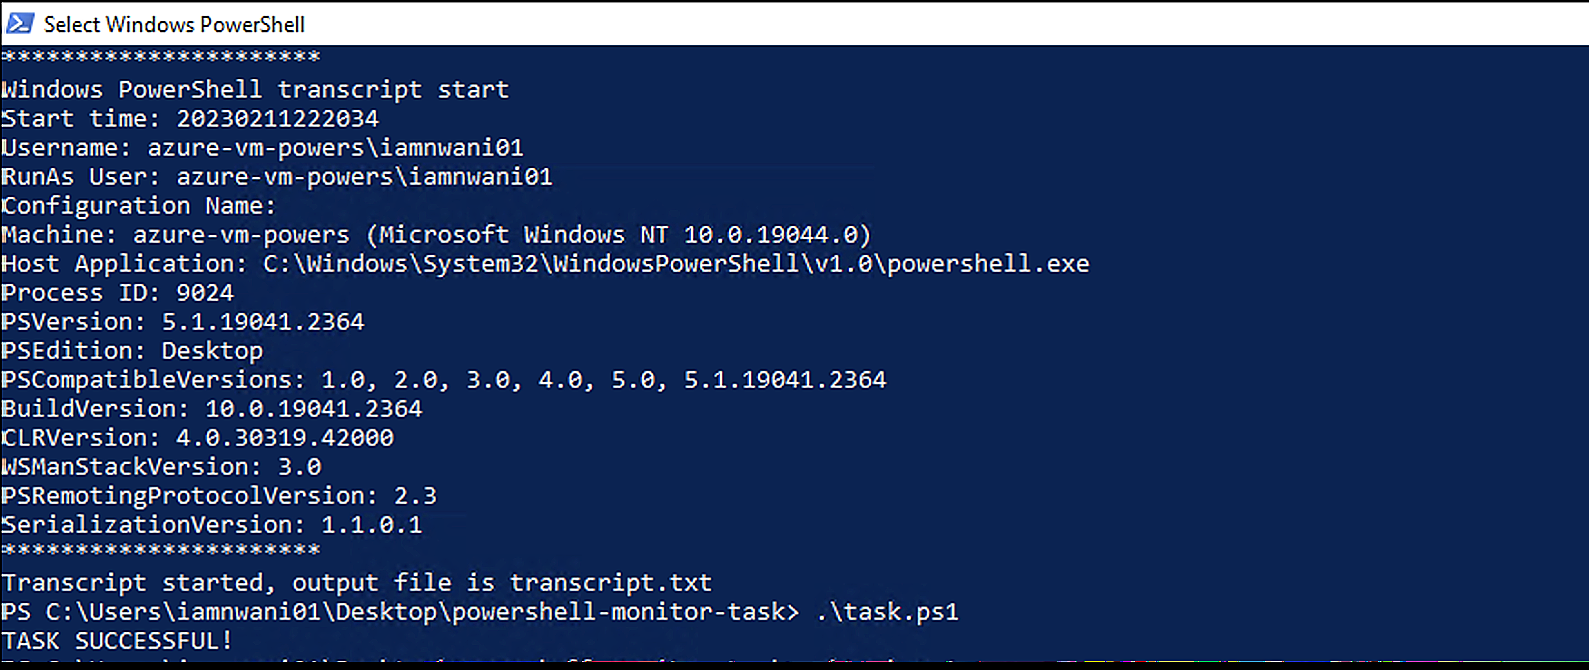 Fig. 5: Content of the transcript.txt file
Knowing that a transcript records all activities within a session, you can expect the output file to contain both valuable and irrelevant information. With the select-string cmdlet, you can search for lines containing helpful information, such as the TerminatingError message, when looking for errors. To search for this message, execute the command below:
Select-String –Path .\transcript.txt -Pattern "TerminatingError"
The select-string cmdlet searches the transcript.txt file for all lines containing the TerminatingError text.
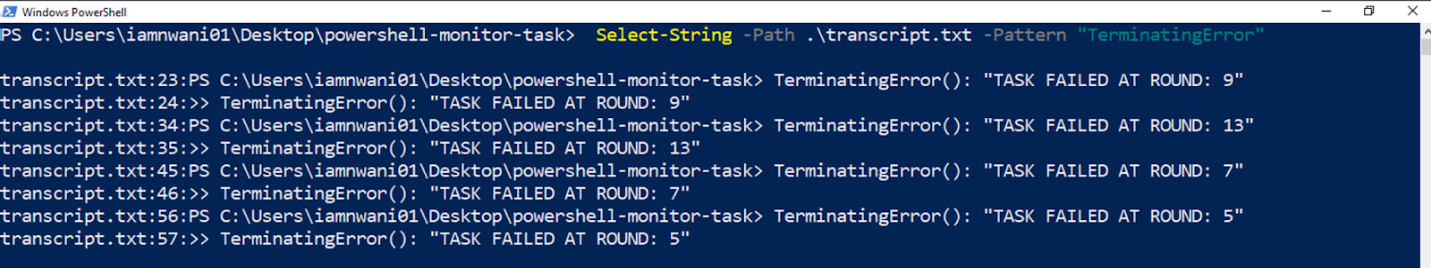 Fig. 6: Using the select-string cmdlet to search the transcript.txt file
Over the past three sections, you monitored your PowerShell scripts using do-it-yourself (DIY) solutions that surround log entries.
Now that you’ve tried multiple DIY solutions for monitoring your tasks, you’ll discover how to use Site24x7’s heartbeat monitoring tool to monitor your PowerShell tasks externally.
The heartbeat monitor oversees the execution of scripts, agents, daemons, and workers. It visualizes the error reports from your PowerShell scripts in real time and displays them on the web dashboard.
This feature provides a URL endpoint that expects your script to ping at various intervals to indicate that it’s operating successfully.
To configure a heartbeat monitor for your task.ps1 script, direct your browser to your Site24x7 dashboard.
Then, click Server on the navigation bar and select Heartbeat Monitoring.
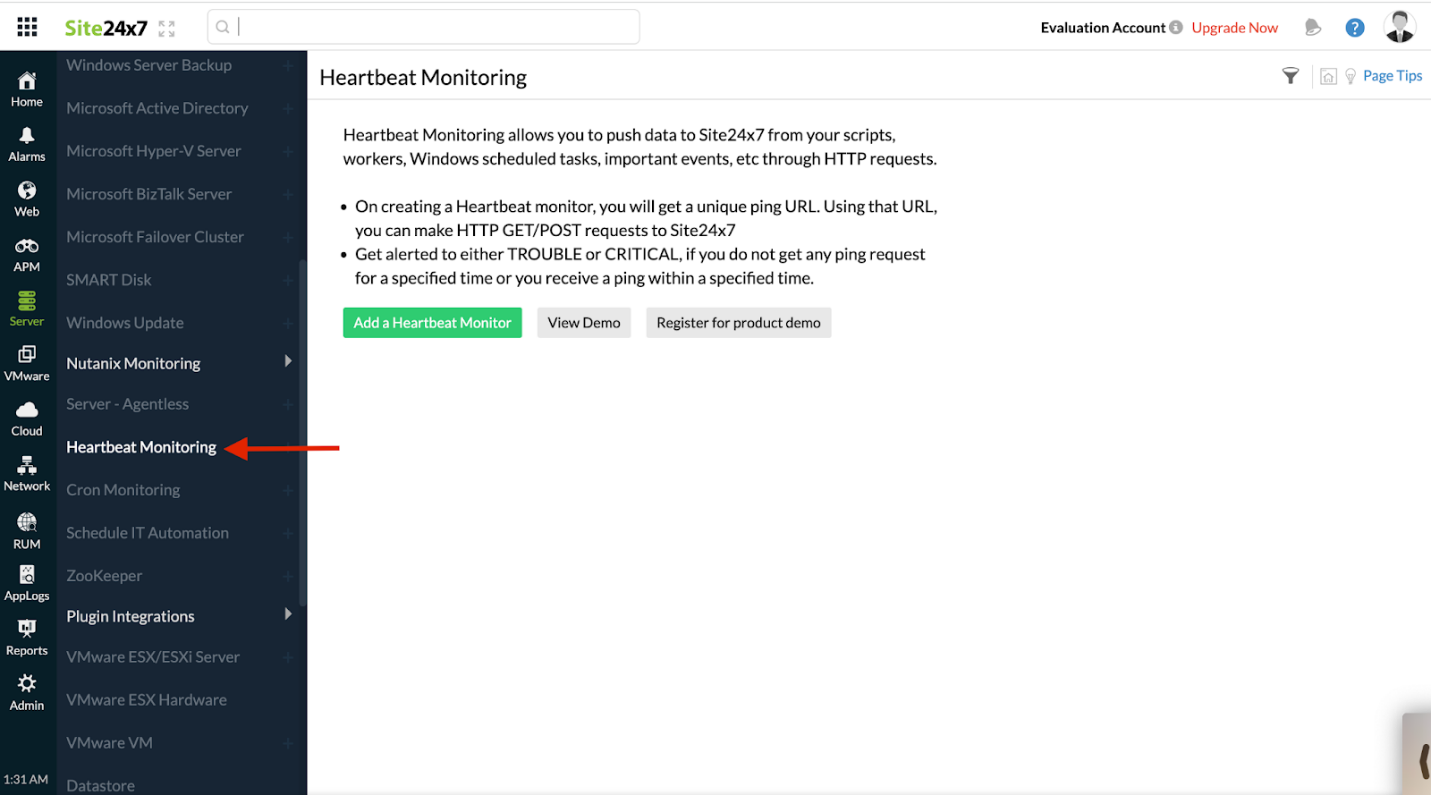 Fig. 7: Heartbeat Monitoring feature
Click Add a Heartbeat Monitor. On the page that opens, provide your monitor details and configure its behavior.
Enter your preferred values into the Display Name and Name used in Ping URL fields and leave the other fields as default.
This demonstration uses powershell-script-monitor for both the display name and ping URL.
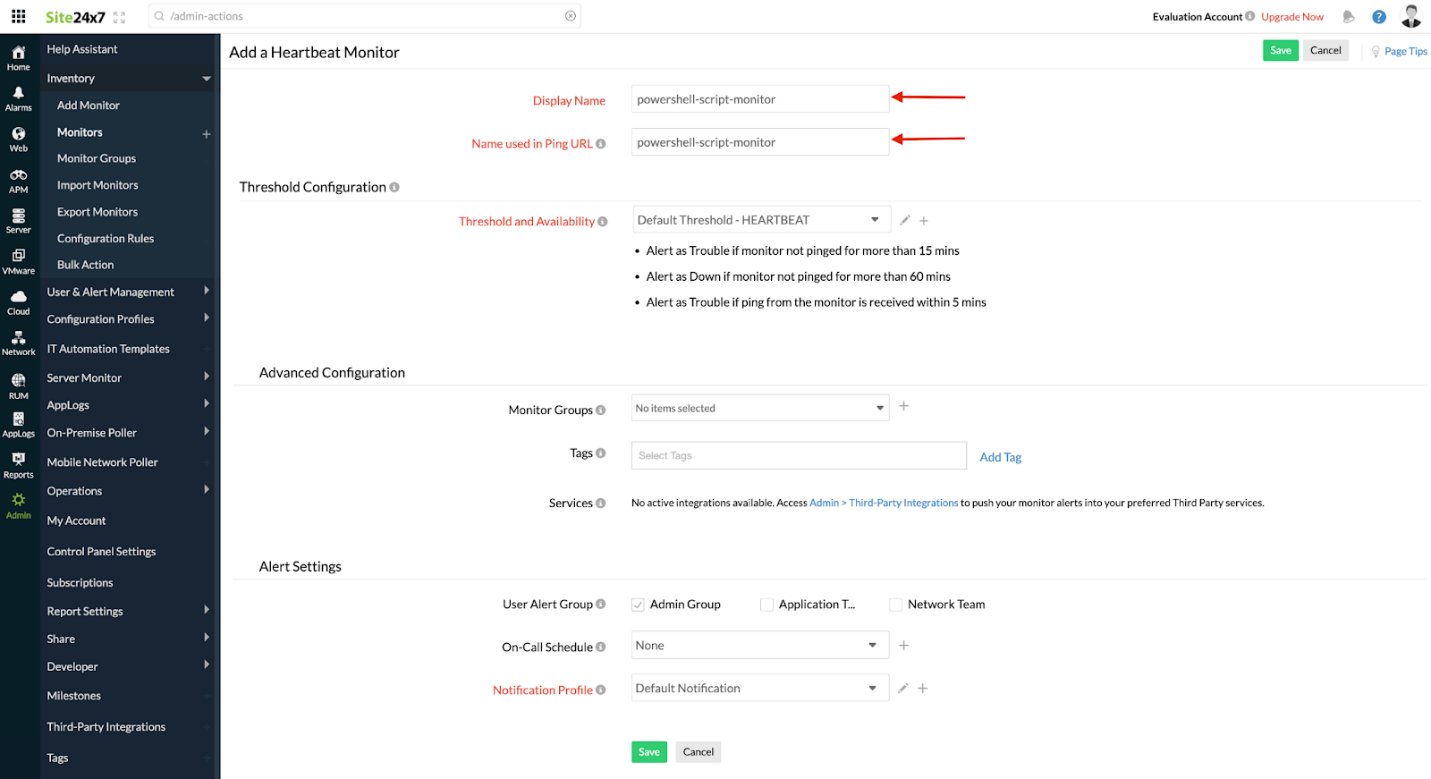 Fig. 8: The display name and the ping URL are both powershell-script-monitor
Click Save to store the details for your new monitor.
The dashboard will redirect you to the Setup page, which provides code snippets to quickly integrate the monitor using the endpoint URL in a Ruby, PowerShell, Cron, Bash, or Python project.
Click the PowerShell tab to see how to make a GET request using the Invoke-WebRequest cmdlet to your monitor’s endpoint.
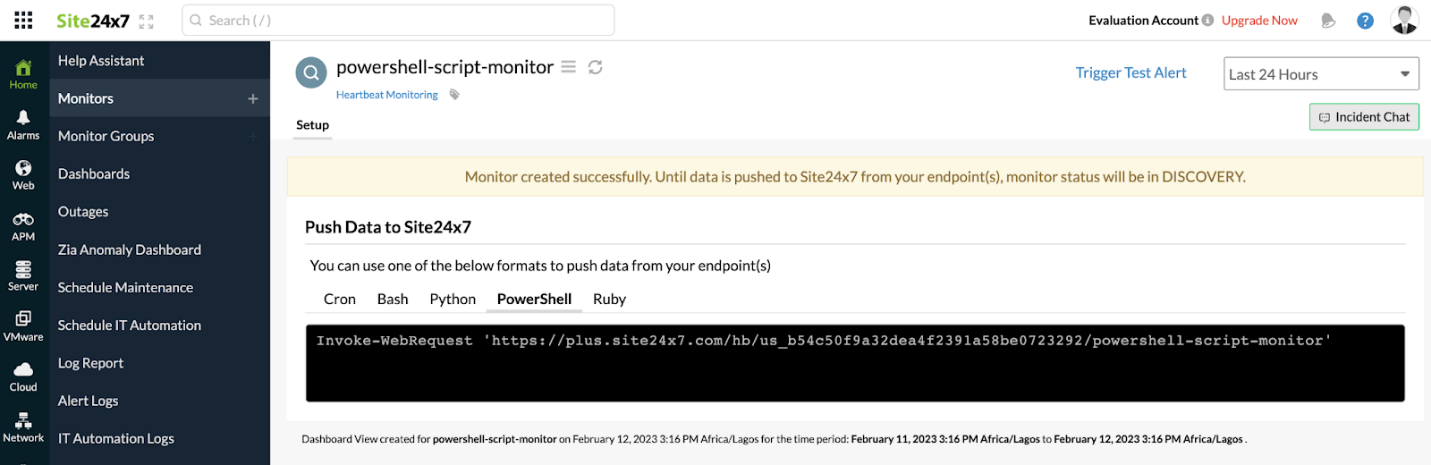 Fig. 9: Making a GET request from the PowerShell tab
Now, you’ll add the heartbeat monitor to the PowerShell project.
Modify your task.ps1 script with the code below to add the Invoke-WebRequest cmdlet. This cmdlet pings the heartbeat monitor when the script executes successfully and removes the code for making a log entry.
Note: Replace the HEARTBEAT_MONITOR_ENDPOINT_URL placeholder below with your unique heartbeat monitor URL:
 # This code is part of task.ps1 and is part of “powershell-task-monitor” directory.
for (($i = 0); $i -lt 20; $i++) {
   $a = Get-Random -Maximum 20


   if ($a -eq $i) {
       throw "TASK FAILED AT ROUND: $i"
   }
}

Write-Host "TASK SUCCESSFUL!"
Invoke-WebRequest 'HEARTBEAT_MONITOR_ENDPOINT_URL'
Next, execute the task.ps1 script multiple times until it both fails and succeeds.
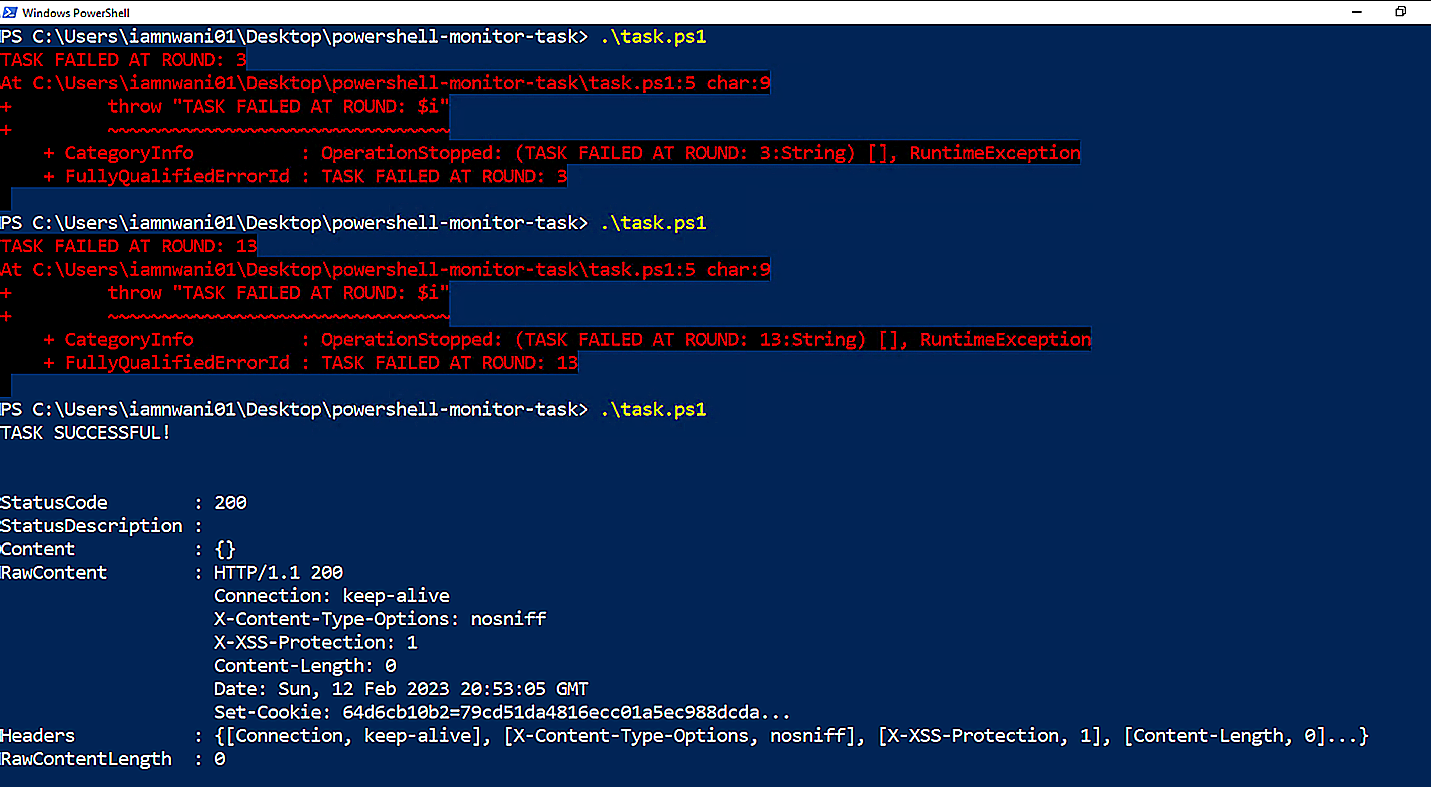 Fig. 10: Executing the task.ps1 script repeatedly
Your heartbeat monitor dashboard provides concise details about when and at what intervals the ping registered.
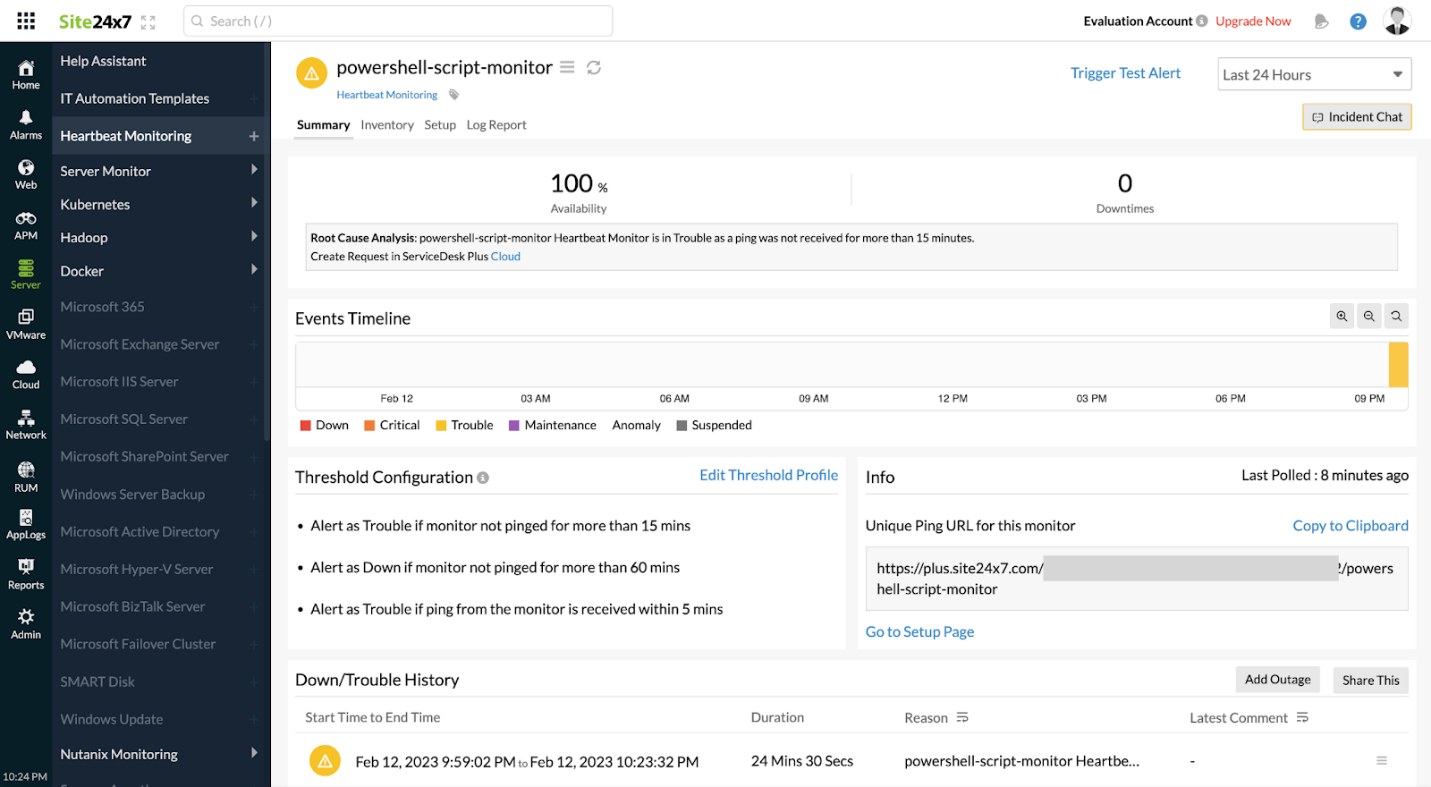 Fig. 11: Heartbeat monitor dashboard showing ping details
Heartbeat monitor offers an improved developer experience over the previous DIY solutions of manually writing log entries. Its web interface allows you to access your logs from any internet-connected device and enables you to configure SMS or email notifications that alert the administrator or team members whenever an outage occurs.
You’ve now explored numerous strategies for monitoring the execution of your scheduled PowerShell tasks and experienced the benefits and drawbacks of each approach.
While you can manage simple tasks using DIY solutions, 24x7’s heartbeat monitor excels at handling complex systems. It tracks and monitors the availability of your PowerShell scripts, offering several essential features. These include automatically aggregating your tasks’ monitored data and creating detailed visual reports that highlight the most valuable insights.
The heartbeat monitor is one of many advanced monitoring tools that Site24x7 offers. You can explore more about both basic and advanced monitoring solutions or request a demo for an engaging, hands-on experience.
Site24x7 Heartbeat Monitoring provides a unique URL endpoint that your scheduled tasks, cron jobs, or background scripts can ping upon successful execution to verify they are running as expected.
Yes, Site24x7 can alert you if a scheduled Azure PowerShell task fails to run. If Site24x7 does not receive a ping from your scheduled task within the configured time window, it will trigger an alert notifying you of the failure.
Integration is as simple as adding a single line of code using the `Invoke-WebRequest` cmdlet to make an HTTP GET or POST request to your unique Site24x7 Heartbeat URL at the end of your script.