Application performance issues are common. That's the nature of software development. Some may argue that optimization is as important as ensuring that your application is functional. True or not, efficient and effective optimization requires you to first pinpoint the cause of your project's performance dips.
Your Java application may suffer from performance issues for a number of reasons, including memory leaks, thread deadlocks, and poor garbage collection. However, in some cases, it may be due to mismanaged calls to remote data sources. If your Java application heavily relies on intensive remote database server calls, it probably uses multithreading for concurrency.
This approach has a high risk of causing database deadlocks. Performance issues are sometimes caused by the type of data source you're using. For instance, distributed databases https://www.cockroachlabs.com/blog/what-is-a-distributed-database/ tend to be harder to troubleshoot than centralized relational or NoSQL databases. These are just a few potential causes. This guide will explore further causes and provide practical recommendations on how to address them.
Performing calls to remote database servers isn't a new concept. However, in recent years, much of the IT industry has had to embrace distributed system architecture to cope with the rapidity at which data is produced through modern computing, IoT, and mobile technology.
The goal is to make remote calls to data sources as seamless as possible. Just as sluggish loading speeds https://buddypunch.com/blog/why-users-leave-your-website-and-how-to-fix-it/ lead to people leaving web pages, software that is full of bugs or performs slowly will drive users away. Performance issues may occur suddenly in a once-efficient application, especially if it uses remote database queries and calls. This may be due to network-related connection issues that have nothing to do with your application, the remote database, or its server. Often, these issues are caused by sudden spikes in network traffic, hardware failure, and, in some extreme cases, cyberattacks.
While network-related issues are usually easy to diagnose and remedy, troubleshooting remote calls to a distributed database can be tricky. Distributed databases span multiple servers or nodes, making them more robust and increasing scalability. However, they're more challenging to manage than centralized databases.
Distributed database management systems are susceptible to concurrency issues and deadlocking. Companies that elect to use this database management system must implement effective distributed concurrency control, distributed deadlock management, and replication control. Typically, you should optimize your application's remote database calls for a distributed database system as much as your operating environment is. However, the first step in troubleshooting is finding the source of the issue.
Imagine a scenario where you're writing a Java application that makes it easier for epidemiologists to track the spread of certain diseases. It needs to support intersectionality https://epiresearch.org/2022/08/10/intersectionality/ and various other frameworks.
Your epidemiological application should adopt a modular design approach to efficiently handle the rapid spread of infections and frequent calls to various data sources. A modular design lets you isolate each feature and function. The application also needs to retrieve data from a remote database server containing a simple relational database with continuously updated information spanning the last two decades.
The critical data you'll be working with includes the names of infected individuals and the affected cities in France. It's written and managed in PostgreSQL https://www.postgresql.org, an open source relational database management solution that is managed using Transact-SQL (T-SQL). Thus, you use the JDBC API https://docs.oracle.com/javase/8/docs/technotes/guides/jdbc/ along with the PostgreSQL driver to connect your Java application to the database and fetch data from it. It's a simple enough solution.
Initially, the application functioned correctly, but over time, it started slowing down and occasionally freezing or becoming unresponsive. You can be somewhat confident that it isn't a code-related issue—at least not strictly. However, there could be potential issues with the database server or recent updates causing these problems. You need a tool to help you track, trace, and potentially debug any issues causing your application's performance dips. But before troubleshooting, let's look at how the remote database is set up.
The database and its objects are kept on a remote server that is accessed through a wide area network (WAN)/internet connection. However, you can adapt this example to a cloud-based database server or a database server that is kept on your local network.
You'll use some mock data for the example. In this case, the example uses two database/data set samples for comparison:
The IMDb data set is extremely large. When the data is decompressed and imported https://medium.com/@rlwong2/importing-a-tsv-file-into-postgres-364572a004bf into a Postgres database table, its size can be as much as 1.2 GB.
On the other hand, the largest table from Harry Moreno's French Towns sample (Towns) is just under 4 MB. Now that the database has been established, you need to set up a client that will make remote calls to it.
Your remote calls will be handled by a single class:
import java.sql.*;

public class RemoteCaller {
	private final String url = "jdbc:postgresql://<IPAddress>/remotedb"; //Insert IPAddress to remote database
	private final String user = "postgres";
	private final String password = "*****"; //Insert Password

	public ResultSet fetchRecords() throws SQLException {
        	Connection conn = DriverManager.getConnection(url, user, password);
        	Statement state = conn.createStatement(ResultSet.TYPE_SCROLL_INSENSITIVE,ResultSet.CONCUR_UPDATABLE);
        	ResultSet resultSet = state.executeQuery("SELECT * FROM names");
        	return resultSet;
	}

}
The RemoteCall class contains a single method (fetchRecords) that connects to a remote database (remotedb) and then fetches all the records from the names table.
You can then call this method from the Main class's main method:
import java.sql.ResultSet;
import java.sql.SQLException;

public class Main {

	public static void main(String [] args) {
    	RemoteCall remoteCall = new RemoteCall();
    	try {
        	ResultSet resultSet = remoteCall.fetchRecords();
        	while (resultSet.next()) {
            	System.out.println(resultSet.getString(2));
        	}
    	} catch (SQLException sqlException) {
        	throw new RuntimeException(sqlException);
    	}

	}
}
The sample Main class's Main method uses a while loop to iterate through the ResultSet retrieved using the fetchRecords method. It then prints out each record contained in the second column (primaryName) of each row.
Now that you're familiar with the source code and database, let's look at how to troubleshoot and figure out why the application or module is performing sub-optimally.
The most effective way to measure the performance of your application is through a profiler. A profiler allows you to dynamically analyze your application's resource management, how long specific method calls take, and so on. It can be viewed as a performance "debugger."
JProfiler https://www.ej-technologies.com/products/jprofiler/overview.html is one of the most widely used Java application profiling tools. It's designed for Java application monitoring and has many helpful features. However, it does have a few limitations, including JProfiler’s licensing https://www.ej-technologies.com/buy/jprofiler/select type. It's paid software and only offers new users a twelve-day evaluation period.
Nevertheless, you can download JProfiler as either a standalone application or integrate it into your IDE. You may prefer the latter because it's easier to incorporate it into your workflows. In either instance, you'll need the JProfiler executable installed on your system. This will require you to download and run JProfiler's official installer https://www.ej-technologies.com/download/jprofiler/files.
The installer uses a standard wizard. In addition to allowing you to configure JProfiler, it will allow you to integrate JProfiler with your Java IDE. This guide uses the community version of JetBrains IntelliJ IDE(A) https://www.jetbrains.com/idea/download/.
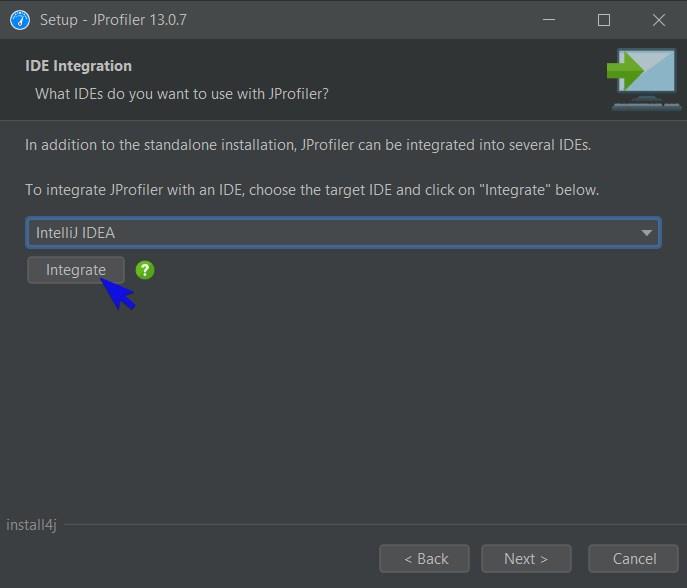 Fig. 1: Integrating JProfiler
The Integrate button isn't of much use for IntelliJ. Upon clicking it, you'll be met with a set of instructions that ultimately inform you that the JProfiler plugin for IntelliJ can be downloaded from the JetBrains Marketplace https://plugins.jetbrains.com/plugin/253-jprofiler.
Follow the rest of the installation wizard's screens, choosing the appropriate options where necessary. After JProfiler is installed, you can use it to troubleshoot a few intensive remote database calls.
Upon successfully installing the JProfiler plugin for IntelliJ, a new button should appear in the upper-right toolbar. You can profile your application using this button:
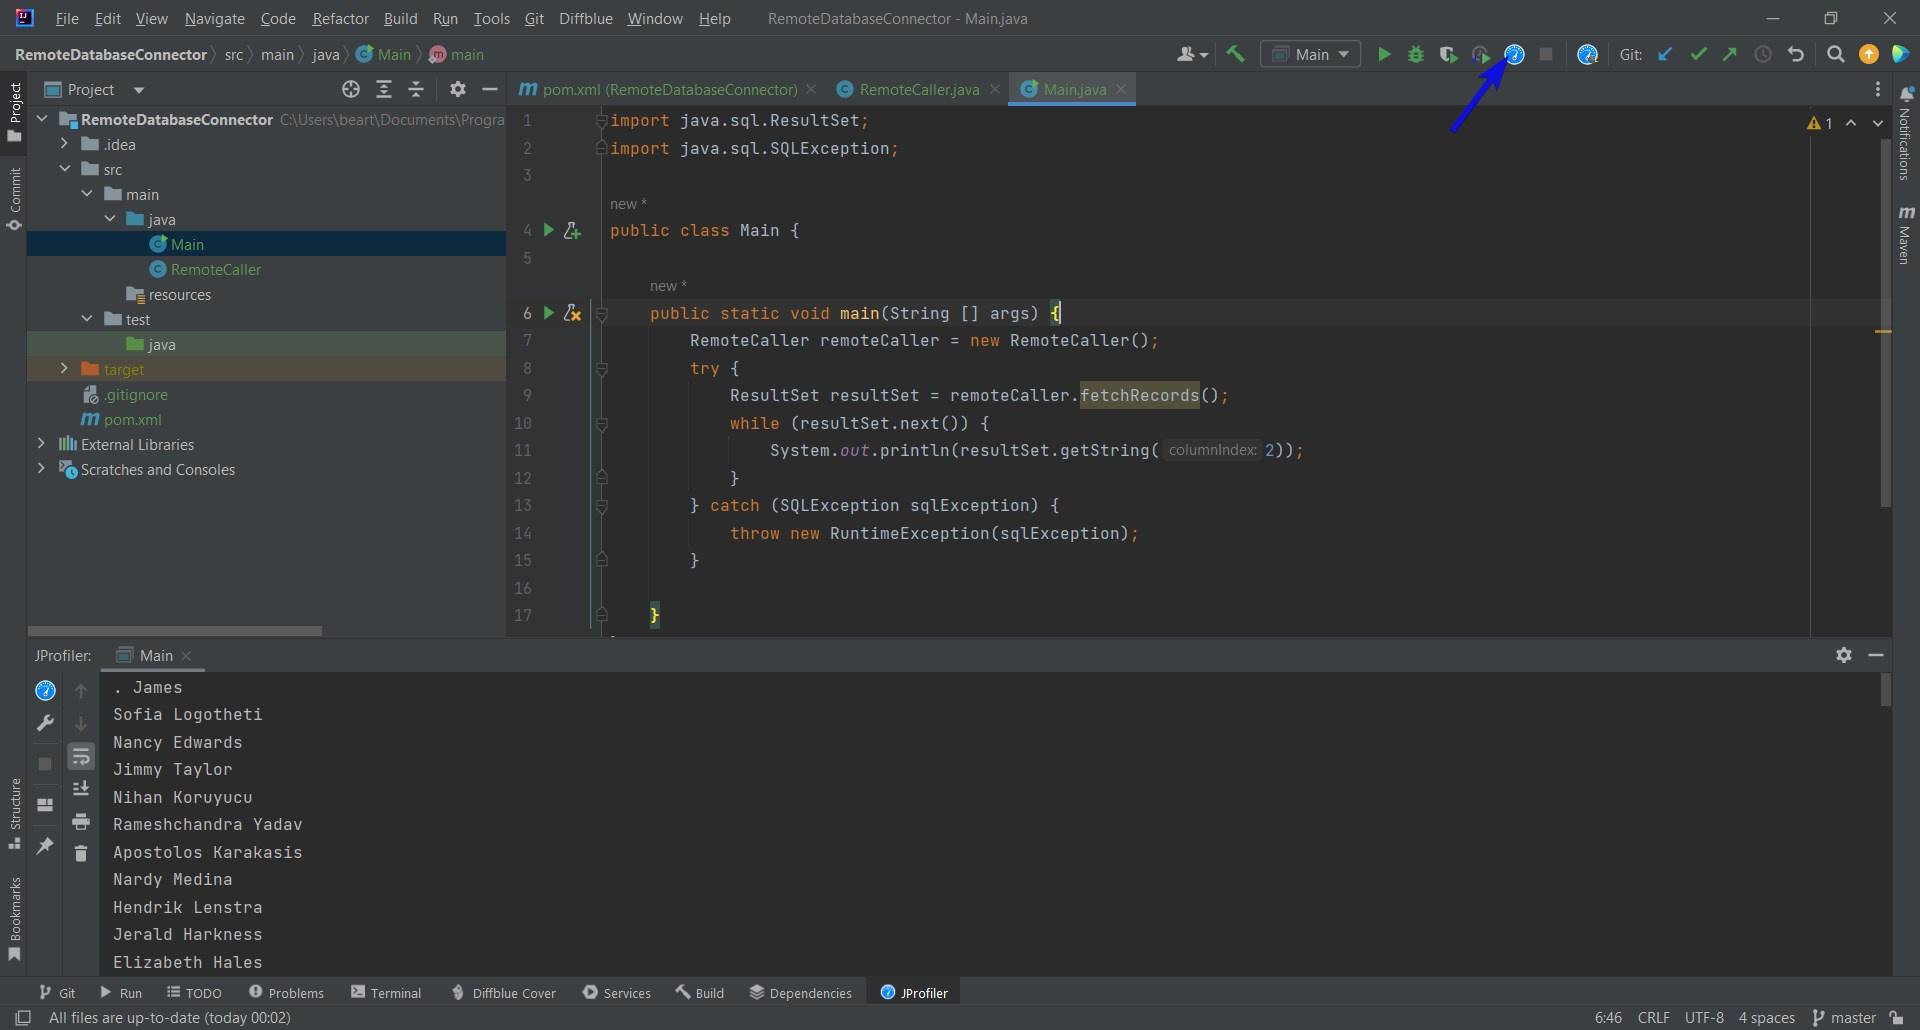 Fig. 2: JProfiler button
JProfiler will need to be configured before you can use it.
After JProfiler launches for the first time, it will display a dialog informing you that JProfiler is unlicensed.
Click the Evaluate button to enter a trial period for JProfiler.
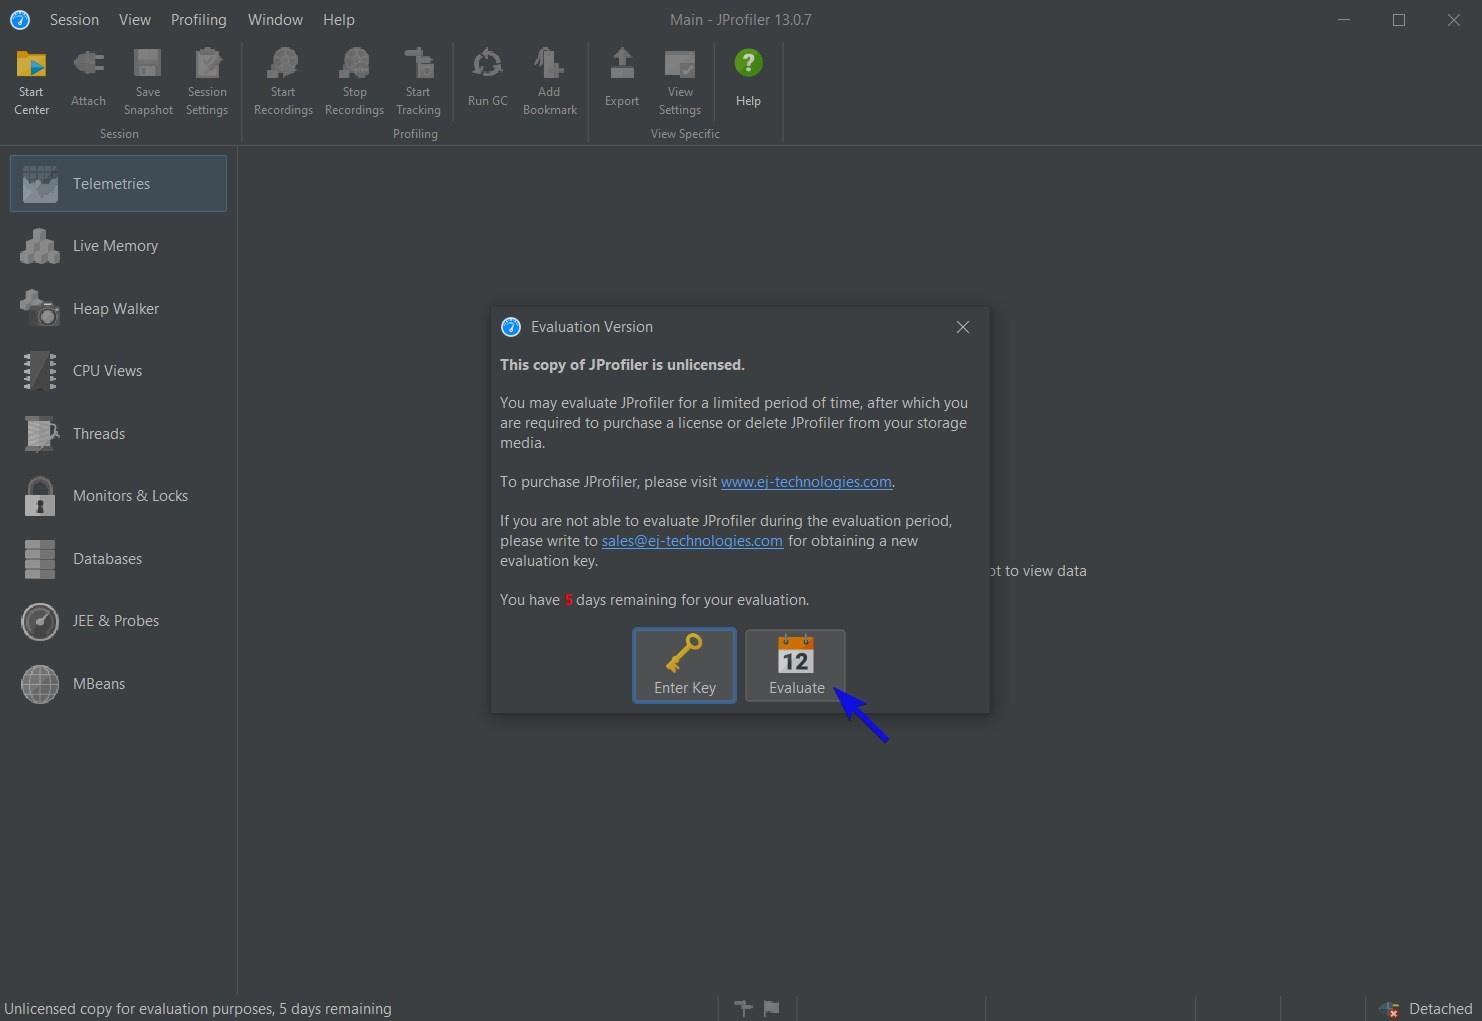 Fig. 3: JProfiler evaluation period
Alternatively, click the Enter Key button if you have a valid JProfiler license.
Upon running JProfiler for the first time for this project, it will ask you if you would rather record method calls https://www.ej-technologies.com/resources/jprofiler/help/doc/main/methodCallRecording.html using an instrumentation or sampling technique. For this demo, you'll use instrumentation because it's ideal for measuring I/O-bound code (as opposed to CPU-bound code https://www.baeldung.com/cs/cpu-io-bound.
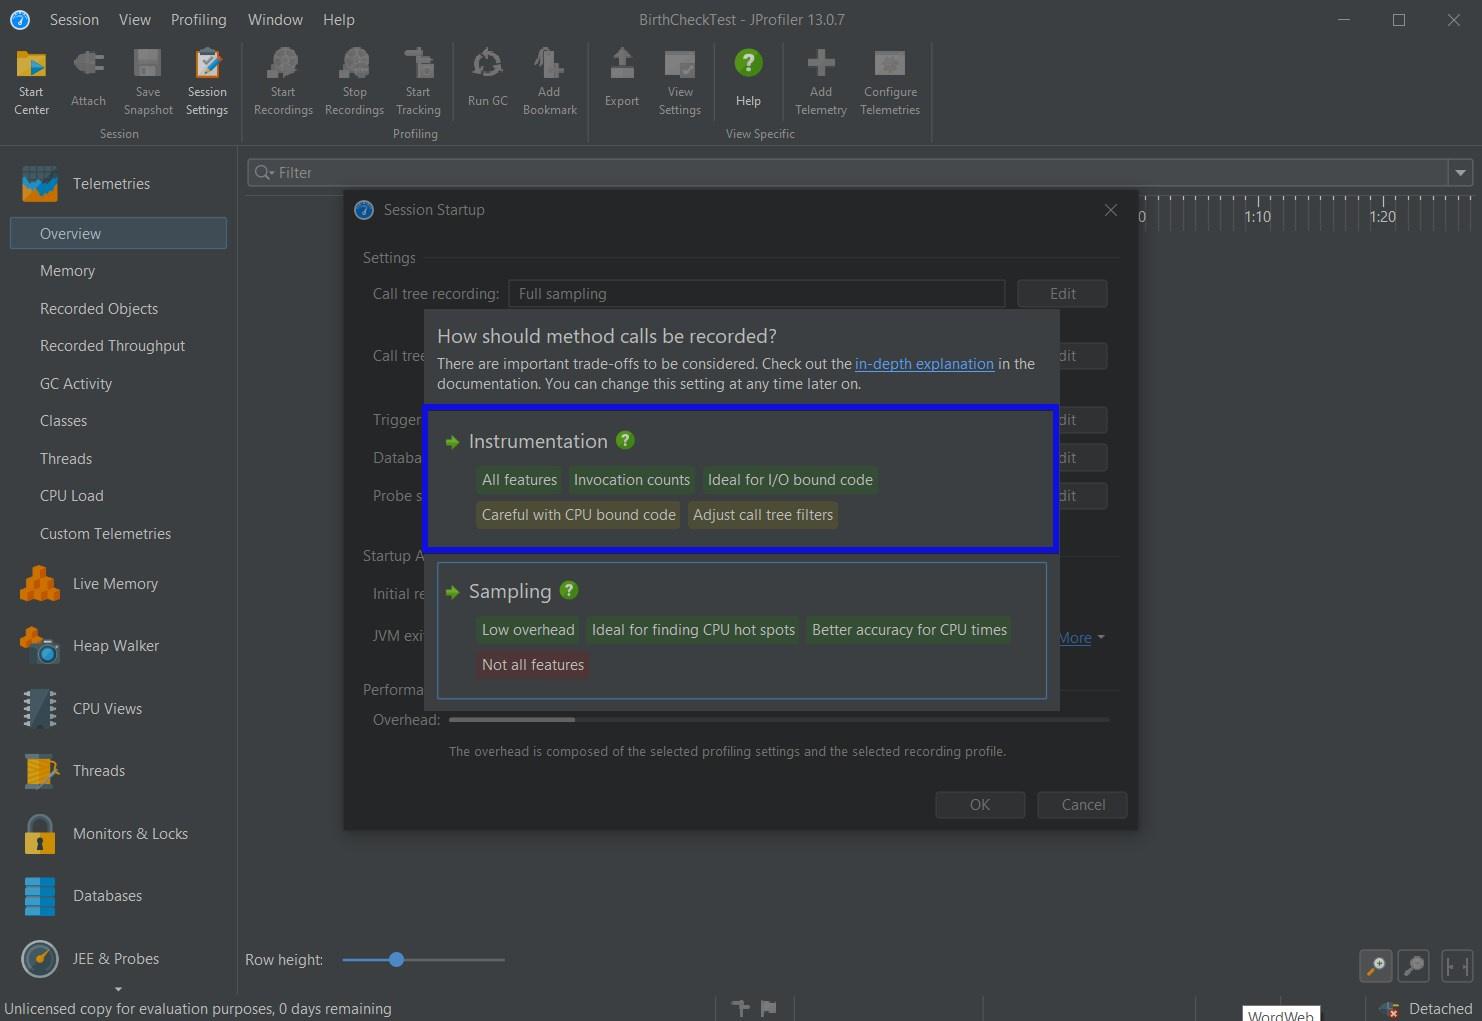 Fig. 4: Instrumentation or sampling
The application fetches data from a remote source using a network connection. Thus, profiling should not just focus on data processed locally by the CPU.
JProfiler gives you an opportunity to fine-tune the settings for your profiling sessions. For this tutorial, you can leave everything as is on this screen and click the OK button:
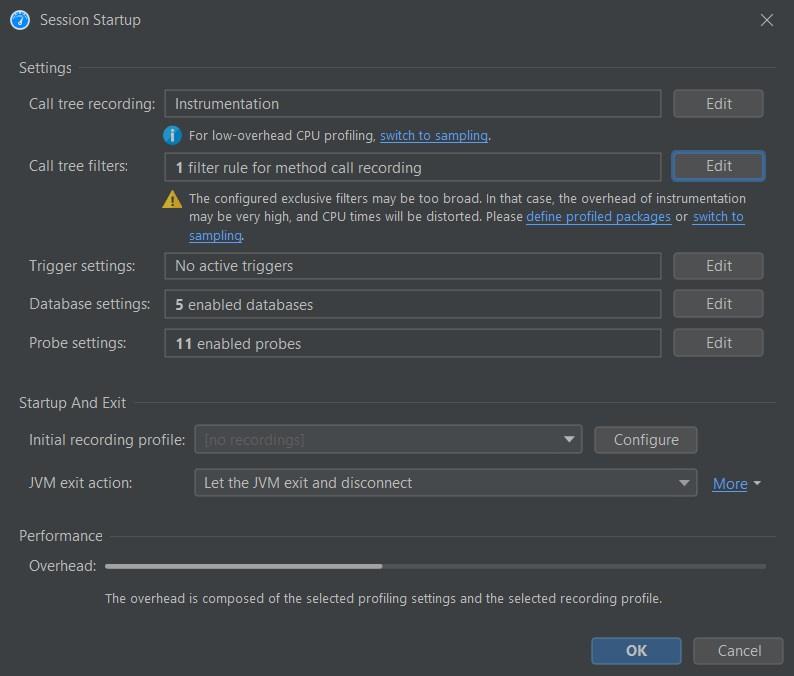 Fig. 5: JProfiler session startup screen
Once you're done configuring JProfiler, you can minimize it and return to the IntelliJ interface. Your application should be running and printing out a list of names in the console, but it seems to be frozen:
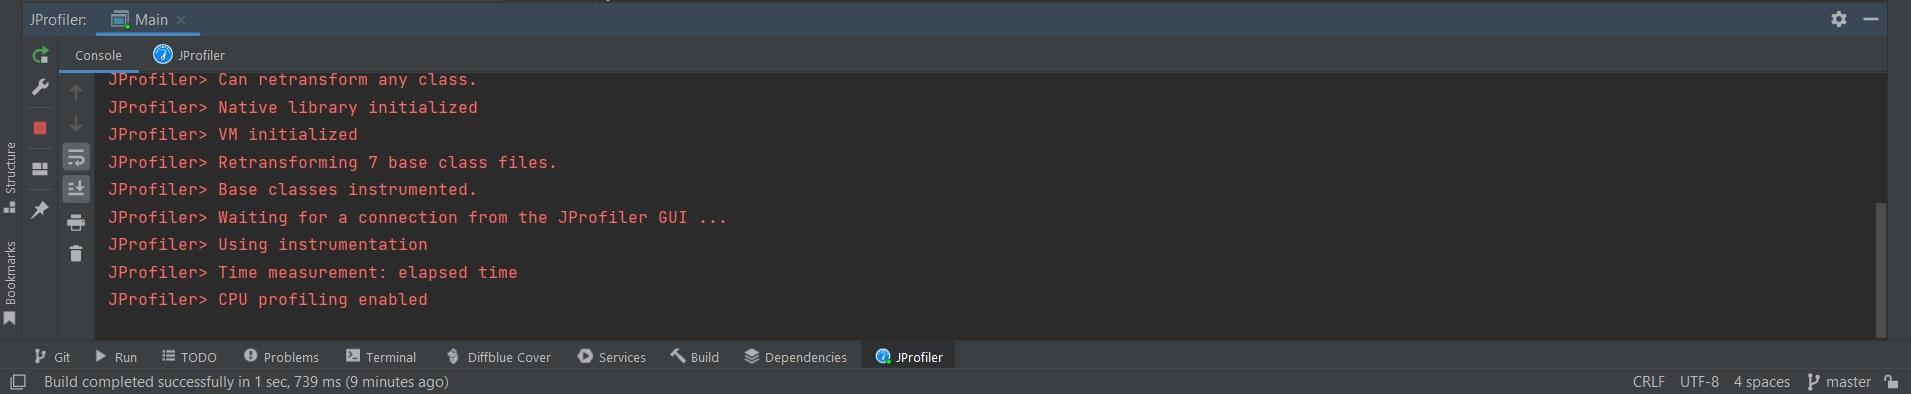 Fig. 6: JProfiler output
JProfiler offers quite a few approaches to monitoring your application and its objects, which might help identify the problem. However, recording and observing telemetries https://www.ej-technologies.com/resources/jprofiler/help/doc/main/telemetries.html, live memory https://www.ej-technologies.com/resources/jprofiler/help/doc/main/memory.html, or threads https://www.ej-technologies.com/resources/jprofiler/help/doc/main/threads.html won't help you much with this issue. If you record and analyze your objects using these methods, you'll soon see that the problem isn't a memory leak or a connection issue.
This makes it harder to diagnose the issue, especially if it's originating from the server side. As a rule of thumb, when working with intensive database calls, You should first check for any database deadlocks or blocks.
You can access monitoring and locking information from JProfiler by clicking the Monitor & Locks option. This should also open the Current Locking Graph screen.
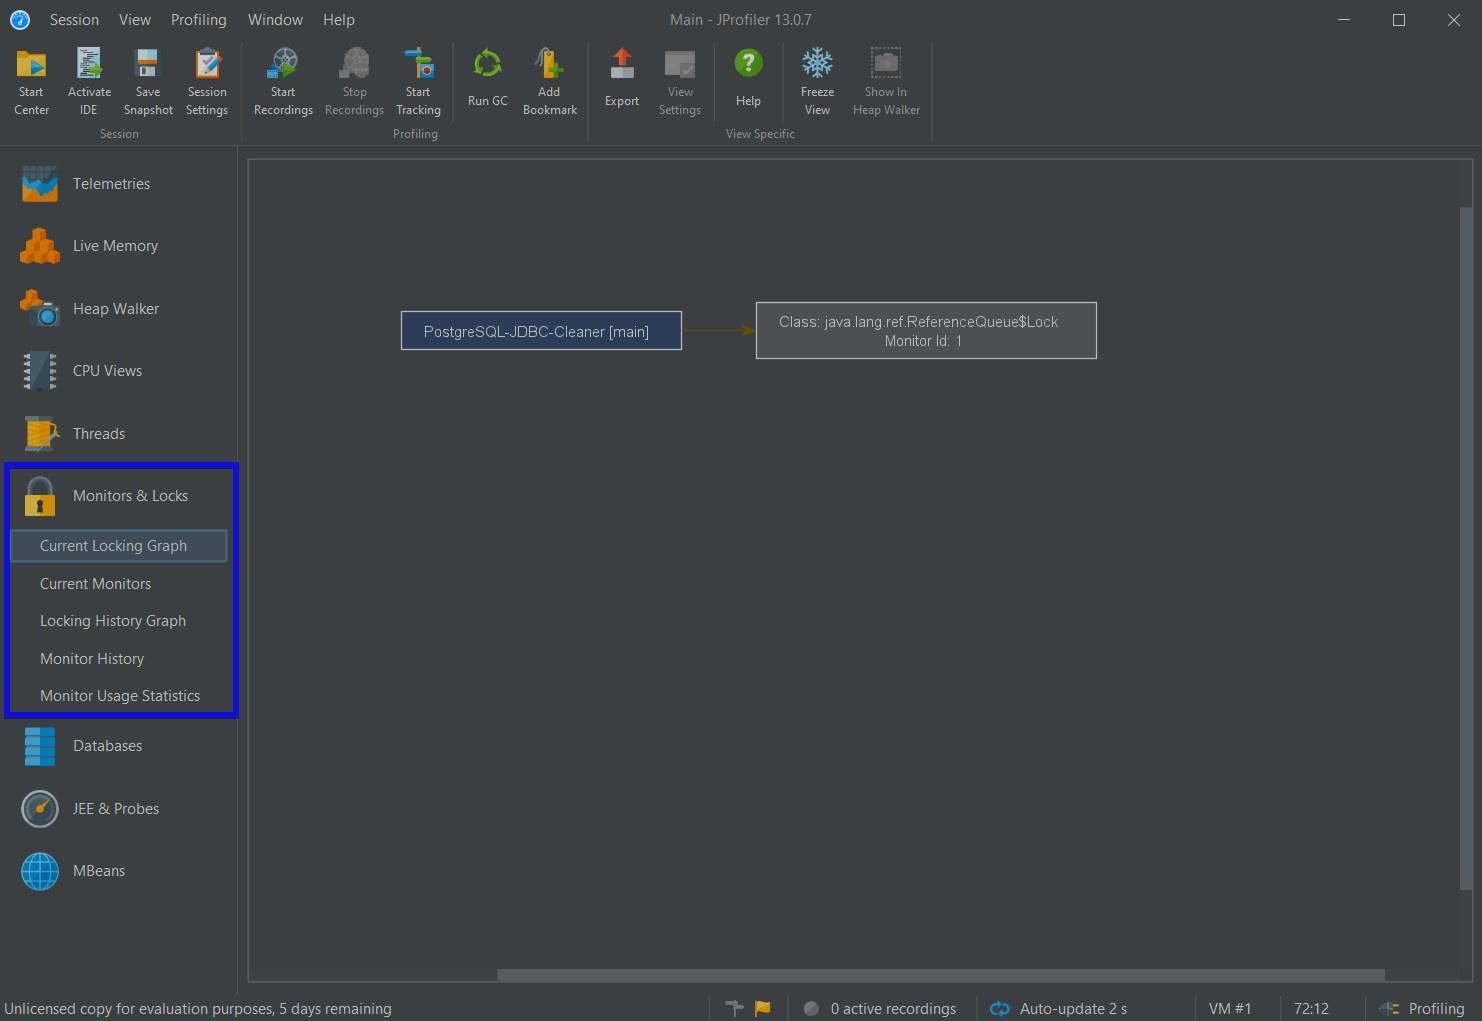 Fig. 7: Monitor & Locks option
From the above image, you can see that the main method calls PostgreSQL-JDBC-Cleaner, which is in a deadlock as it's waiting for a process to complete. This process is responsible for performing or activating garbage collection. You can get more information by clicking the Current Monitors option:
It will show you which thread is waiting and, in some cases, which threads are causing blockages:
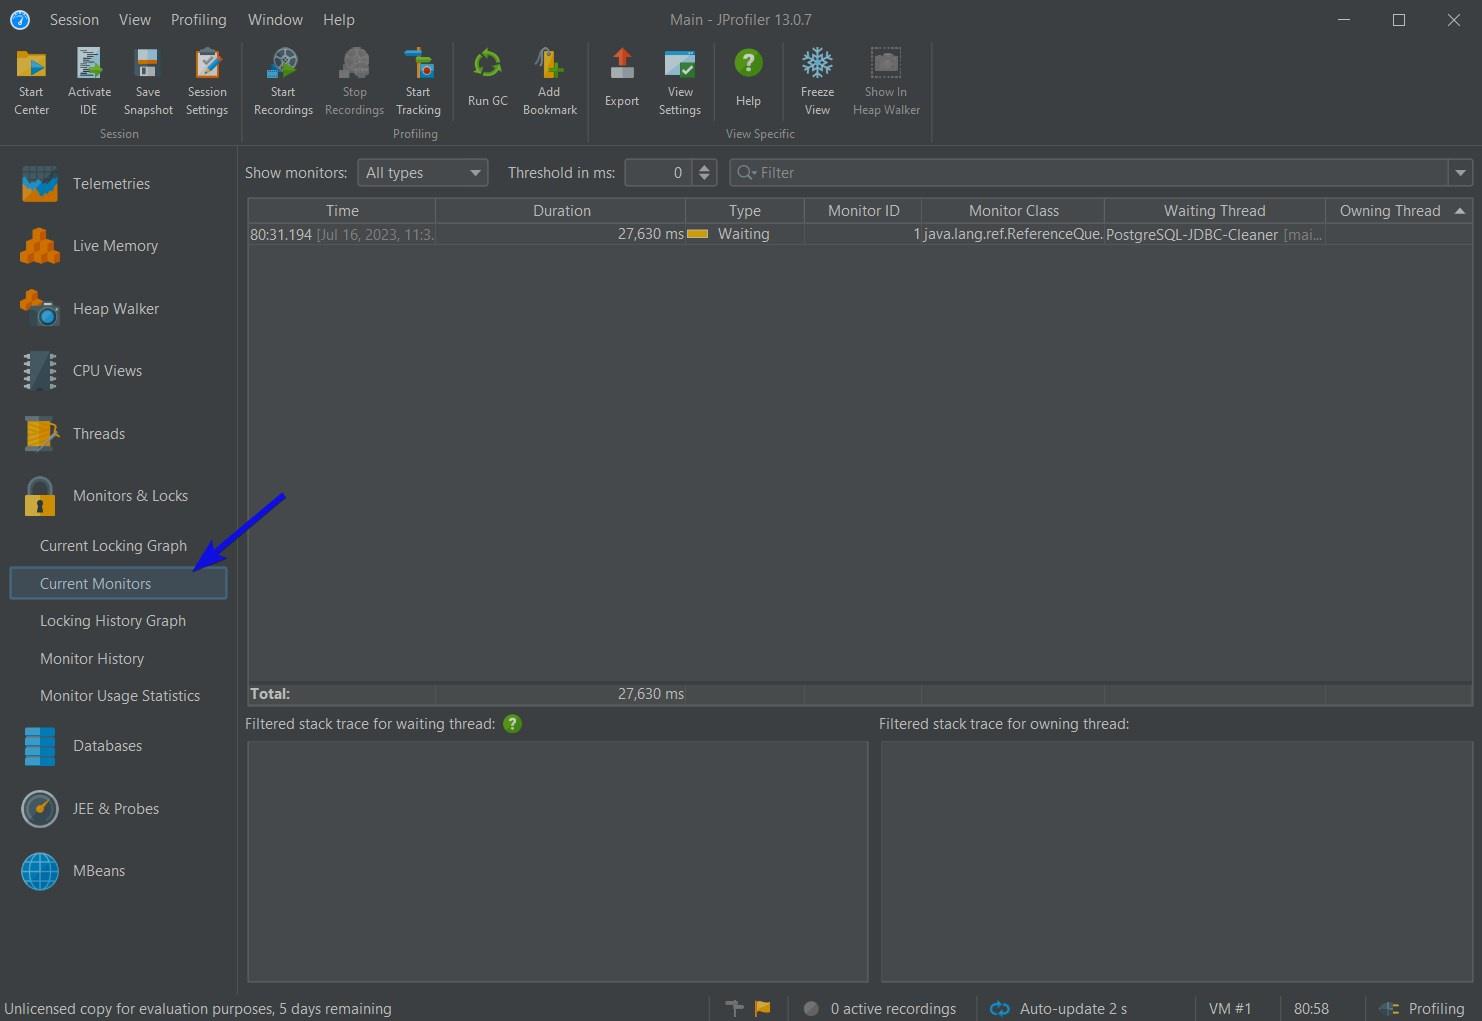 Fig. 8: Current Monitors
Again, it shows that the PostgreSQL JDBC Cleaner thread is waiting, but it doesn't explain why it's waiting or is stuck (ie what's causing the lock). From the JProfiler screen, you can see that the PostgresSQL-JDBC-Cleaner object is queued for garbage collection.
These objects are automatically called by the JVM to help it perform better. Unfortunately, it seems that while JProfiler may be able to provide you with a few clues, you'll need to employ a bit of trial and error to figure out what's causing the error. This will also help you ascertain if the issue is related to the code or connection.
Close the JProfiler window and return to IntelliJ's interface. Click on the stop button to completely terminate the JProfiler session.
![Terminate JProfiler]](http://img.site24x7static.com/images/troubleshooting-performance-issues-java-application-terminate.jpeg) Fig. 9: Terminate JProfiler]
Fig. 9: Terminate JProfiler]
You can edit the code to fetch the records from the `Towns` table instead of the names table. The Towns table is smaller, so it should be less intensive:
ResultSet resultSet = state.executeQuery("SELECT * FROM Towns");
If your network connection is fast enough, JProfiler should run your session and complete it within hours. It should produce something closer to the intended output:
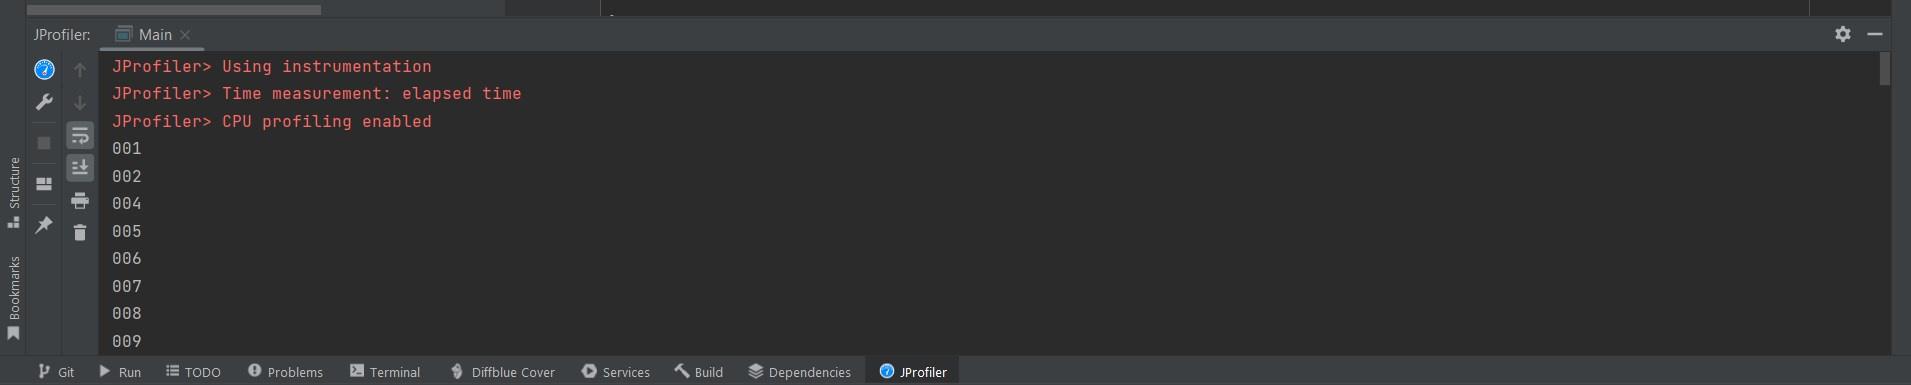 Fig. 10: JProfiler desired output
So what's the problem? The `names` table fetch query would be hard to execute remotely from a PostgreSQL client. The result set is much too big. If you leave the application or query running over time, it may eventually return the results from the `names` table and finally close the garbage collection deadlock organically.
Of course, you don't want to fetch data from the names table. You need to find a more optimal approach to querying the table.
The first step is to refine the T-SQL in your query. For instance, you can choose to fetch just the first 100 records:
ResultSet resultSet = state.executeQuery("SELECT * FROM names TOP 100");
When you profile the application now, it should have no problem processing the query:
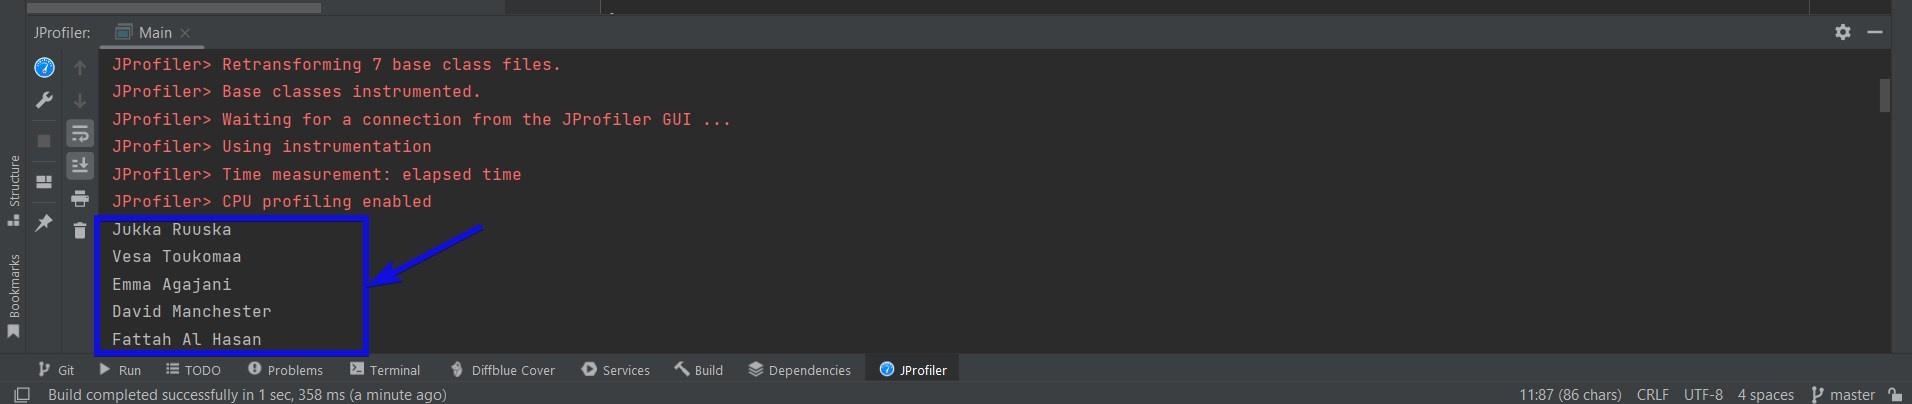 Fig. 11: Lists of names
You can fetch your data in sets of 100s or use a (for) loop to fetch the data in alphabetical chunks. This is a form of a design pattern known as chunking https://www.unidata.ucar.edu/software/netcdf/workshops/2011/nc4chunking/WhatIsChunking.html or batch processing https://www.baeldung.com/java-ee-7-batch-processing. Other design patterns you can use to optimize your remote database calls include:
Regardless of which method you use, you must be able to effectively identify what's causing performance dips in your project. Applications like JProfiler (at least the evaluation) may not always be ideal for this. While it's rich with features, it just isn't accessible. You may find that you're better off using trial and error.
Performance tuning and engineering are crucial parts of software engineering whose importance is often understated. If not implemented well enough, they can impede the development and release cycles. The key takeaway here is if you run into performance issues or freezes due to your intensive remote database calls and all you have is JProfiler at your disposal, the first step is to try to find any locks. You can also try viewing the telemetry and memory data to see if there are any network or RAM-related issues.
If you find that there is a lock, try fetching only a small chunk of your data to see how quickly your query or application executes. In addition to tuning your source code, it's also highly recommended that you do the same for your database server. This can be as simple as ensuring that your database management software has been updated to the latest version or vertically scaling your database server.
As this guide has shown, using traditional profiling tools can be overwhelming. Their user interfaces tend to be cluttered, and their functionality is outdated. Furthermore, they don't give you much time to evaluate and use them. You need a more accessible tool that can help you address modern performance issues—one that can cope with the scalability of the systems you're working with. Site24x7's Java Application Monitoring tool is this and more. Try it today and see how much easier it is to troubleshoot your remote calls made from your Java application.
Site24x7 APM Insight automatically intercepts Java Database Connectivity (JDBC) calls, capturing SQL queries, execution times, and identifying slow queries causing remote access bottlenecks. Site24x7 uses CloudWatch APIs to collect AWS metrics if your database is hosted on AWS.
Yes, Site24x7 APM Insight offers end-to-end distributed tracing to seamlessly follow Java transactions as they span across remote web services and databases. This feature is specifically designed for website/URL monitoring, not for network latency monitoring.
Site24x7 allows you to configure alerts based on transaction latency or error rate, sending notifications if remote calls start slowing down your Java application. You can set up both custom thresholds and dynamic thresholds (AI-based anomaly detection) for these alerts.