Unlike languages like C and C++, where developers need to manually handle memory allocation, the common language runtime (CLR) in the .NET framework provides an automatic memory manager called the garbage collector (GC). The GC manages the allocation and deallocation of memory for objects in a .NET application to simplify development, reduce memory leaks, and improve overall code safety.
This article introduces garbage collection in the .NET framework, explaining its essential characteristics and functions. It then examines various memory management challenges associated with garbage collection and explores their corresponding solutions.
Garbage collection in the .NET framework is a key component of the CLR and is crucial in managing memory resources in .NET applications. The key concepts in the upcoming sections will help you better understand the GC's role.
Managed resources are resources that are managed and controlled by the CLR. The GC is aware of all managed resources in the runtime environment and will automatically clean up their memory and associated resources. Developers working with managed code don't have to write code to perform memory management tasks.
Unmanaged resources, which include file handles, COM objects, and database connections, are not managed by the CLR and are not automatically garbage collected. Developers must explicitly handle these resources to avoid memory leaks and locked resources.
Each processor heap in the CLR comprises a small object heap (SOH) and a large object heap (LOH). Objects less than 85 KB are placed on the small object heap, while objects larger than 85 KB are stored on the large object heap. The GC periodically compacts memory in the SOH by copying it to another location on the heap to reduce memory fragmentation. Since moving large objects around in memory is time-consuming and CPU-intensive, objects in the LOH are not compacted. Instead, the GC removes large objects when they are no longer needed. This process, however, creates holes in the large object heap, resulting in memory fragmentation.
The GC uses a generational garbage collection algorithm to manage memory. To optimize performance, the GC releases memory in each object generation https://learn.microsoft.com/en-us/dotnet/standard/garbage-collection/fundamentals#generations separately instead of the entire heap all at once.
New objects are first allocated to the youngest generation, Generation 0. Garbage collection starts by examining the objects in Generation 0. Since most objects are collected in it, Generation 0 is compacted more frequently to prevent high memory pressure (where available memory becomes too low).
Generation 1 is an intermediate generation between Generation 0 and Generation 2, which contains the longest-lived objects. Reachable objects remaining after the garbage collection of Generation 0 are compacted and moved to Generation 1. Objects in Generation 1 that survive subsequent garbage collections are then moved to Generation 2. Garbage collection in Generation 1 and Generation 2 only occurs if more memory needs be reclaimed after Generation 0 is garbage collected.
Generation 2 contains long-lived objects such as static data that remains in memory for the duration of an application. Objects remain in this generation until they are determined as unreachable by garbage collection. The large object heap, sometimes referred to as Generation 3, is collected as part of Generation 2.
Structs are value types typically stored on the stack or inline within other objects, and their memory is managed automatically by the runtime. Because memory for structs is not allocated on the heap, there is no need for garbage collection. However, structs are sometimes treated as objects via boxing and unboxing. Boxing wraps the value type inside an object reference, while unboxing extracts the value type and casts it back to its original type. When a struct is boxed, it requires memory allocation on the heap and is subject to garbage collection, adding overhead that incurs a performance cost.
Classes in .NET are reference types, meaning that when an object of a class is instantiated, a memory reference to the object is stored on the managed heap. The GC handles the allocation and deallocation of memory for classes. During garbage collection, the GC traces references to the object to determine if it is still in use and marks it for garbage collection based on its reachability.
Memory allocation is the process of reserving and assigning memory space for objects and data structures during the execution of a .NET application. The CLR dynamically reserves memory on the managed heap for objects created using the "new" keyword or by initialization and allocates them to Generation 0. The GC performs frequent garbage collection on Generation 0 to reclaim memory from short-lived objects. The CLR also uses techniques such as compaction to reduce fragmentation, object pooling to minimize memory allocation, and deallocation to optimize memory usage and performance.
Memory release in .NET is automatically handled by the GC, which identifies and reclaims memory allocated to objects that are no longer referenced. This excludes unmanaged objects, which require special clean-up using a finalizer method or the Dispose pattern to release resources explicitly.
During garbage collection, the GC uses the "mark and sweep" technique, which marks all reachable objects as "live," then sweeps through the managed heap to reclaim memory from "dead" objects. Memory reclamation by the GC is based on factors such as memory pressure (the available memory resources of the application), CPU utilization, and object generation.
In the .NET framework, garbage collection is triggered automatically by specific events or criteria, including low memory, an exceeded threshold, and the GC.Collect() method being called.
The GC monitors the memory available in the system and initiates a garbage collection cycle to free resources and reclaim memory when there is high memory pressure (memory becomes scarce). The memory pressure threshold can vary based on the system configuration and runtime environment.
Garbage collection also occurs when the number of allocations for a generation exceeds the acceptable threshold. The threshold for a generation is set dynamically by the garbage collector based on the application's resource requirements and memory usage patterns. The threshold is continuously adjusted as the GC allocates objects to the generation. A garbage collection cycle is triggered for that generation when the threshold is exceeded.
The GC.Collect() method allows developers to trigger garbage collection at a specific point in their code. It bypasses the automatic garbage collection mechanism to trigger a forced garbage collection on the entire managed heap. Calling GC.Collect() without parameters causes all objects in all generations to be considered for garbage collection. Passing GC.MaxGeneration as an argument to GC.Collect() results in the LOH being collected along with the rest of the managed heap.
The garbage collection process comprises three phases that work together to identify and collect unused objects:
In the marking phase, the GC finds and creates a list of all the objects in the managed heap that are in use and need to be retained. The GC starts at the root of the application with objects such as global variables, static objects, and references on the stack and moves up the object graph to mark reachable objects as "live." Objects not on the list are considered unreachable and become potential candidates for garbage collection.
The relocating phase occurs if the GC determines that there is significant fragmentation in the managed heap. It updates the references of all the live objects on the list to point to the new location where they will be moved during the compacting phase. The GC does this by maintaining a forwarding address for each relocated object. References to the object are redirected to the new location using the forwarding address.
The compacting phase reclaims the space occupied by the "dead" objects and compacts the surviving ("live") objects. It does this by moving live objects into contiguous address space and freeing up fragmented memory regions. Surviving objects are moved toward the older end of the heap memory in their original order. The compacting phase depends on memory allocation and fragmentation patterns. If there is sufficient memory available and the level of fragmentation is low, the compacting phase may not occur during a garbage collection cycle.
While garbage collection in .NET provides many benefits, there are a few performance issues that can arise. The following sections cover some of the potential problems and provide suggestions for optimizing performance.
An out-of-memory exception occurs when an application has run out of available memory resources and cannot allocate additional memory to new objects and data structures. Frequent out-of-memory exceptions can cause increased garbage collection cycles and increased CPU usage, leading to application performance degradation.
 Fig. 1: Microsoft Windows Debugger
To resolve this issue, you can use tools such as WinDbg or the Visual Studio debugger to help you determine if the exception is managed or unmanaged, identify and fix memory leaks in the application, and find objects that are not being released properly. The Performance tab in Windows Task Manager can also show you if you are running low on physical memory.
A large Generation 0 collection requires more time and resources to scan for live objects. This results in longer pauses for garbage collection and increased CPU usage, which can degrade performance and reduce application responsiveness.
Generation 0 performance issues can be resolved by adjusting the thresholds for the collection to help control its size and frequency based on the application's memory usage patterns and performance requirements. You can also use profiling and performance monitoring tools to identify when the Generation 0 collection is becoming excessively large, analyze the causes, and perform targeted optimizations to minimize the impact.
When the number of collections is too frequent or the collection process takes too long, it can cause high CPU or memory usage by the GC, increased memory fragmentation, and a drop in application performance.
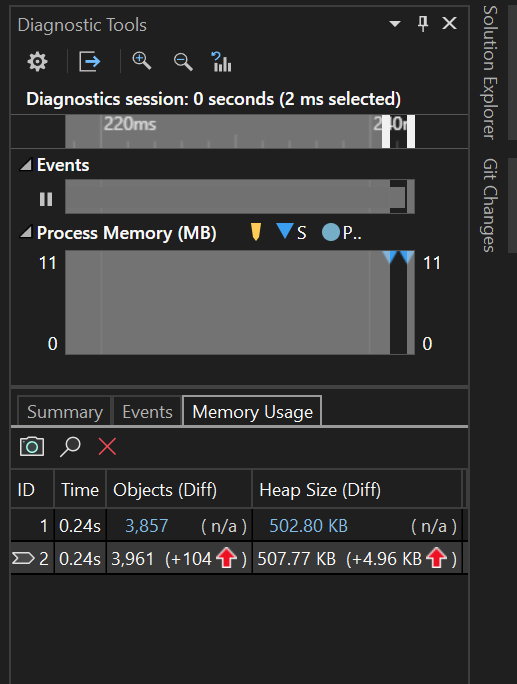 Fig. 2: Visual Studio Diagnostic Tools
Using the CPU Usage performance tool, you can see the CPU time and percentage spent executing code in a .NET application to identify high CPU usage and identify bottlenecks to target for optimization. With the Memory Usage diagnostic tool, you can also take snapshots of the managed and native memory heaps to find memory leaks and inefficiencies and understand how objects in the application are using memory. Both of these tools (and others) are available in the Diagnostic Tools window or during a debugging session in Visual Studio.
Garbage collection performance issues can also arise if the managed heap becomes too fragmented. This can lead to increased memory allocations and more frequent garbage collection cycles, resulting in performance degradation.
Triggering garbage collection with compaction using GC.Collect() will rearrange objects and merge free memory blocks. Continuously monitoring memory usage patterns and optimizing memory-intensive code sections can also help you identify and address memory leaks or inefficient memory usage patterns that are contributing to fragmentation.
This guide discussed the key features of garbage collection, including how it works and some of the associated performance issues. While garbage collection provides significant benefits, such as automatic memory management and simplified development, it is important to be aware of potential performance issues related to memory overhead, fragmentation, and induced latency.
Site24x7's all-in-one website monitoring solution provides a range of .NET application monitoring services that give your developers and engineers real-time visibility into the performance and availability of their web applications. Features such as real-time performance monitoring, transaction tracing, code-level insights, and proactive alerting help you identify and resolve performance issues before they affect end users. Find out more about how you can optimize your .NET application's performance.
Yes, Site24x7 APM Insight monitors .NET Garbage Collection metrics including CPU usage, memory heap sizes, and GC collection counts.
Site24x7 tracks memory utilization over time and provides detailed transaction traces to help pinpoint objects causing memory leaks.
Yes, you can configure custom alerts in Site24x7 to notify you when Garbage Collection consumes excessive CPU resources or when memory limits are reached.