Greetings!
We are happy to announce a new plugin integration to monitor custom Oracle database queries.
With the new Oracle custom query plugin, you can:
- Track business-critical KPIs from your Oracle database tables by monitoring SQL queries.
- Keep an eye on query execution times and view trends in the connectivity of your databases, which can impact the performance of your applications.
- Configure the plugin to view data outputs of critical events, and get notified when a specific query output experiences inconsistencies or unexpected hikes and breaches predefined threshold limits.
Use this plugin to track any query that is critical to your business. For example, you can monitor a query based on the number of user sessions, invalid login attempts, payment gateway response times, failed transactions, and so on.
Here are some examples of attributes that can be used to generate events and threshold-based alerts with the Oracle custom query monitoring plugin:
- Number of records: You can monitor a query that returns the number of records (or rows) in a table. For example, if an unusually high number of rows get inserted into a critical table, fetching data from the table will lead to overutilization of resources. With the plugin, you can get notified when there is an unexpected increase in the number of rows.
- Query status: View the status of a query and get notified when a query is unsuccessful, indicating that there might be an issue with the underlying database or application.
- Response time: A high response time can indicate delays in your Oracle database, leading to application performance issues. Getting notified when a specified response time is breached can help you take preventative measures and ensure an optimal user experience.
- Value: Monitor the value of a specific cell in the table related to any KPI, such as the number of new tickets, average response time, or customer rating, and get alerted when they breach predefined limits.
The screenshots below show an example of a custom query and how it can be configured to view its output in Site24x7:
 A custom query and its output that shows the values of overall, successful, and failed transactions from an Oracle DB table
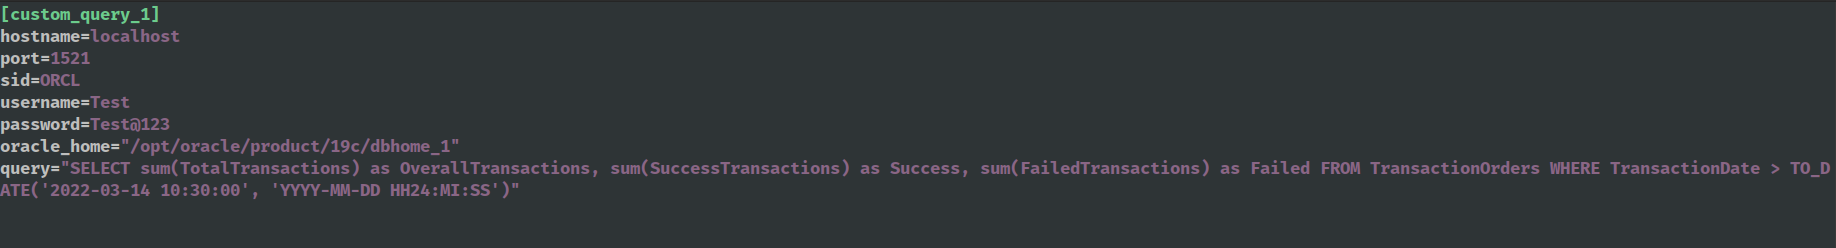 The custom query added to the oracle_custom_query.cfg file
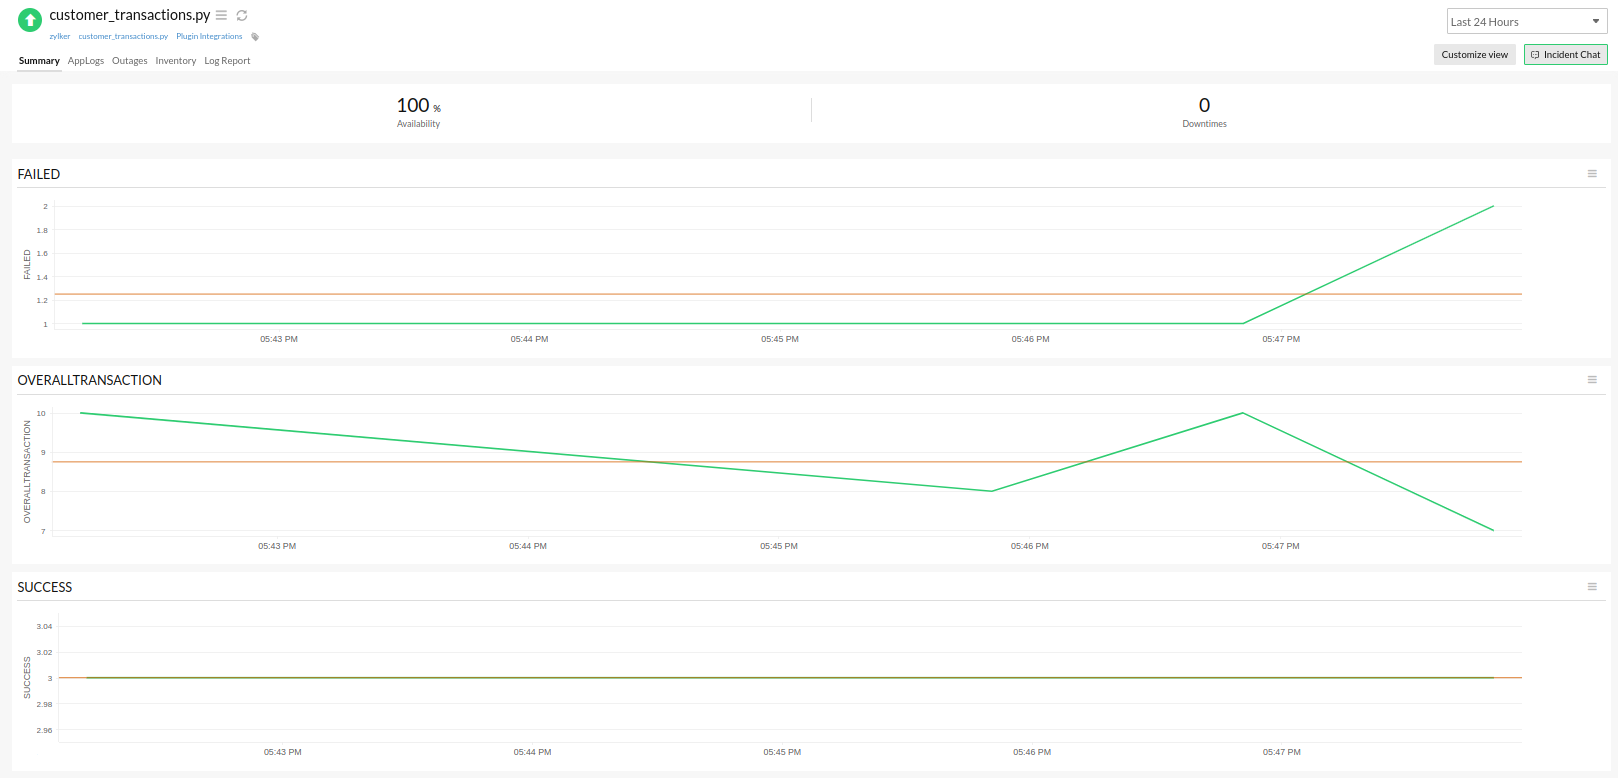 A graphical representation of output of the custom query in the Site24x7 web client
Install the Oracle custom query plugin integration and monitor any query in your Oracle database.
You can also use our existing plugin integrations to track the performance of your entire Oracle database.
We encourage you to check out our growing list of more than 100 plugin integrations to monitor your entire application stack.
You can also build your own plugin to monitor any custom application, system, or service in your server.
Watch the video below to learn how to add a custom plugin for Linux servers.
Watch the video below to learn how to add a custom plugin for Linux servers.
Until next time,
Happy monitoring.
Like (1)
Reply
Replies (0)