Hello,
we often have metrics i.e. Azure Loadbalancer where all metrics aggregation as average is displayed.
It would be helpfull if in performance reports or all performance graph widgets in the gui has an aggregation option.
This aggregation option should offer sum, avg, min, max and count.
Thanks,
Torsten
Like (2)
Reply
Replies (2)
Hi,
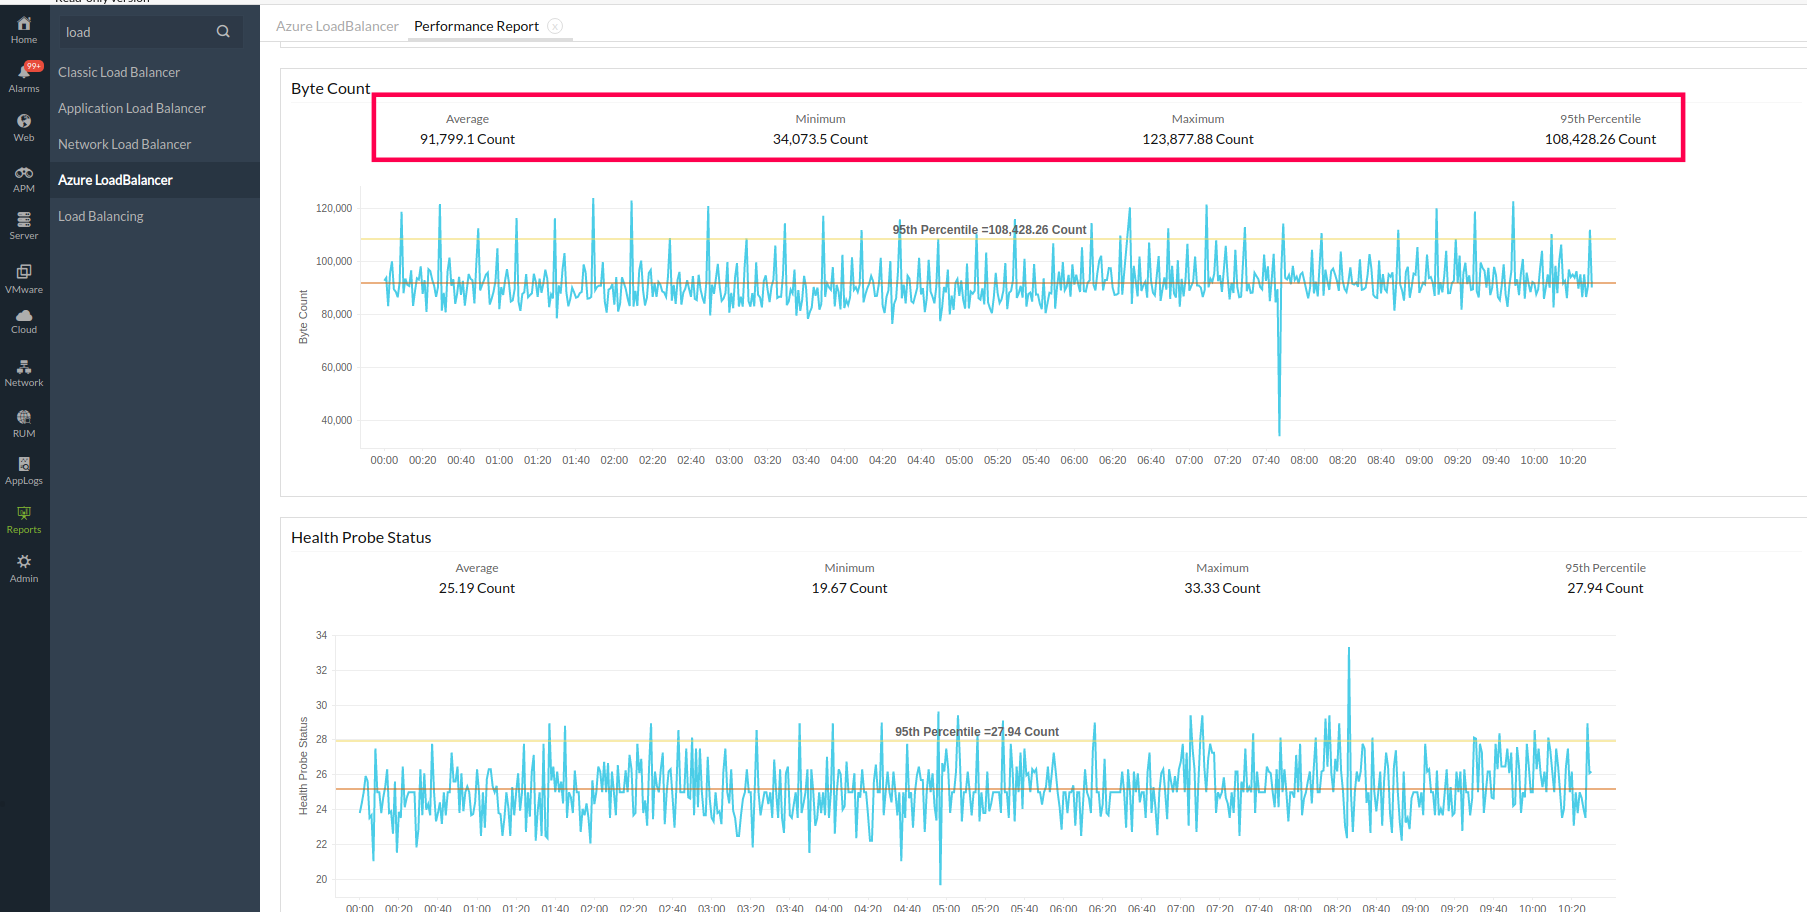
You will be able to view the requested aggregations (Min, Max & Average) in the following report,
In Site24x7 webclient, go to Reports Tab -> Search the required monitor type (Azure Load Balancer in this case) -> Click on Performance Reports.
You can choose the necessary attribute and time period for which the report is needed.
In Site24x7 webclient, go to Reports Tab -> Search the required monitor type (Azure Load Balancer in this case) -> Click on Performance Reports.
You can choose the necessary attribute and time period for which the report is needed.
Like (0)
Reply
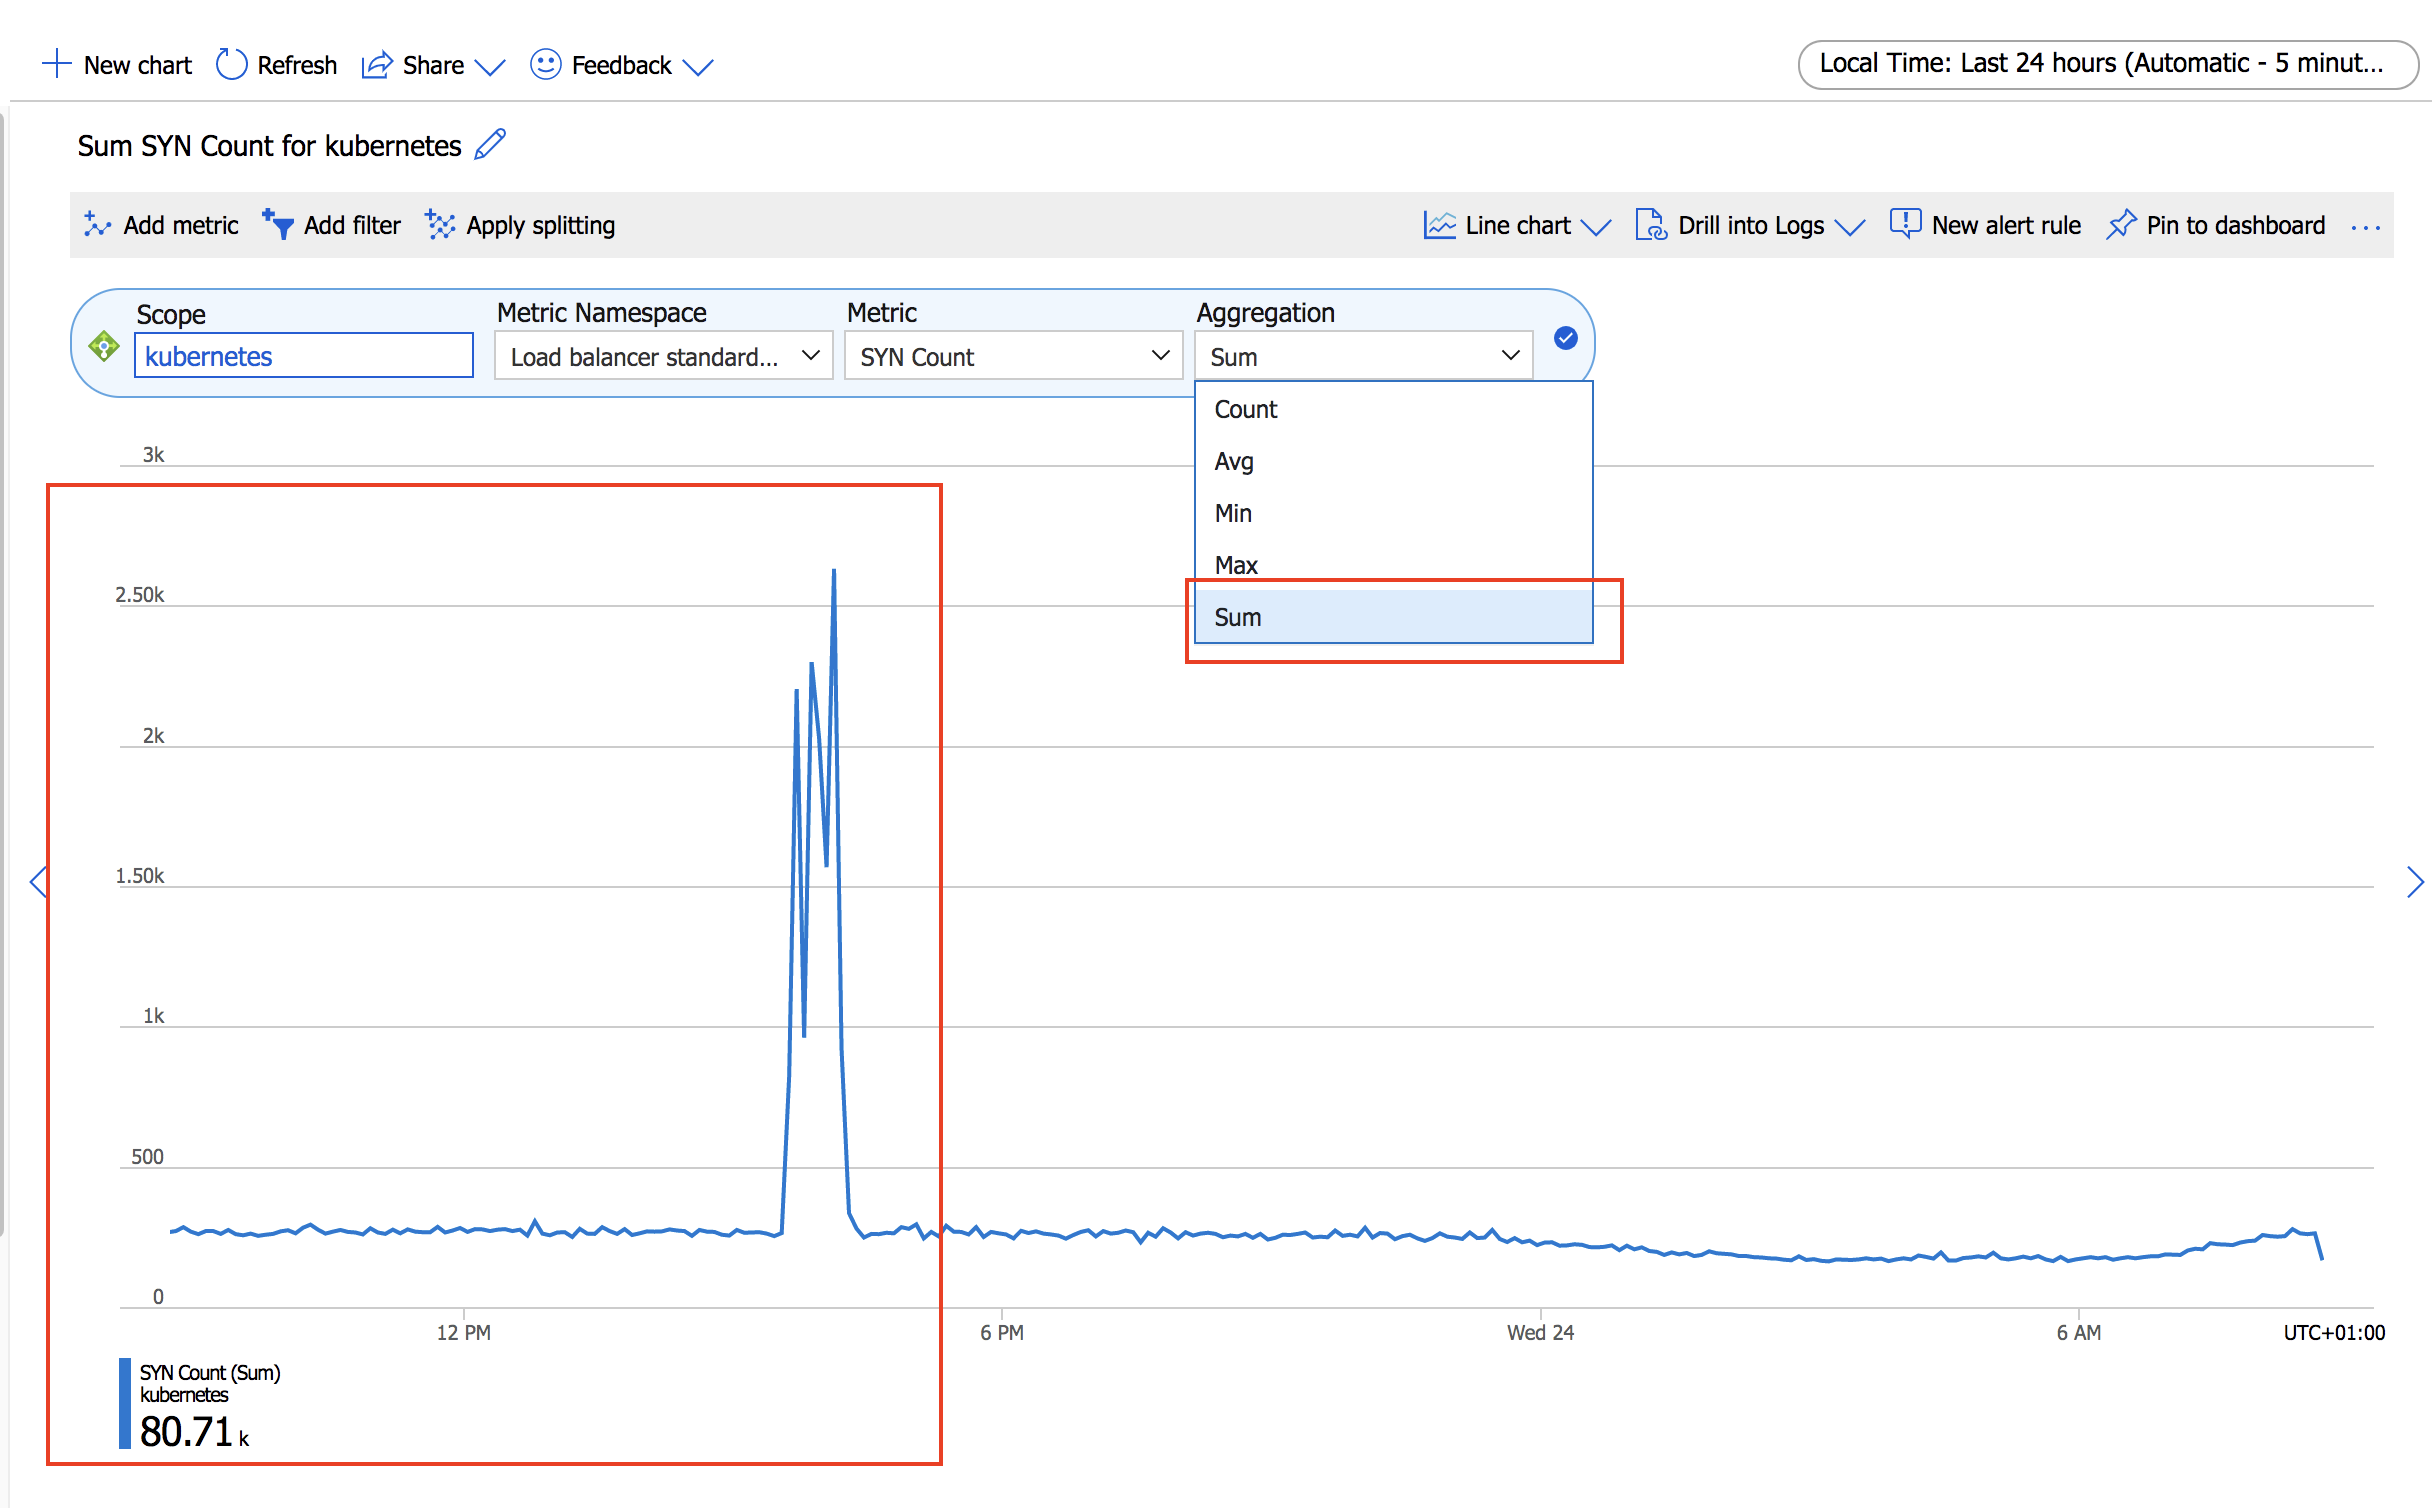
Thanks. I would ask if it is possible to see also the aggregation type "sum".
And if it is possible to change the aggregation also directly in the dashboard widgets.
Here is an example of the Azure Portal metrics:
Like (0)
Reply