by Jyotsna R
Hi there,
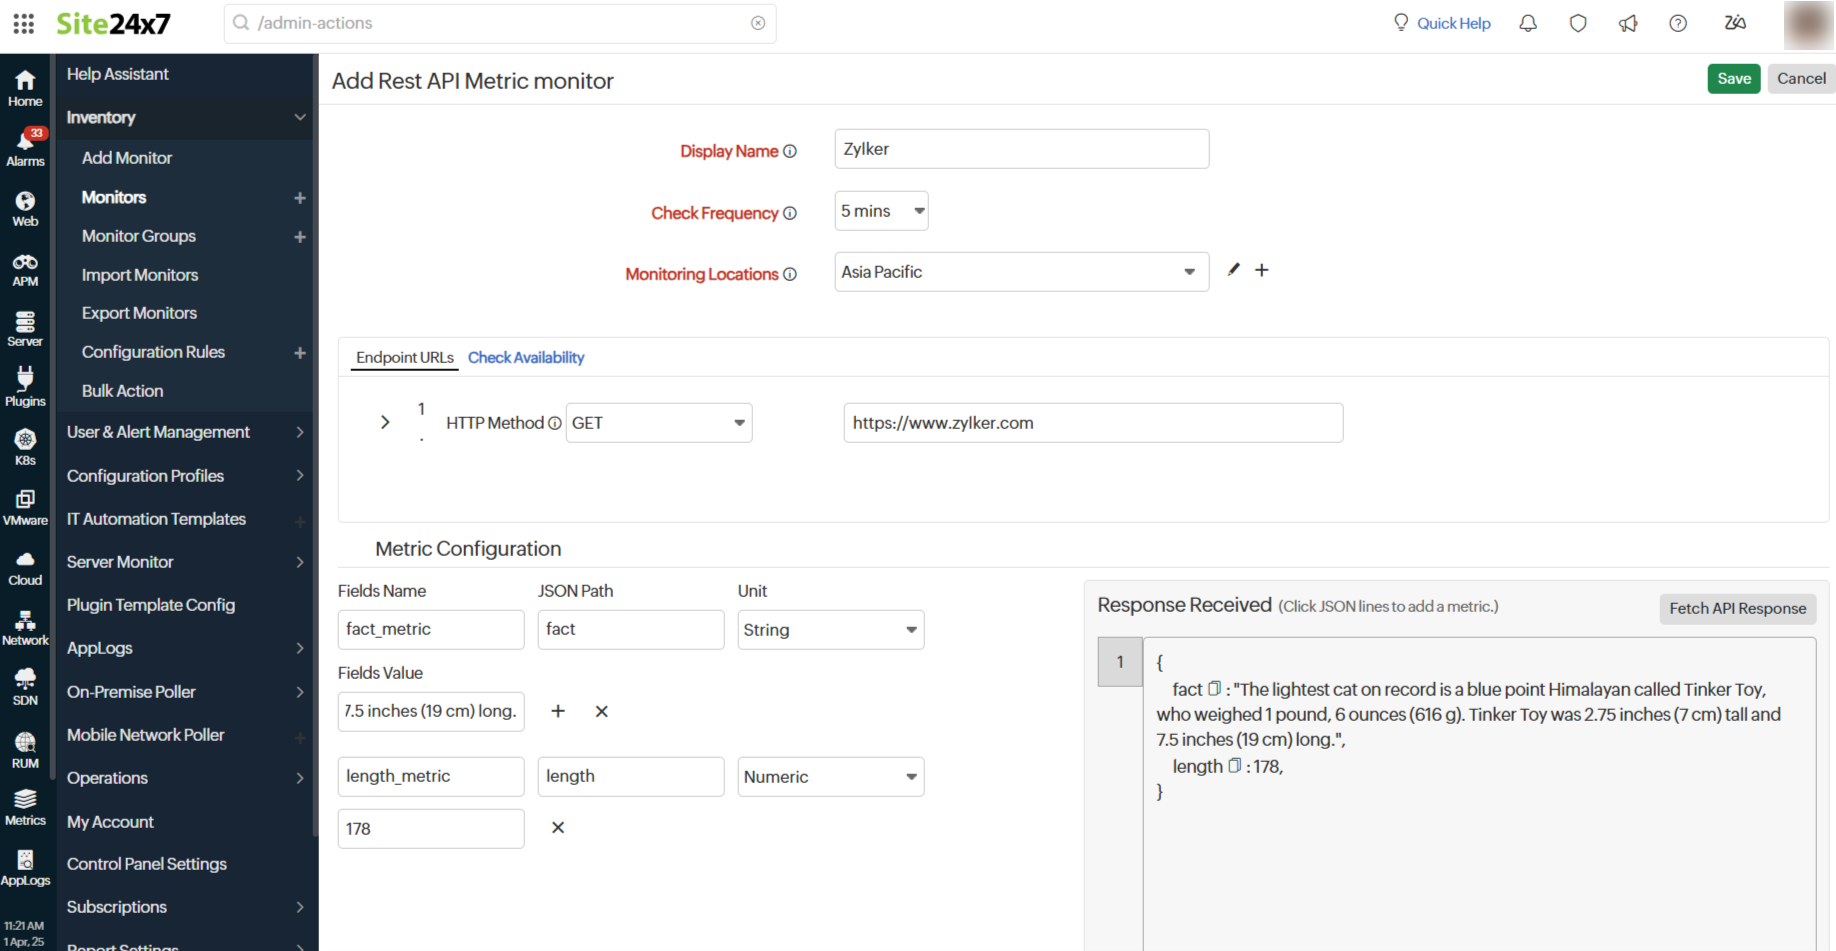
We are pleased to announce that we've released the REST API Metric monitor, one of the data sources for the Data Lake monitor. It is designed to help you analyze trends in API fields, provide a thorough analysis of key metrics, track availability, and deliver detailed insights for optimized performance. You can filter the metrics based on specific conditions, receive instant alerts, and visualize the data effectively.
Why do you need it?
This monitor enables proactive monitoring of REST API data fields to identify trends and anomalies, ensuring timely insights and actions.
How does it work?
- Define the REST API endpoint URL, select data fields to monitor, and save the REST API monitor.
- Create a Custom Attribute monitor, link it to the data source (REST API monitor), and set a threshold profile.
- Receive alerts for threshold breaches and visualize data as charts or graphs.
- Analyze trends and anomalies for actionable insights.
Key benefits:
- Dashboard visualization: The monitor presents metric data on dashboards, allowing you to analyze and explore the data using various visualization tools, such as graphs and charts.
- Custom alerts: This monitor allows you to set custom alerts for your metrics based on your specific requirements.
- Real-time updates: Visualizations are updated in real time, providing an up-to-the-minute view of the metric's status. You can compare the data based on particular intervals.
- Detailed filtering: Delve into specific data in more detail by applying filters.
The REST API Metric monitor provides deep insights into your API metrics, helping you analyze trends and detect anomalies across various metrics available in REST APIs.
For step-by-step guidance, refer to our comprehensive help documentation.
We value your feedback, so please share your thoughts and suggestions in the comments below.
Happy monitoring!
Like (0)
Reply
Replies (0)