Greetings,
We're happy to introduce the Latency Dashboard in Site24x7, which helps you understand the availability, latency, and connectivity patterns between the geographically distributed On-Premise Pollers in your account.
What is a Latency Dashboard?
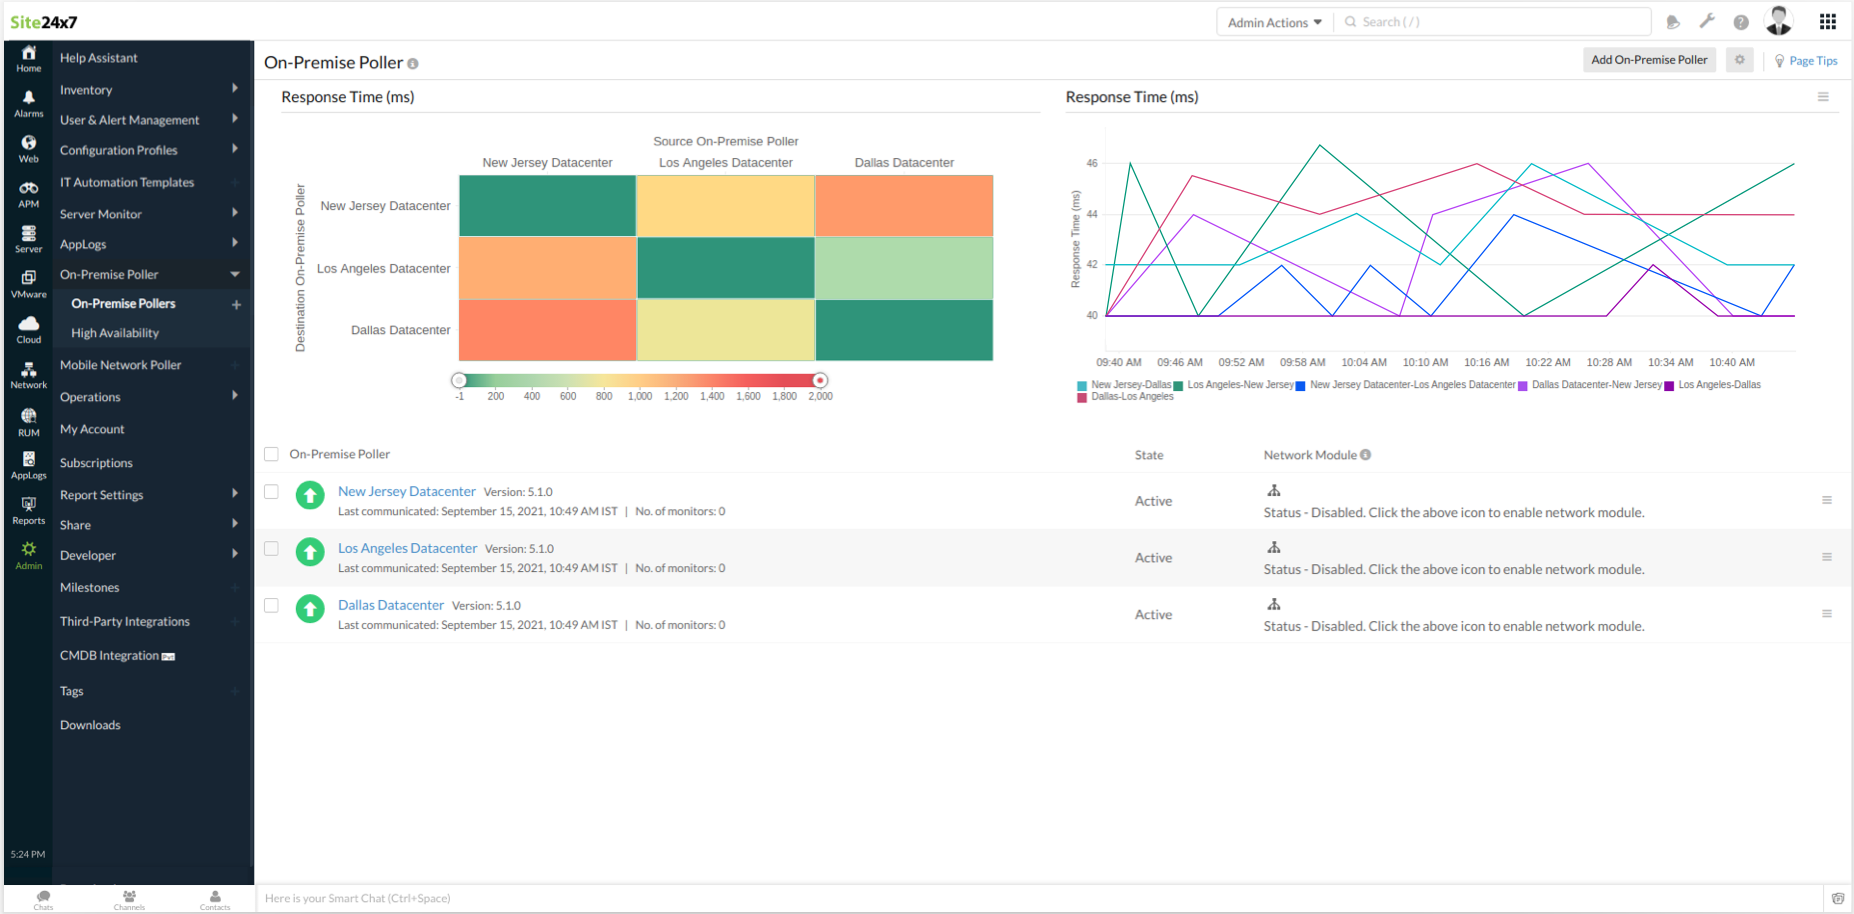
The Latency Dashboard collects and displays information about the latency metrics between the multiple On-Premise Pollers in your account. Each On-Premise Poller polls every five minutes and calculates the response time between the other On-Premise Pollers.
Notable features of the dashboard:
- The dashboard is color-coded to indicate the availability and latency between the On-Premise Pollers in your account.
- The dashboard scales according to the number of On-Premise Pollers.
How is the Latency Dashboard beneficial?
When On-Premise Pollers are used as custom monitoring locations, you can easily view and track the latency between multiple locations, obtaining insights into the latency between data centers.
Licensing
Currently, we do not charge extra for the Latency Dashboard.
Get started
You need to upgrade your On-Premise Pollers to version 5.1.1 or above and have at least two On-Premise Pollers in your Site24x7 account to view this dashboard. Refer to our help documentation to start using the Latency Dashboard now.
For any feedback or clarification, feel free to comment below or get in touch with us at support@site24x7.com.
Until next time,
Happy monitoring!