We are happy to introduce alerting and reporting capabilities to Site24x7's RUM.
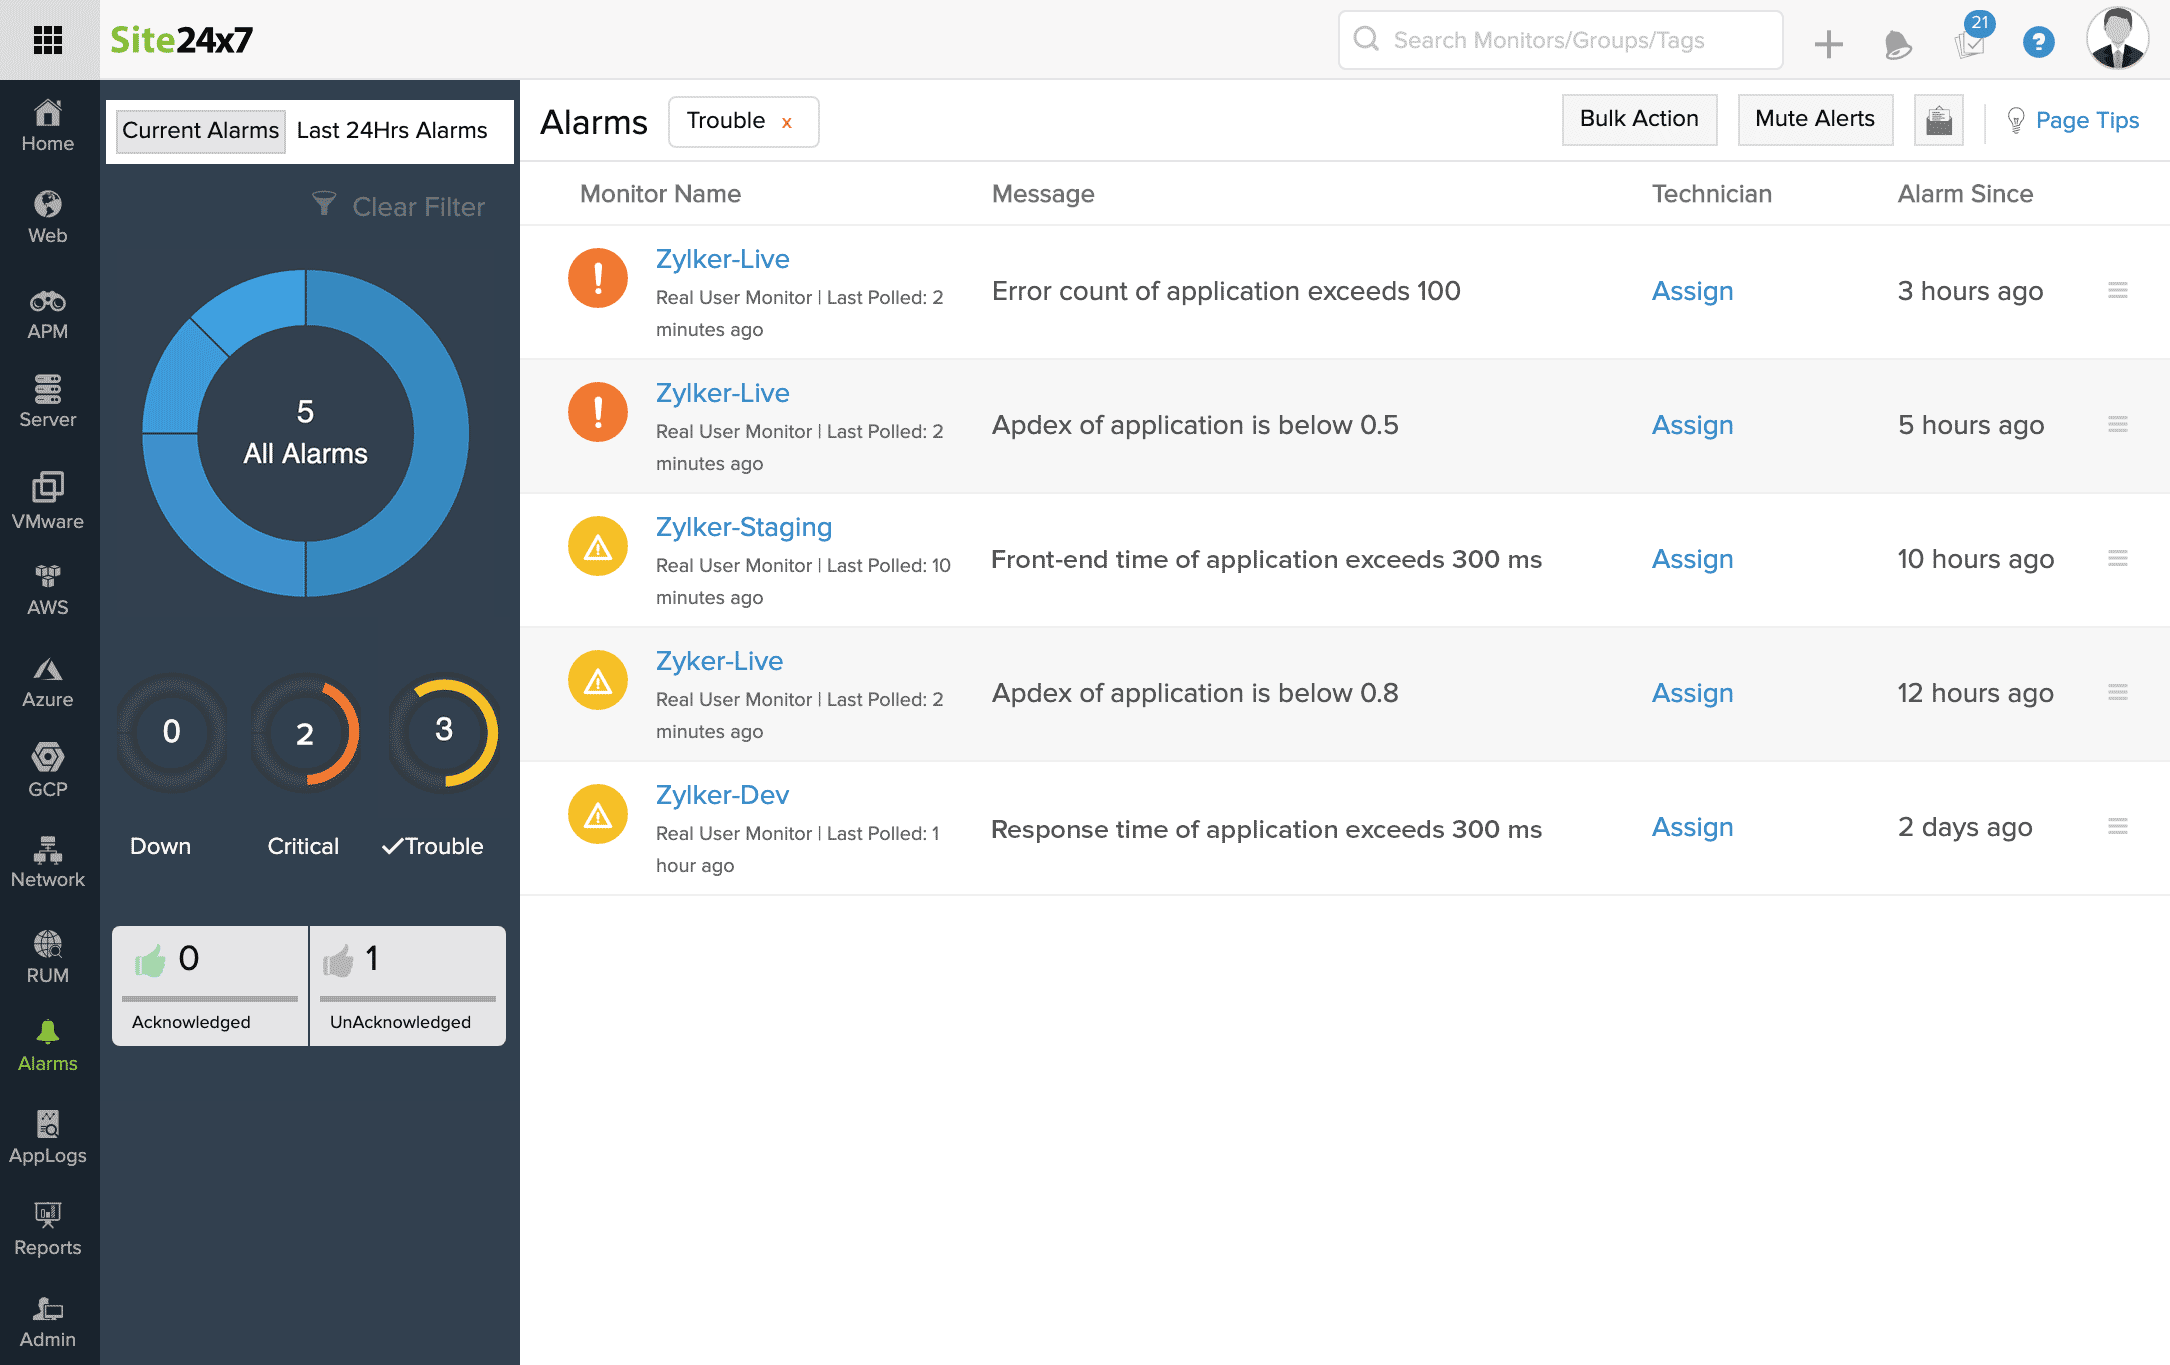
You can configure alerts for critical parameters like application response time, network time, and JavaScript errors. You can also classify your alerts as Trouble and Critical based on the severity levels.
So, how does this help?
When there is a sudden spike in your application response time, it affects the end-user experience, which directly affects your business.
This lag may be triggered by an unresponsive JS code, exceptions in your AJAX calls, or even a slow network.
In such cases, if you configure an alert for error or exception count, or for application response time, it helps you analyze and correlate the data, which helps you find the issue in real-time.
Reports:
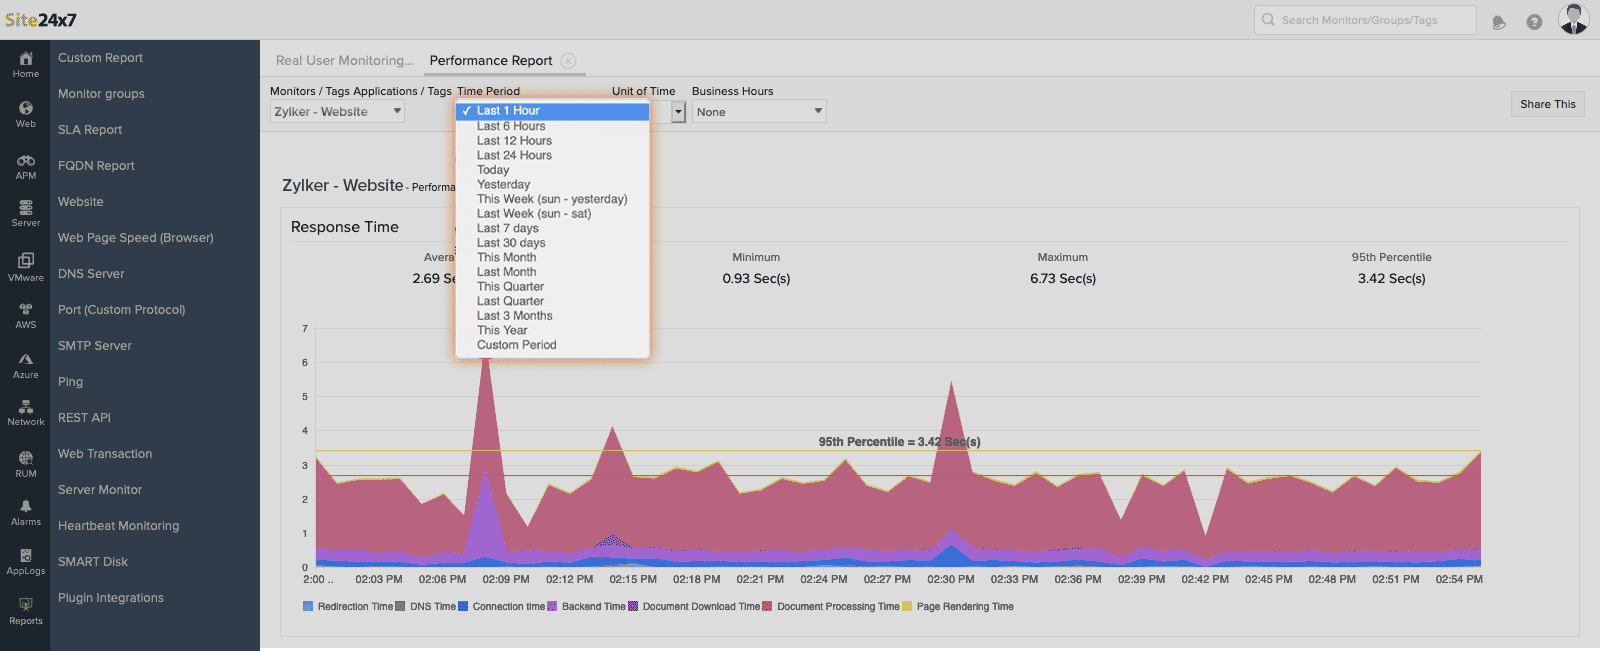
You can receive Performance and Busy Hours reports for your RUM applications, ranging from the last hour to the last year. With the Busy Hours report, you can track down which hour or day of the week your application was running slowly.
Custom Dashboards:
You can also drag and drop all these reports in the Site24x7 Custom Dashboard to receive a bird's-eye view of your console.
If you have any questions or concerns, drop us a comment below or email us at support@site24x7.com.