Hi,
I would like to create a Dashboard with Server OS metrics, APM Metrics and custom App Parameters and Views.
Currently it is not possible to select app parameters (i.e blocked threads, http connector) or views.
This could help us to create dashboards which give us a summary view of all application infrastructure components and custom metrics.
Thanks and regards,
Torsten
One more thing: We would like to use metrics from custom agents/scripts in custom dashboards too.
Thanks,
Torsten
Dear Torsten,
We will add adding app parameters widgets to custom dashboard to our roadmap. I understand the ease of use here.
Regarding, custom agents/scripts do you mean to display data from other sources apart from apm-insight, server or on-prem poller agents?
-Jasper
PM, Site24x7
Hi Jasper,
yes, i mean data from other sources. In our case custom scripts (plugins) in server monitor agents.
Thanks,
Torsten
Dear Torsten,
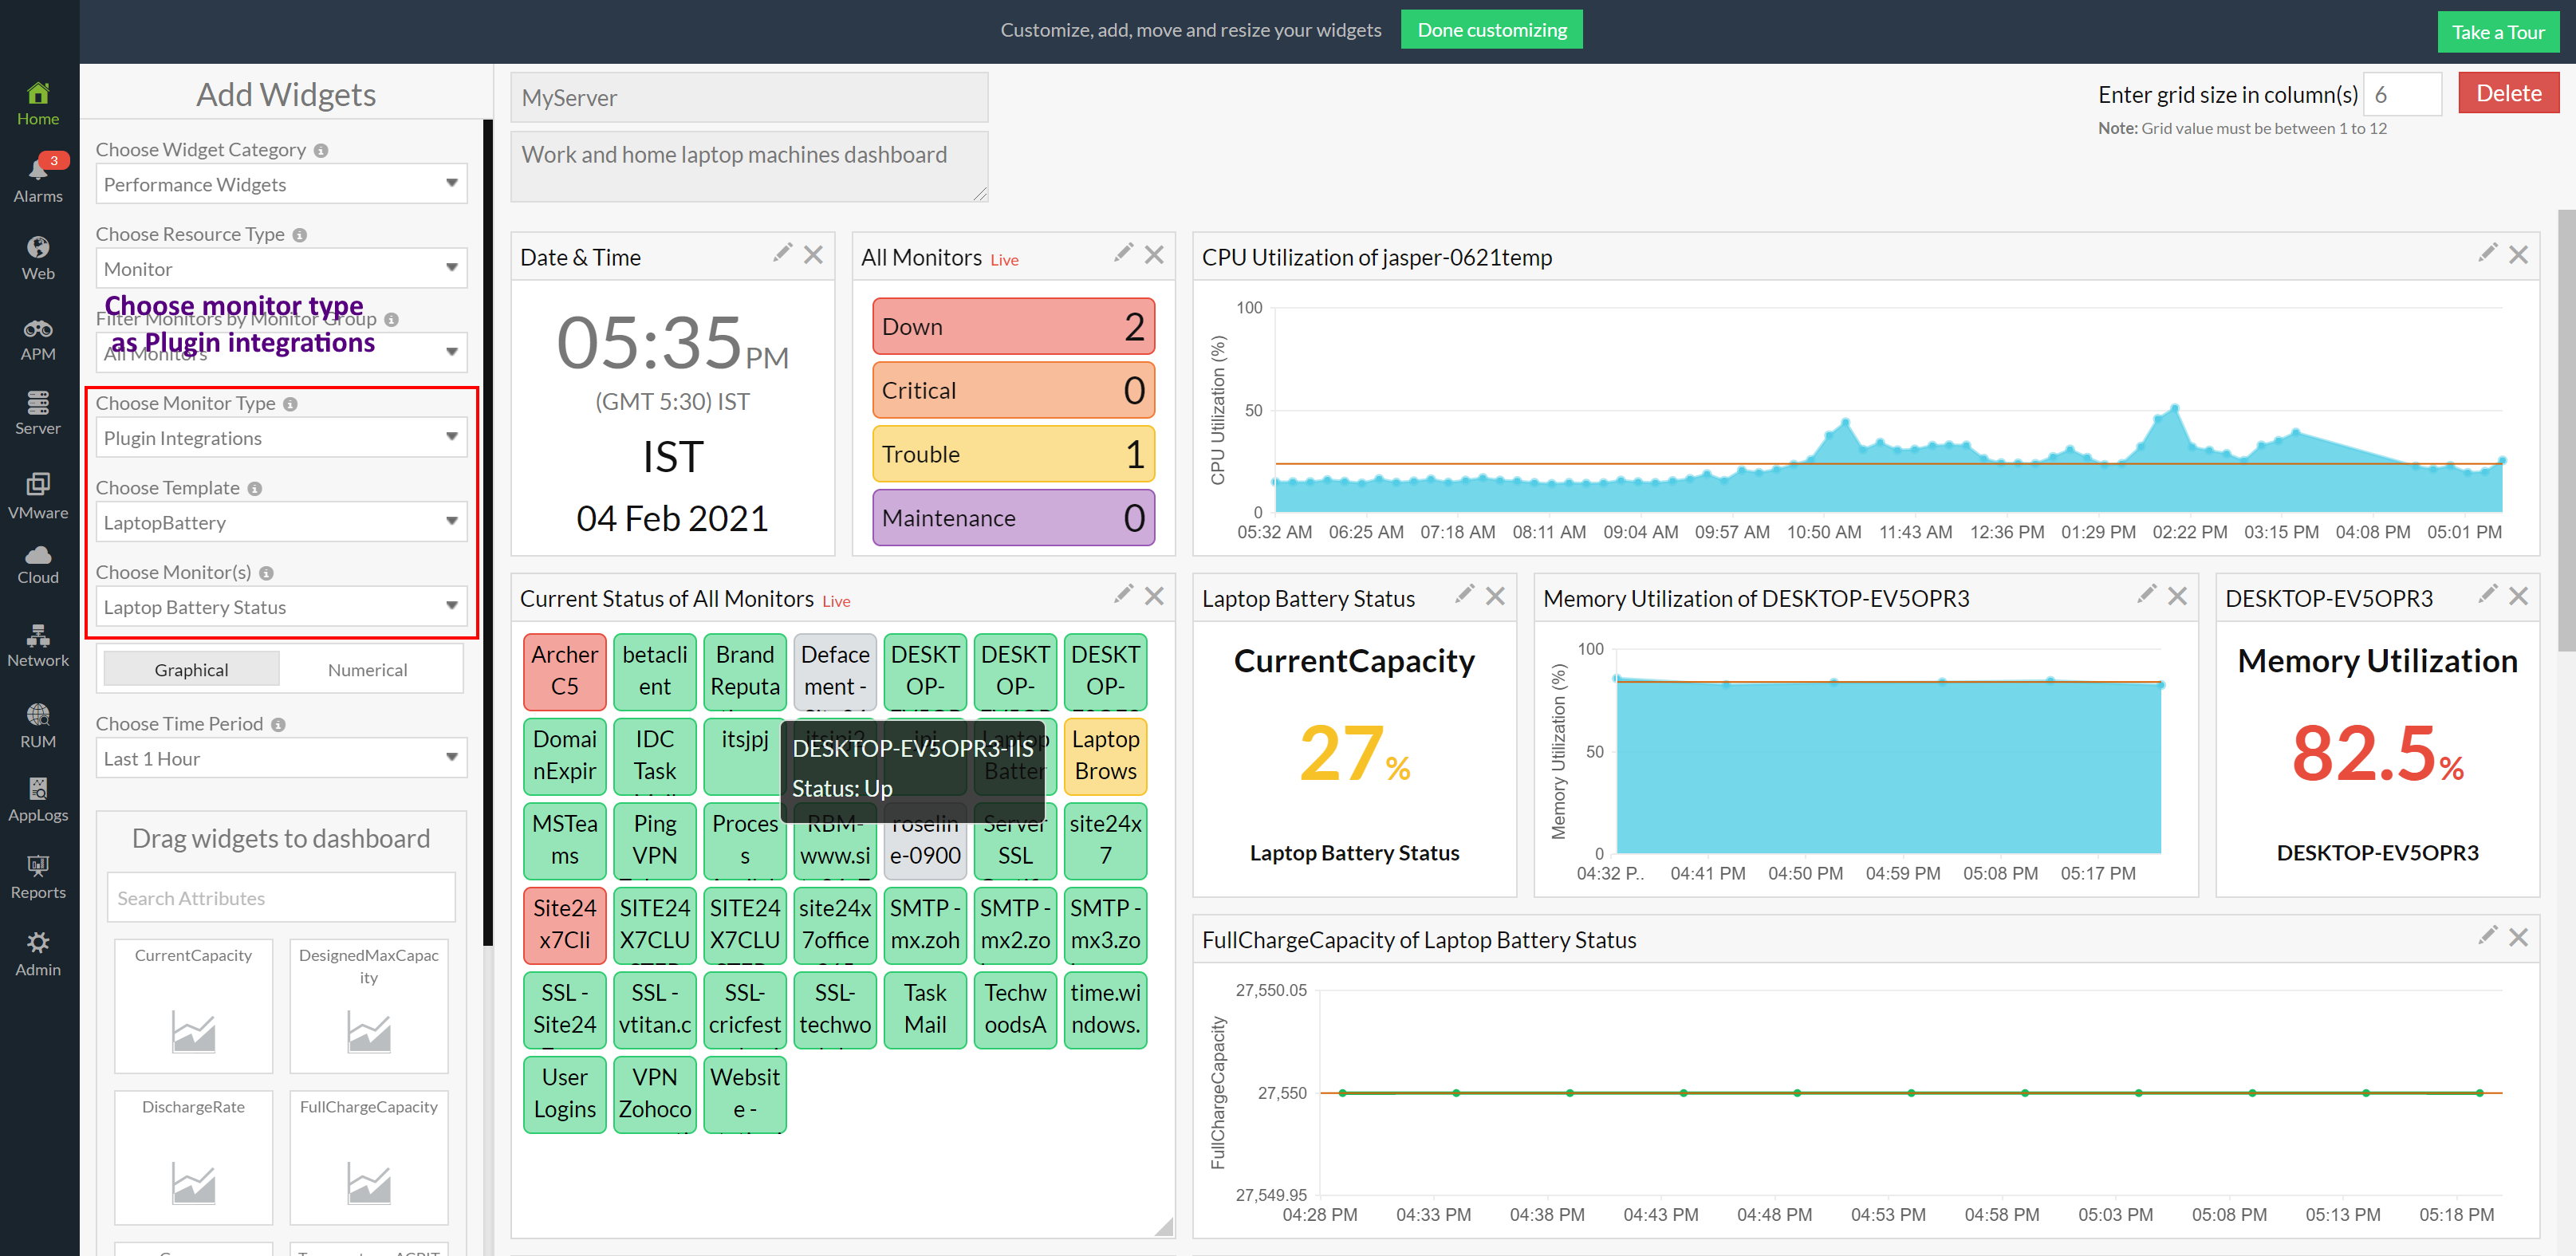
We can include plugin widget into our dashboard even now. Select the Home > Dashboards > Select the dashboard or create a new one > under performance widgets > Choose the monitor type as Plugin Integrations > You can now select the plugin template > choose the plugin you want. The list of attributes will be listed from which you can drag and drop the widget to your desired position in the dashboard.
Let us know if this helps.
-Jasper
PM, Site24x7