Top 3 reasons why you need to use Site24x7's thread dump analyzer tool

Imagine having x-ray vision for your application and seeing exactly what's happening under the hood in real time. That's what thread dumps do for your application—they are a vital component of application performance monitoring (APM) and give you a super-powered peek into its inner workings, helping you spot issues and fix them faster than you can imagine.
Simply put, a thread dump is a snapshot of all the threads running within a software application at a specific moment in time. Applications rely on individual threads to execute specific tasks, and when performance fumbles, thread dumps become a developer's secret weapon, offering a treasure trove of data on thread status, execution flow (stack traces), and resource usage. This data enables developers to pinpoint performance bottlenecks, diagnose issues, and optimize their application's performance. In spite of being such an important feature for helping with performance optimization, threads dumps are often still monitored manually, using up more time and resources than required.
Site24x7's thread dump analyzer automates this process and helps you analyze thread dumps in a fraction of the time. In this blog, we'll delve deeper into the significance of thread dumps in APM, the features of Site24x7's thread dump analyzer tool, and how thread dumps contribute to the monitoring and management of software applications.
Why are thread dumps so significant?
Thread dumps are critical diagnostic tools for understanding multi-threaded applications because they provide deep insights into the behavior of an application's threads at a specific point in time and reveal potential bottlenecks or performance issues within the application. Developers rely on thread dump analysis for its ability to provide a comprehensive overview of thread utilization, enabling precise targeting of optimization efforts and the fine-tuning of resource allocation to achieve optimal performance.
Thread dumps act as adept conductors, and analyzing them regularly ensures efficient resource allocation and optimal usage for applications while providing suggestions for areas of improvement. Despite significant advancements in technology, manually analyzing thread dumps remains a laborious and time-consuming task. This process typically involves the DevOps team manually sending over thread dumps, followed by individual analysis efforts. Site24x7 APM Insight has revolutionized this approach by introducing an automated thread dump analyzer tool. This innovative feature proactively examines your thread dumps at regular intervals, generates comprehensive reports, and alleviates the burden of manual analysis, thereby simplifying your workflow and enhancing efficiency.
What can you do with a thread dump analyzer?
The main purpose of a thread dump analyzer tool is to visualize the analysis of thread dumps. This cuts down the time taken to complete analysis while still providing detailed and valuable information that helps your developers and operators make informed decisions while optimizing your application. Site24x7's thread dump analysis tool helps you achieve all of this and more. Let's take a look at what you can do with our thread dump analyzer tool.
1. Identify blocked threads
Blocked threads occur when a thread is waiting for a resource to become available or for a particular condition to be satisfied before it can proceed with its execution. A blocked thread can either exist in a completely blocked state or in a waiting state. If not identified on time, blocked threads can cause performance degradation or even application hangs.
Site24x7's thread dump analyzer tool has a Transitive Graph feature that shows a visual representation of the relationship between various threads in a thread dump. Using this feature, developers and DevOps engineers can easily identify blocked threads by pinpointing exactly which thread is facing an issue and waiting for another thread to complete its task.
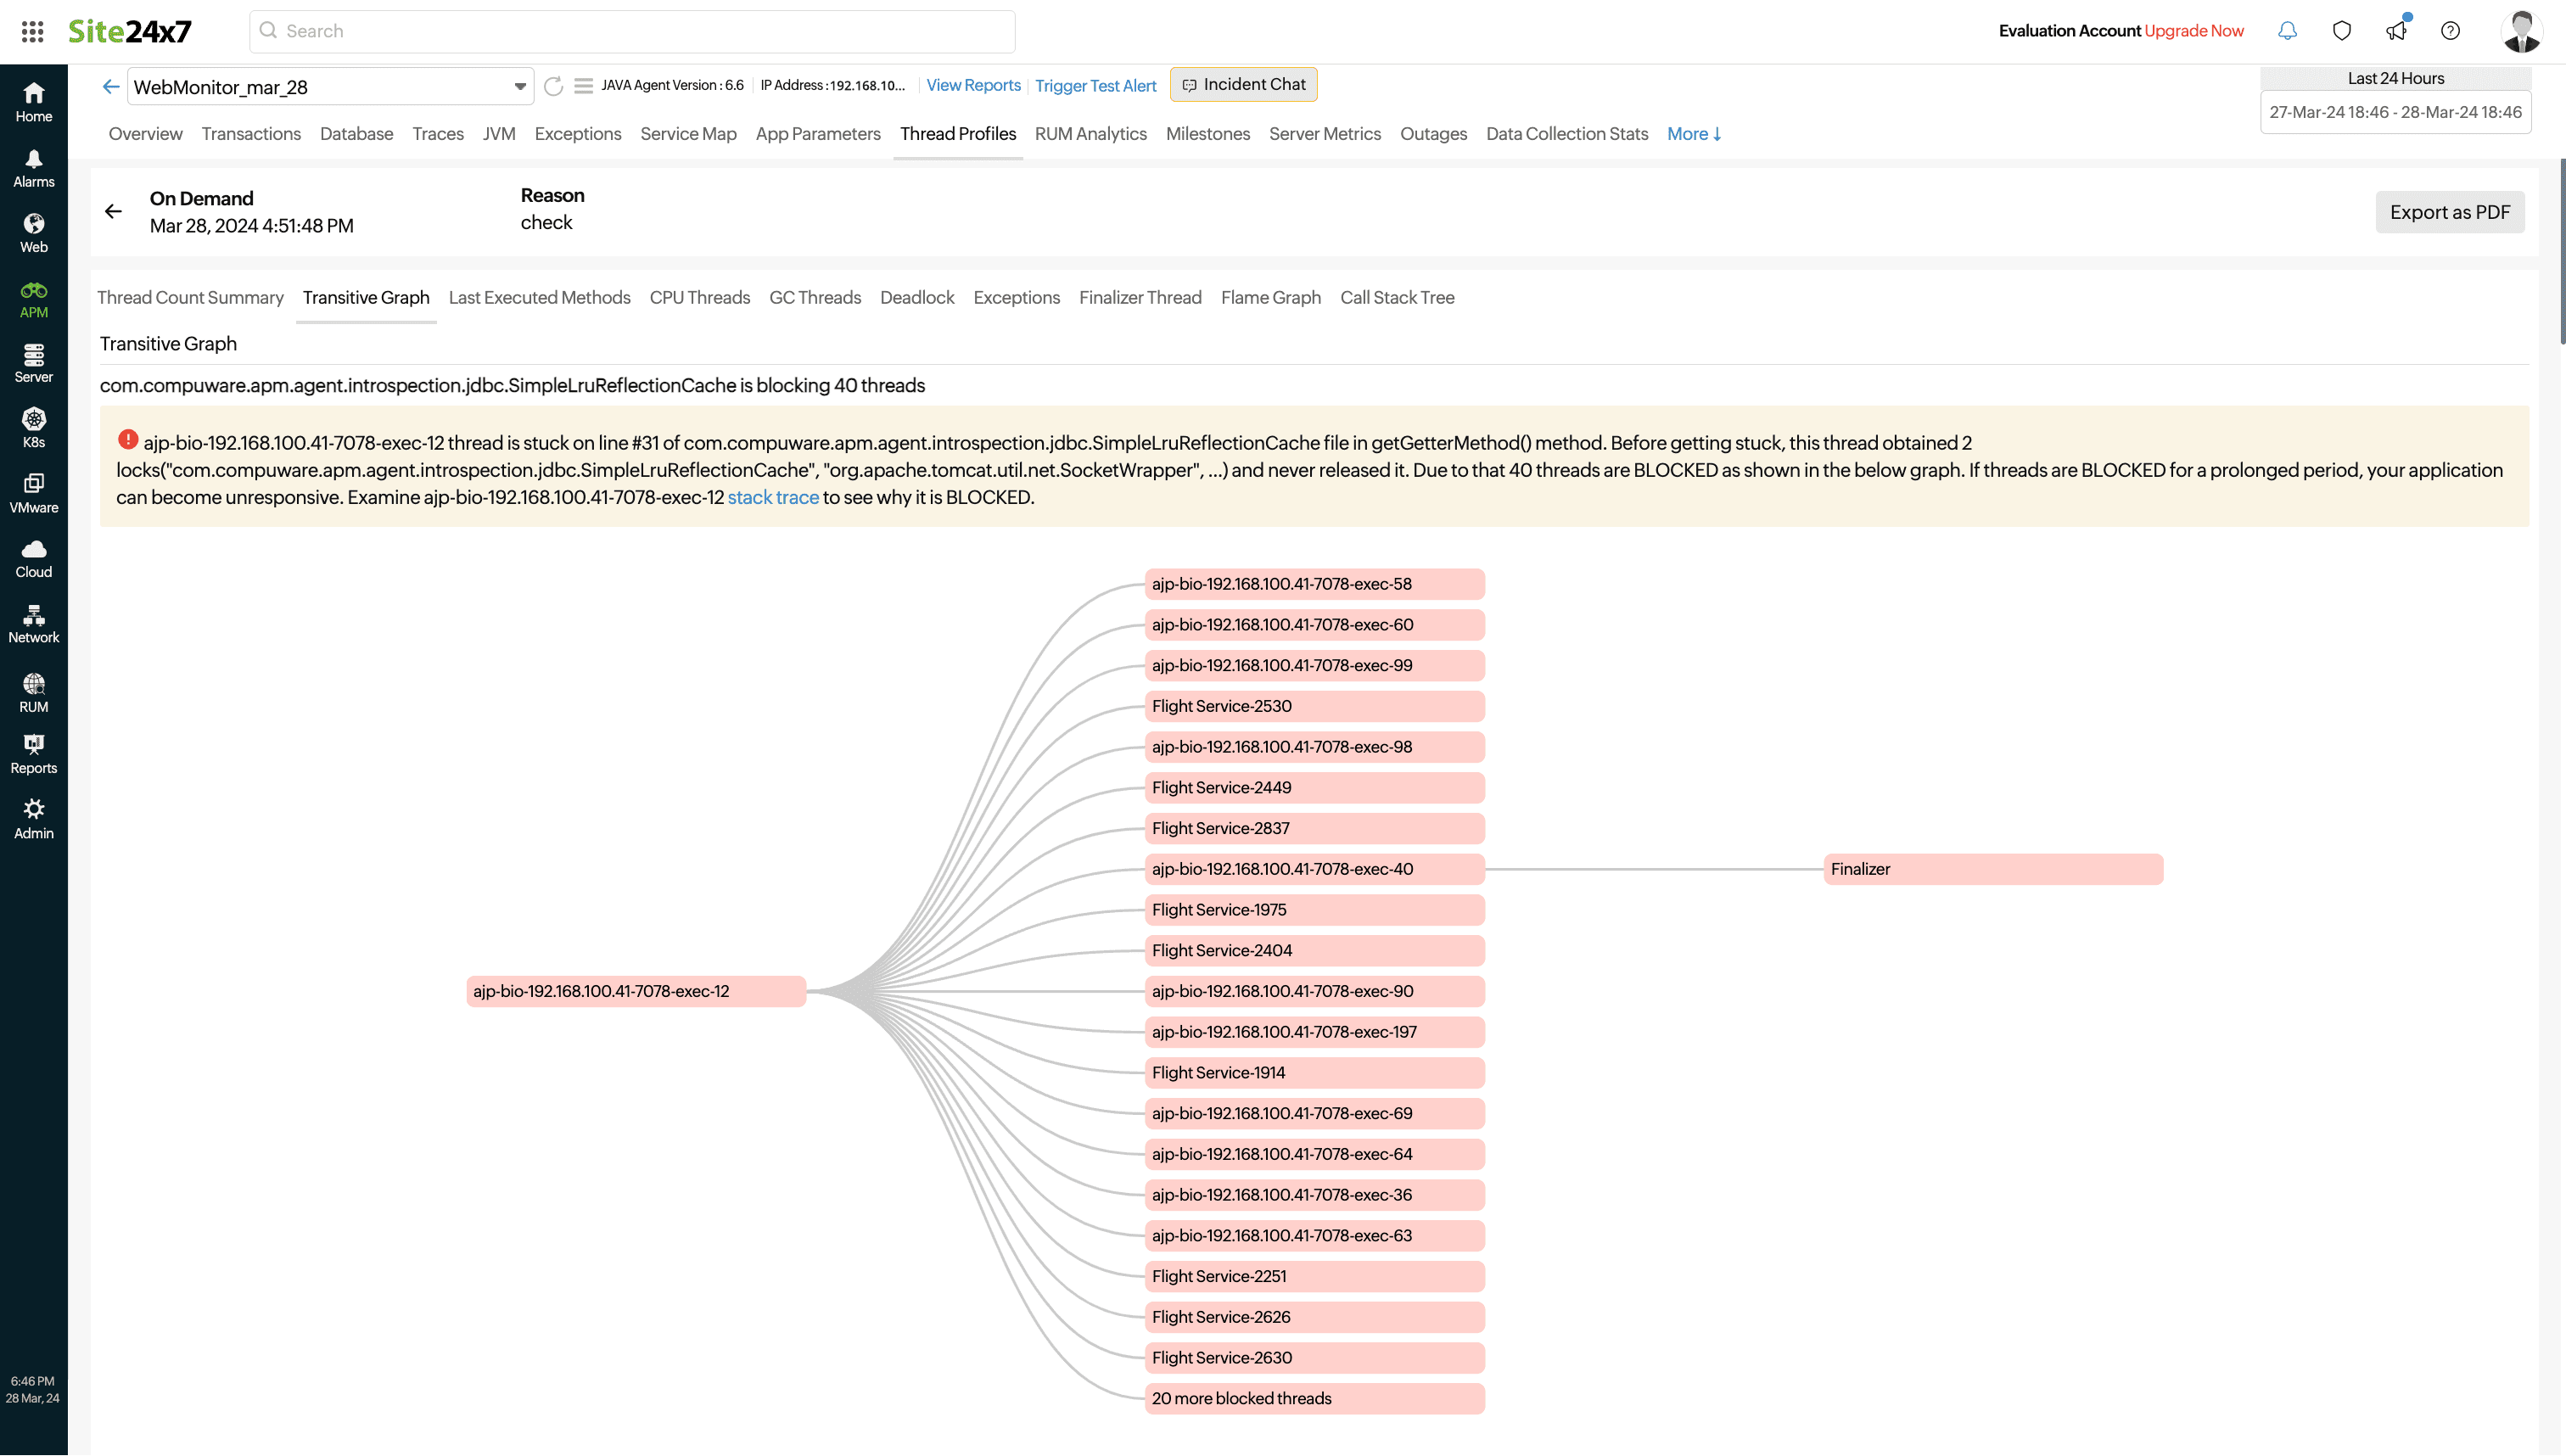
Fig 1. Transitive Graph
2. Detect deadlocks and lock contentions
Deadlocks occur when two or more threads are waiting for each other to release resources, resulting in a complete standstill. If undetected, deadlocks can lead to unresponsiveness, resource starvation, and even system failure, given their unpredictable and erratic nature.
Lock contentions, on the other hand, occur when threads are delayed because they are trying to access the same resource simultaneously, which may ultimately lead to performance issues.
Thread dumps are invaluable in identifying deadlocks and lock contentions, and APM tools aid in the process by analyzing thread dumps and narrowing down the root cause of the issue. Site24x7's Deadlock tab helps you identify the exact thread causing the deadlock, the resources it's waiting for, and the state of each thread. You can use this information to choose the right strategy to avoid the deadlock altogether.
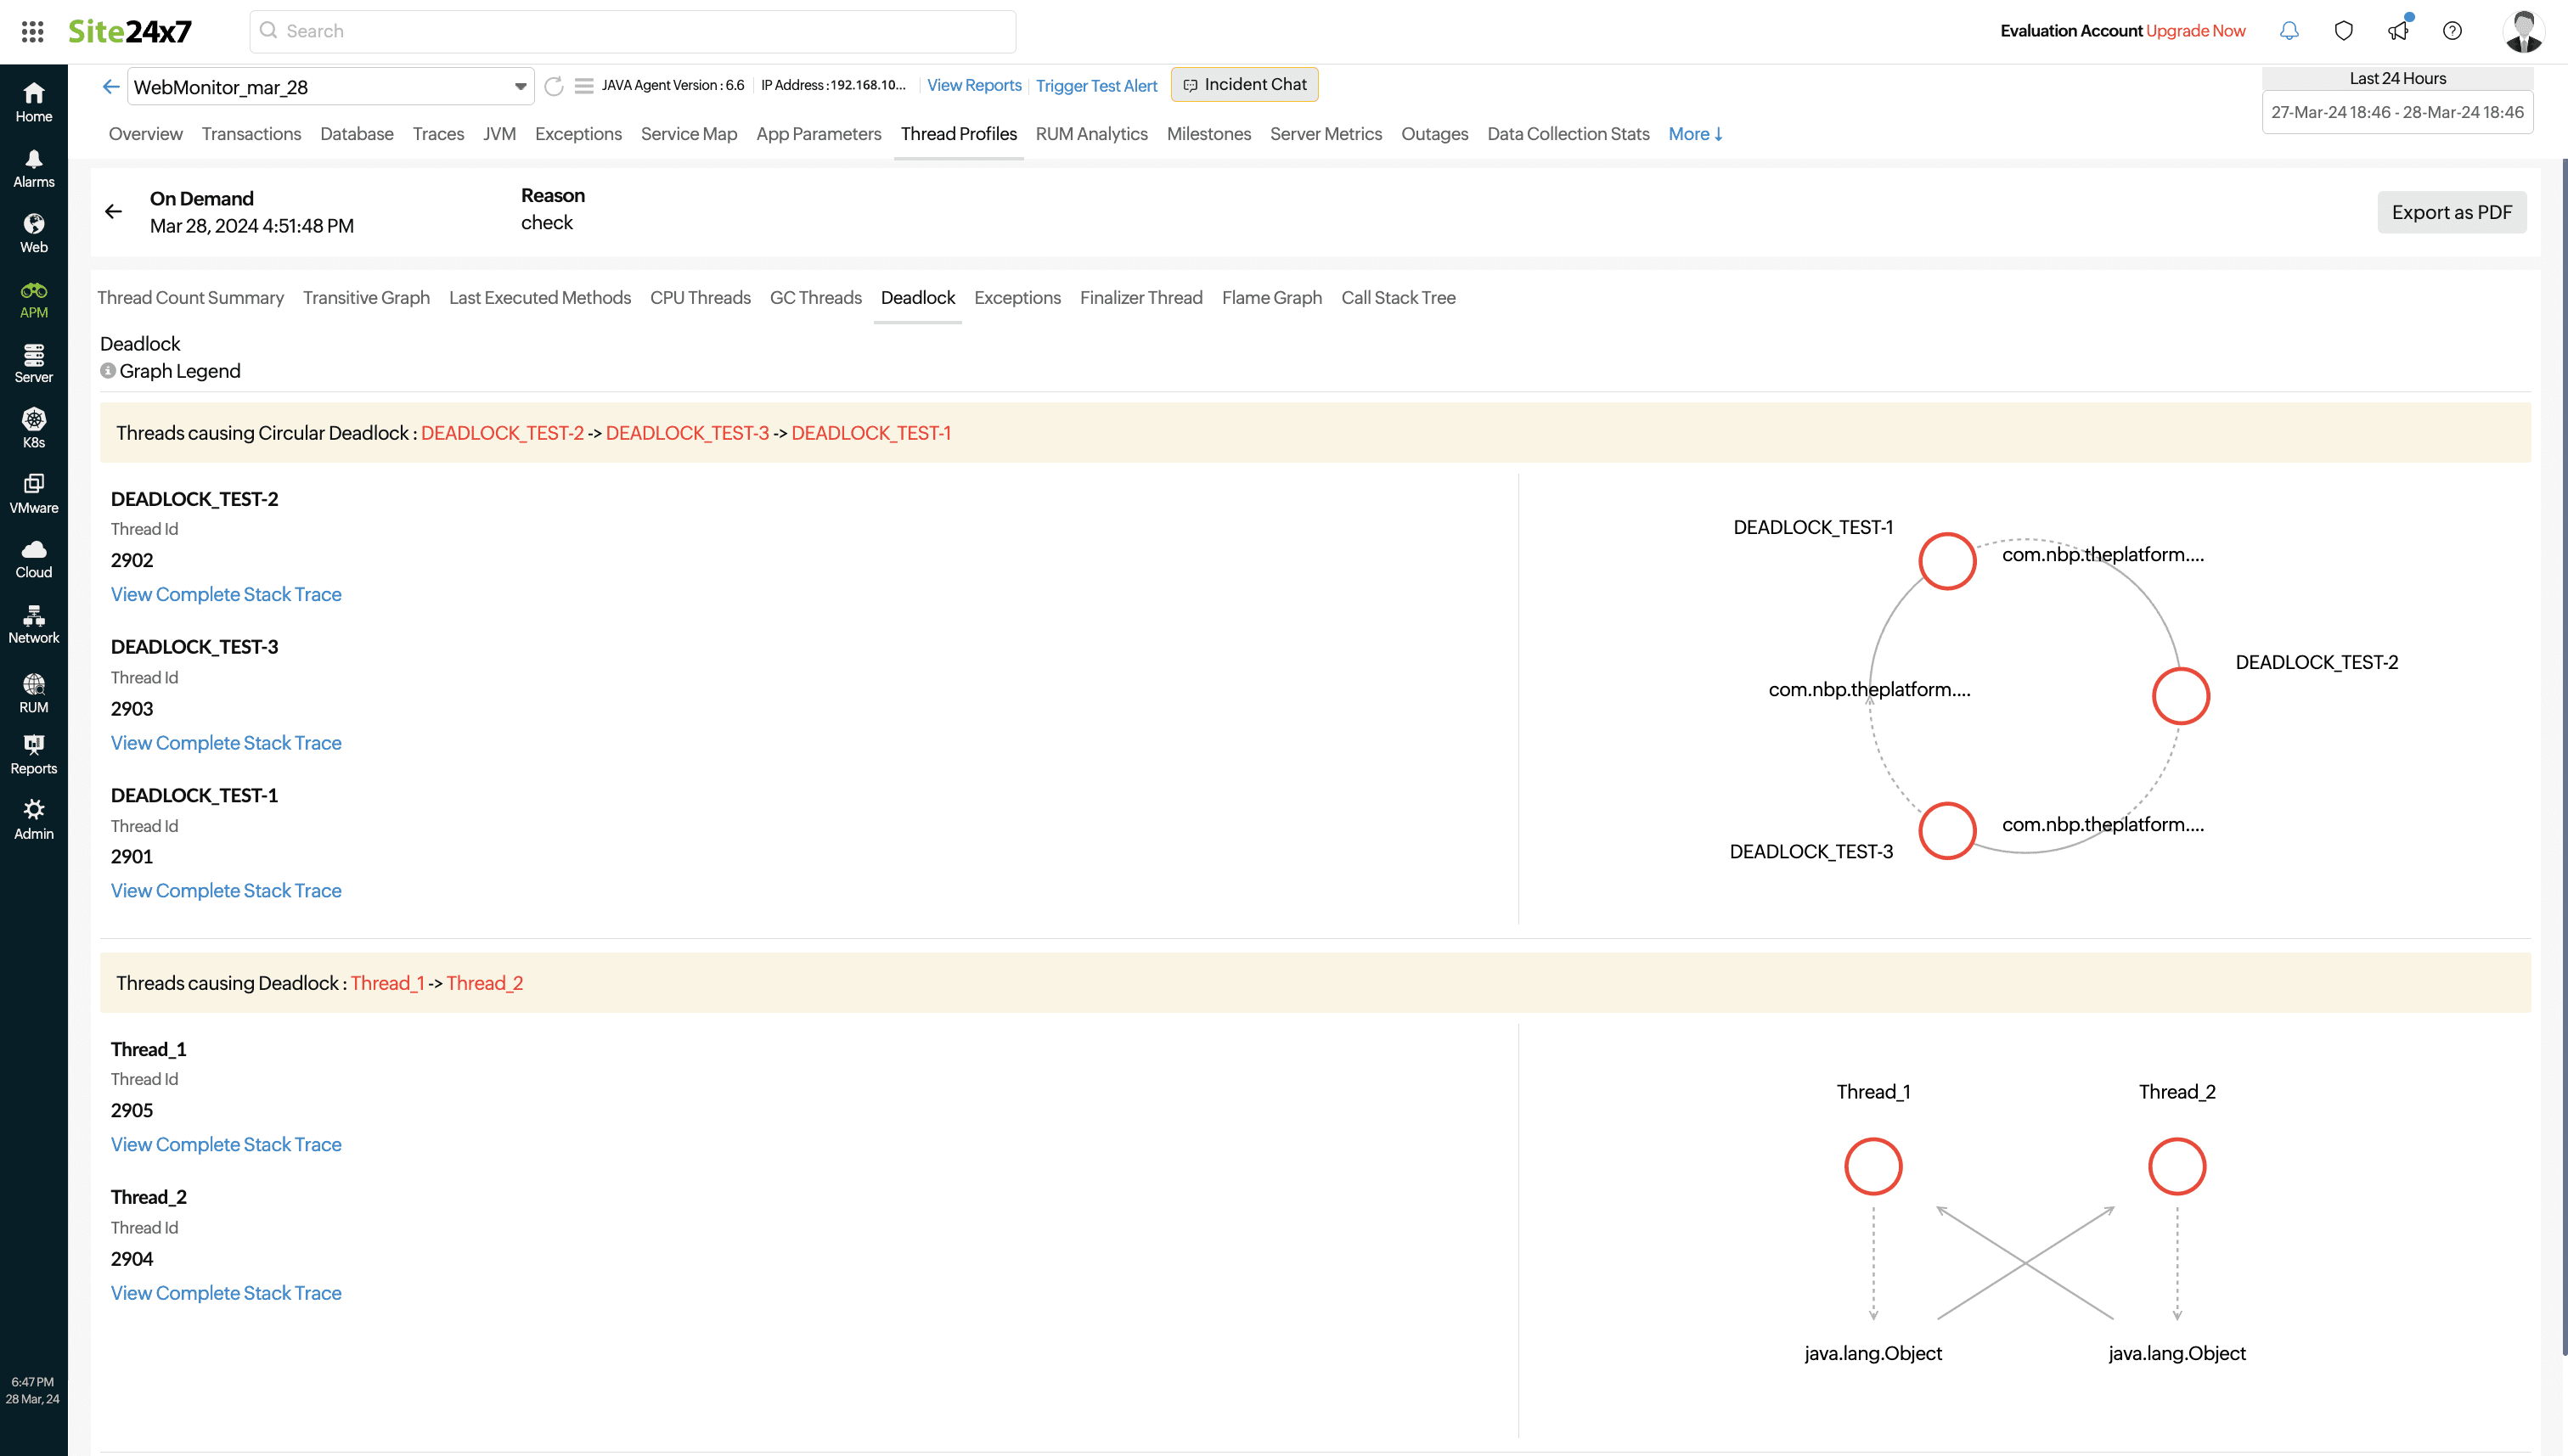
Fig 2. Deadlock tab
3. Visualize the state of threads
Visualizing the state of threads is crucial for identifying performance issues because it provides a clear picture of how threads are interacting within an application. Threads usually exist in running, waiting, blocked, or terminated states, and visualizing this helps developers quickly identify patterns, bottlenecks, and areas of contention that may be causing performance degradation. Visual representations, such as transitive graphs, flame graphs, and call trees, allow developers to observe thread behavior over time, pinpoint anomalies, and understand the flow of execution within the application.
If you want to get a high-level view of your threads, you can simply click the Thread Count Summary tab and get information on various threads in a thread dump based on the number of threads, the thread state, the list of thread groups, and so on.
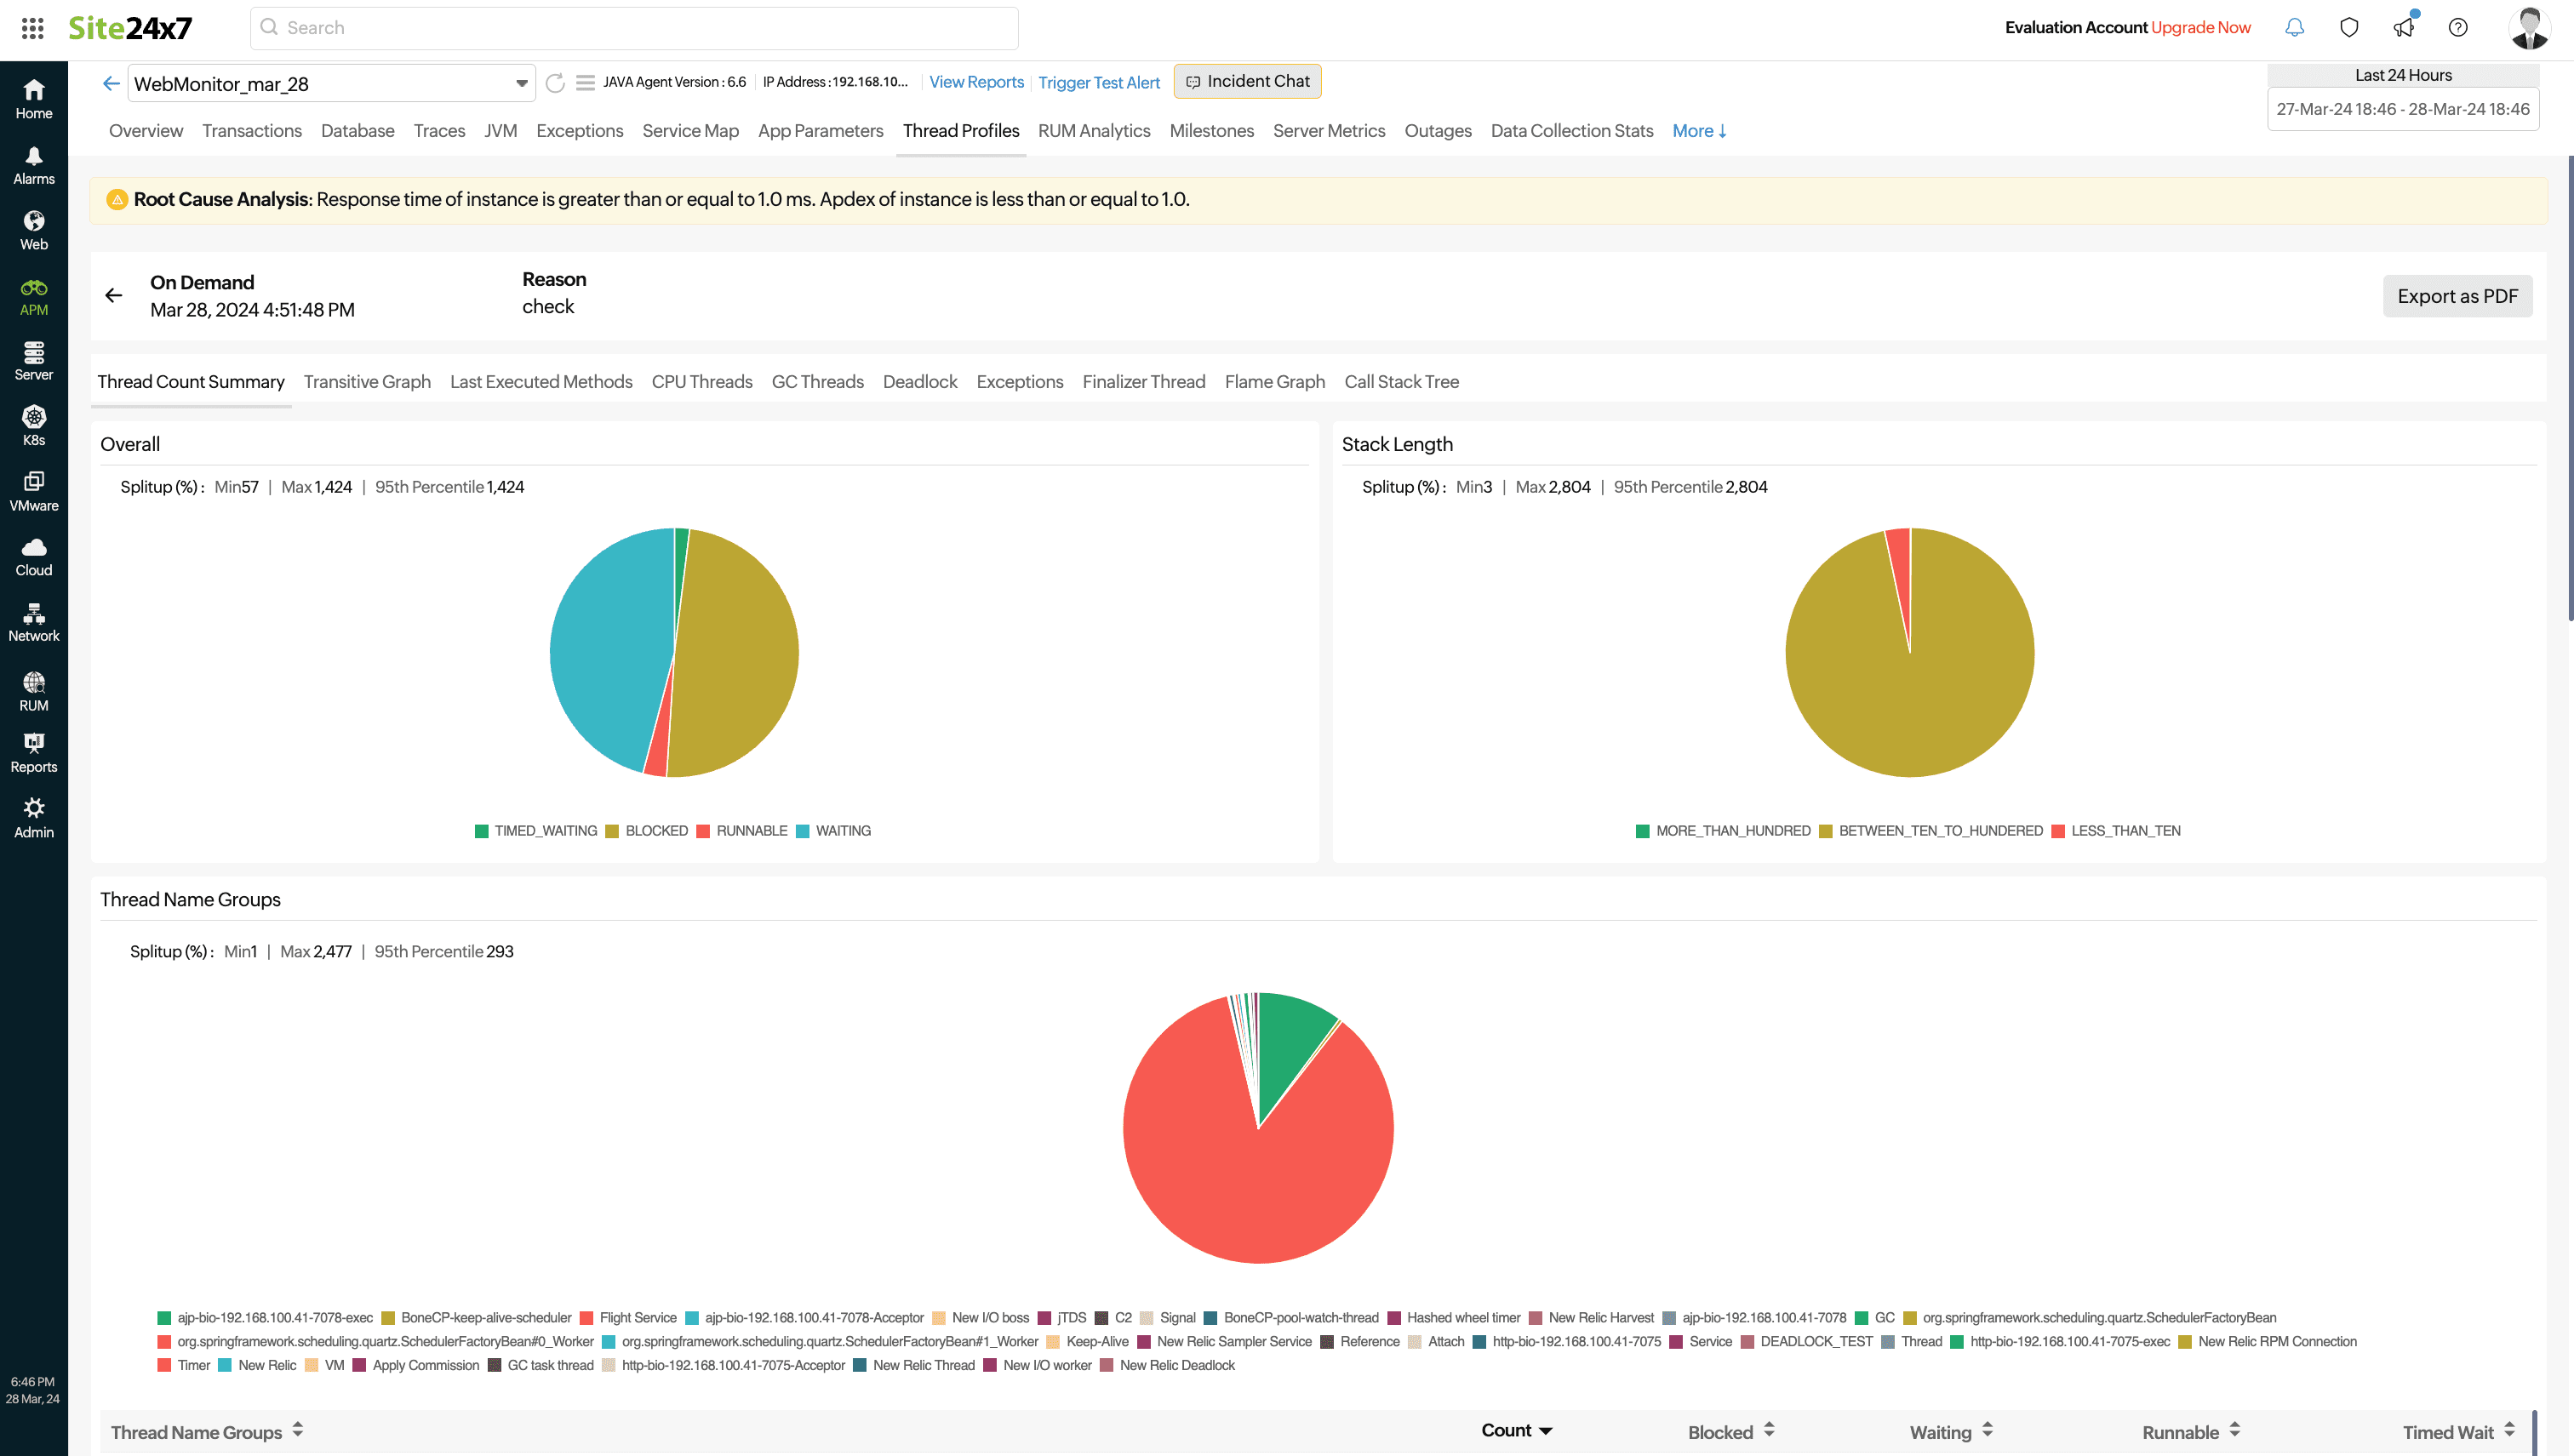
Fig 3. Thread Count Summary tab
If you want high-level information on the performance of your multi-threaded application, you can simply click the Flame Graph tab, which helps identify all the functions that are taking up the most time and potentially causing performance issues by visualizing the amount of time spent on each function or code segment. Every horizontal bar depicts a distinct function or segment of code, with its width reflecting the number of threads executing this line of code. This visual representation aids in pinpointing areas that require any performance enhancements or optimization, and in identifying bottlenecks within intricate systems.
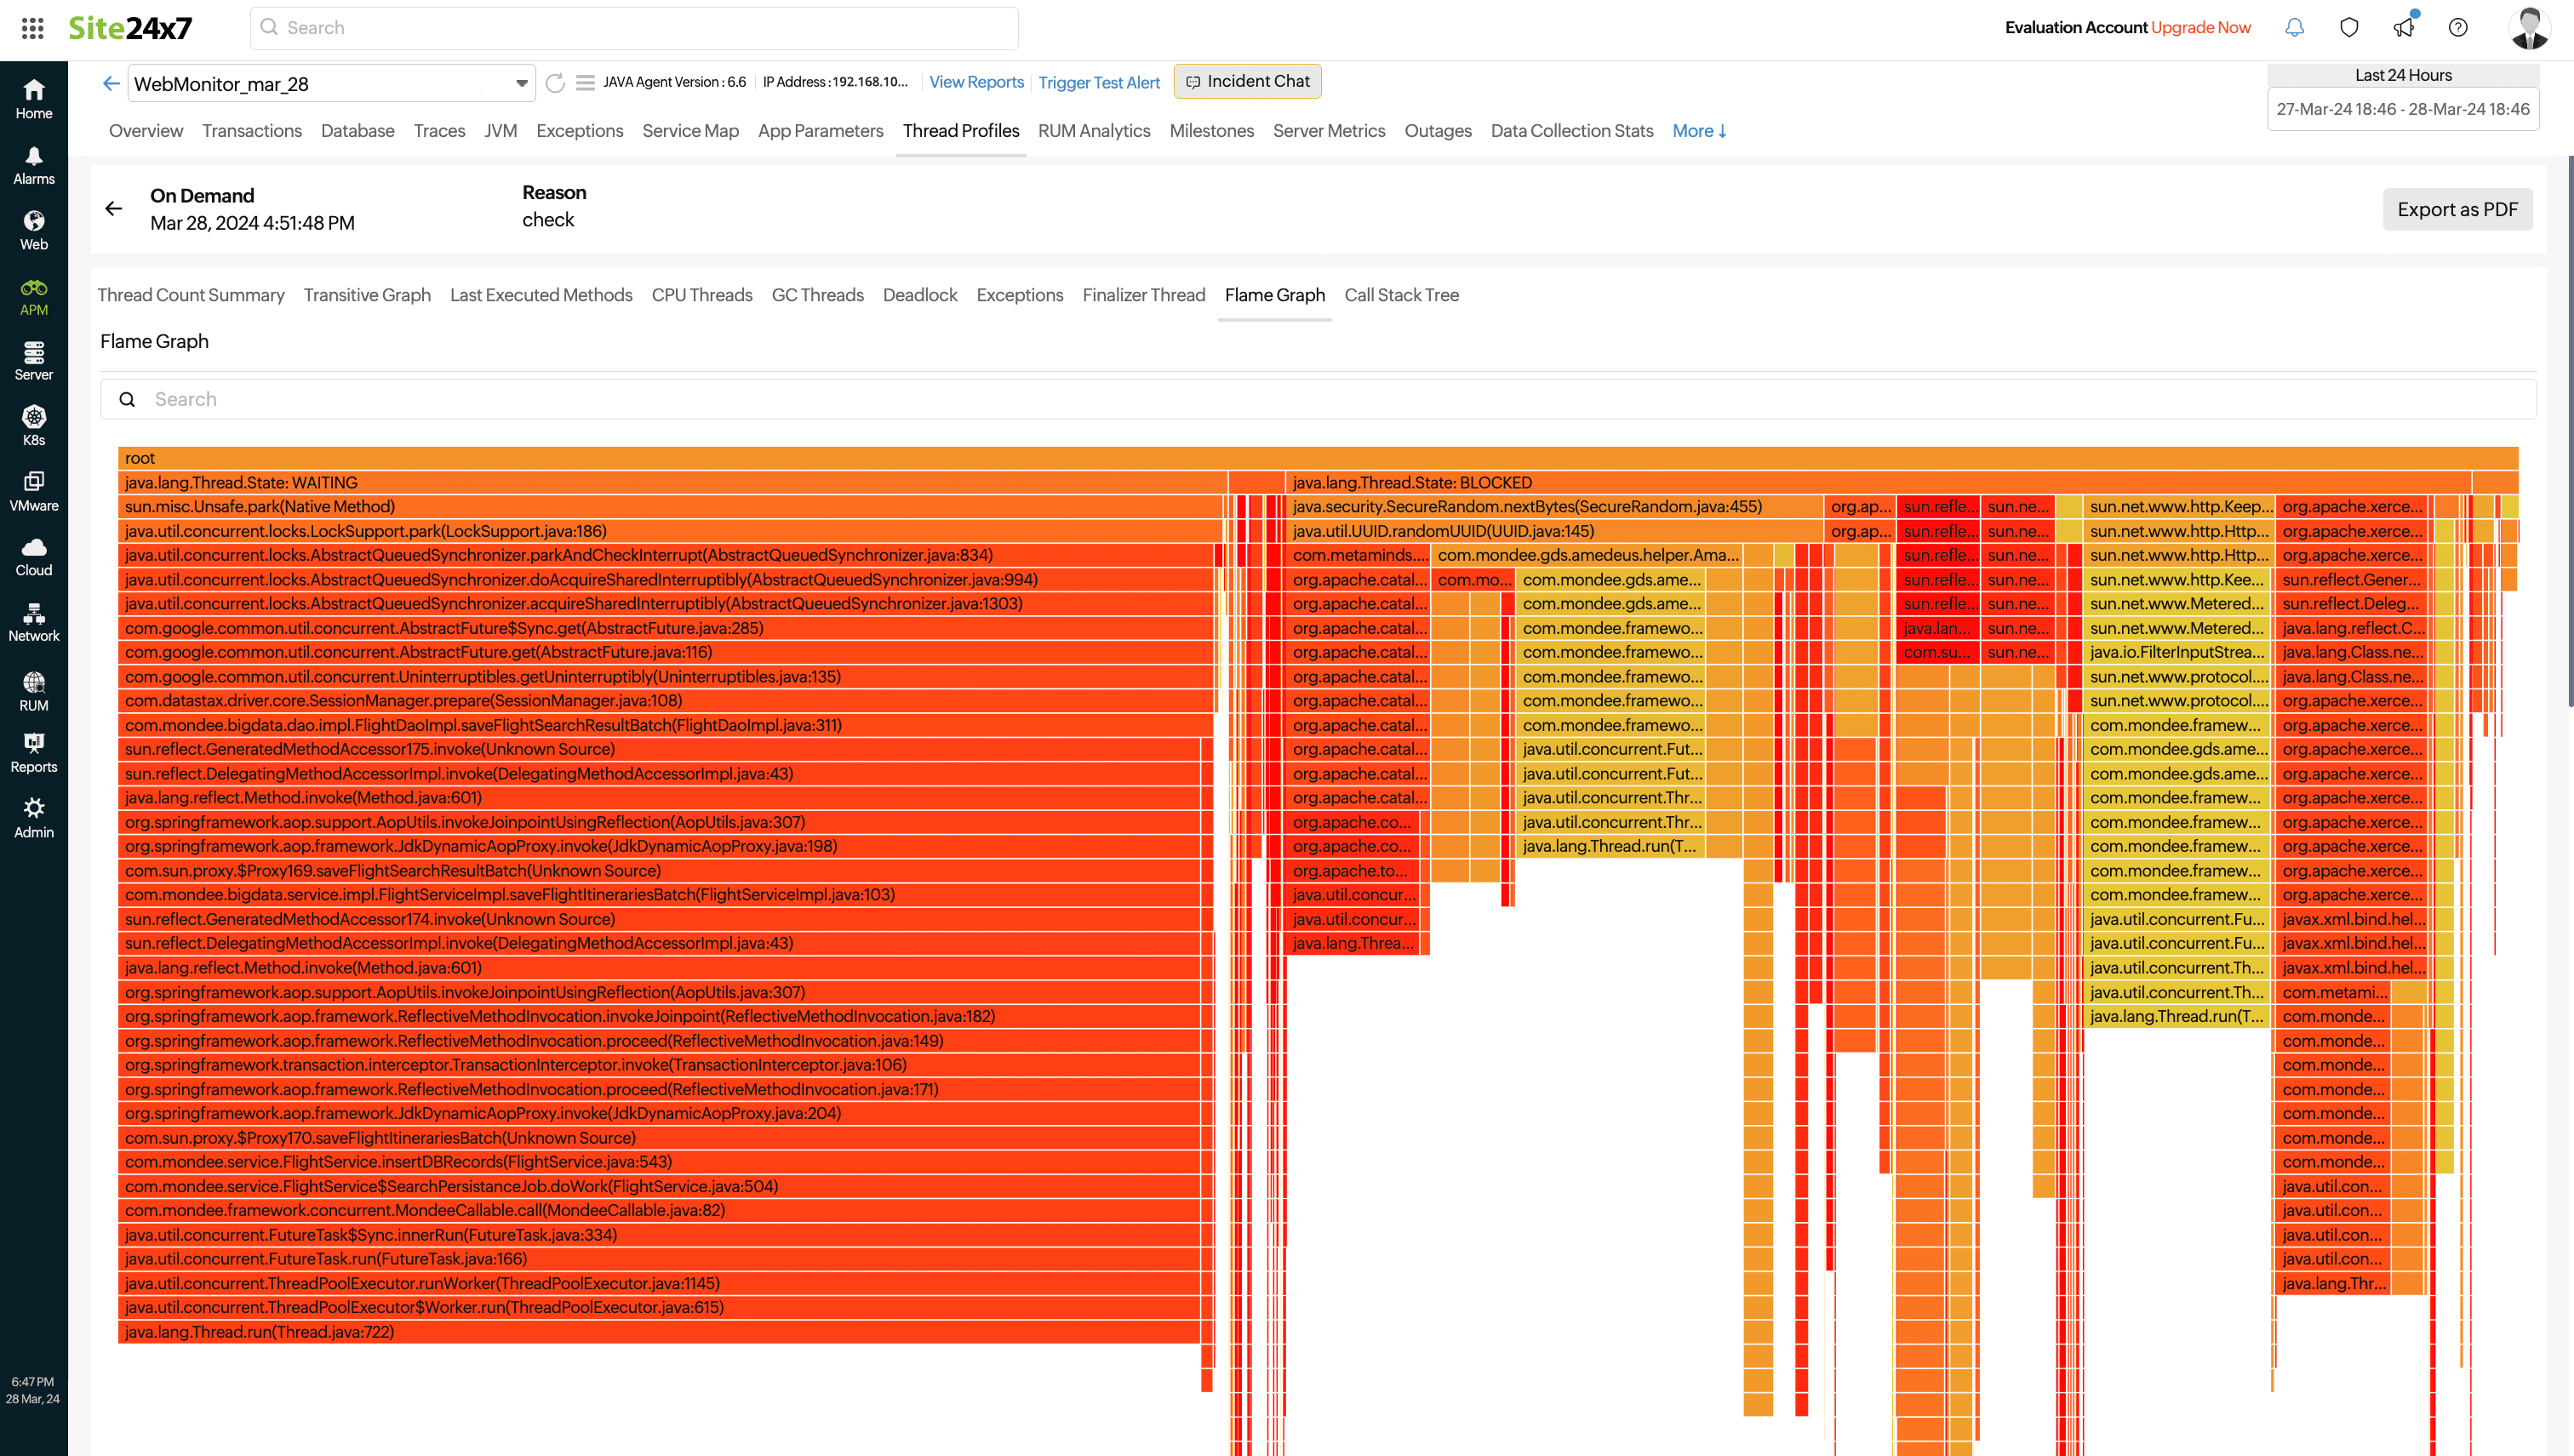
Fig 4. Flame Graph
If you want to view the performance of multi-threaded applications illustrated in a more hierarchical fashion that shows the flow of control between functions and how they are nested, you can click the Call Stack Tree tab. The call tree function allows for the detection of performance issues in an application by allowing developers to program structure, trace execution paths, debug code, and analyze various dependencies with ease and precision.
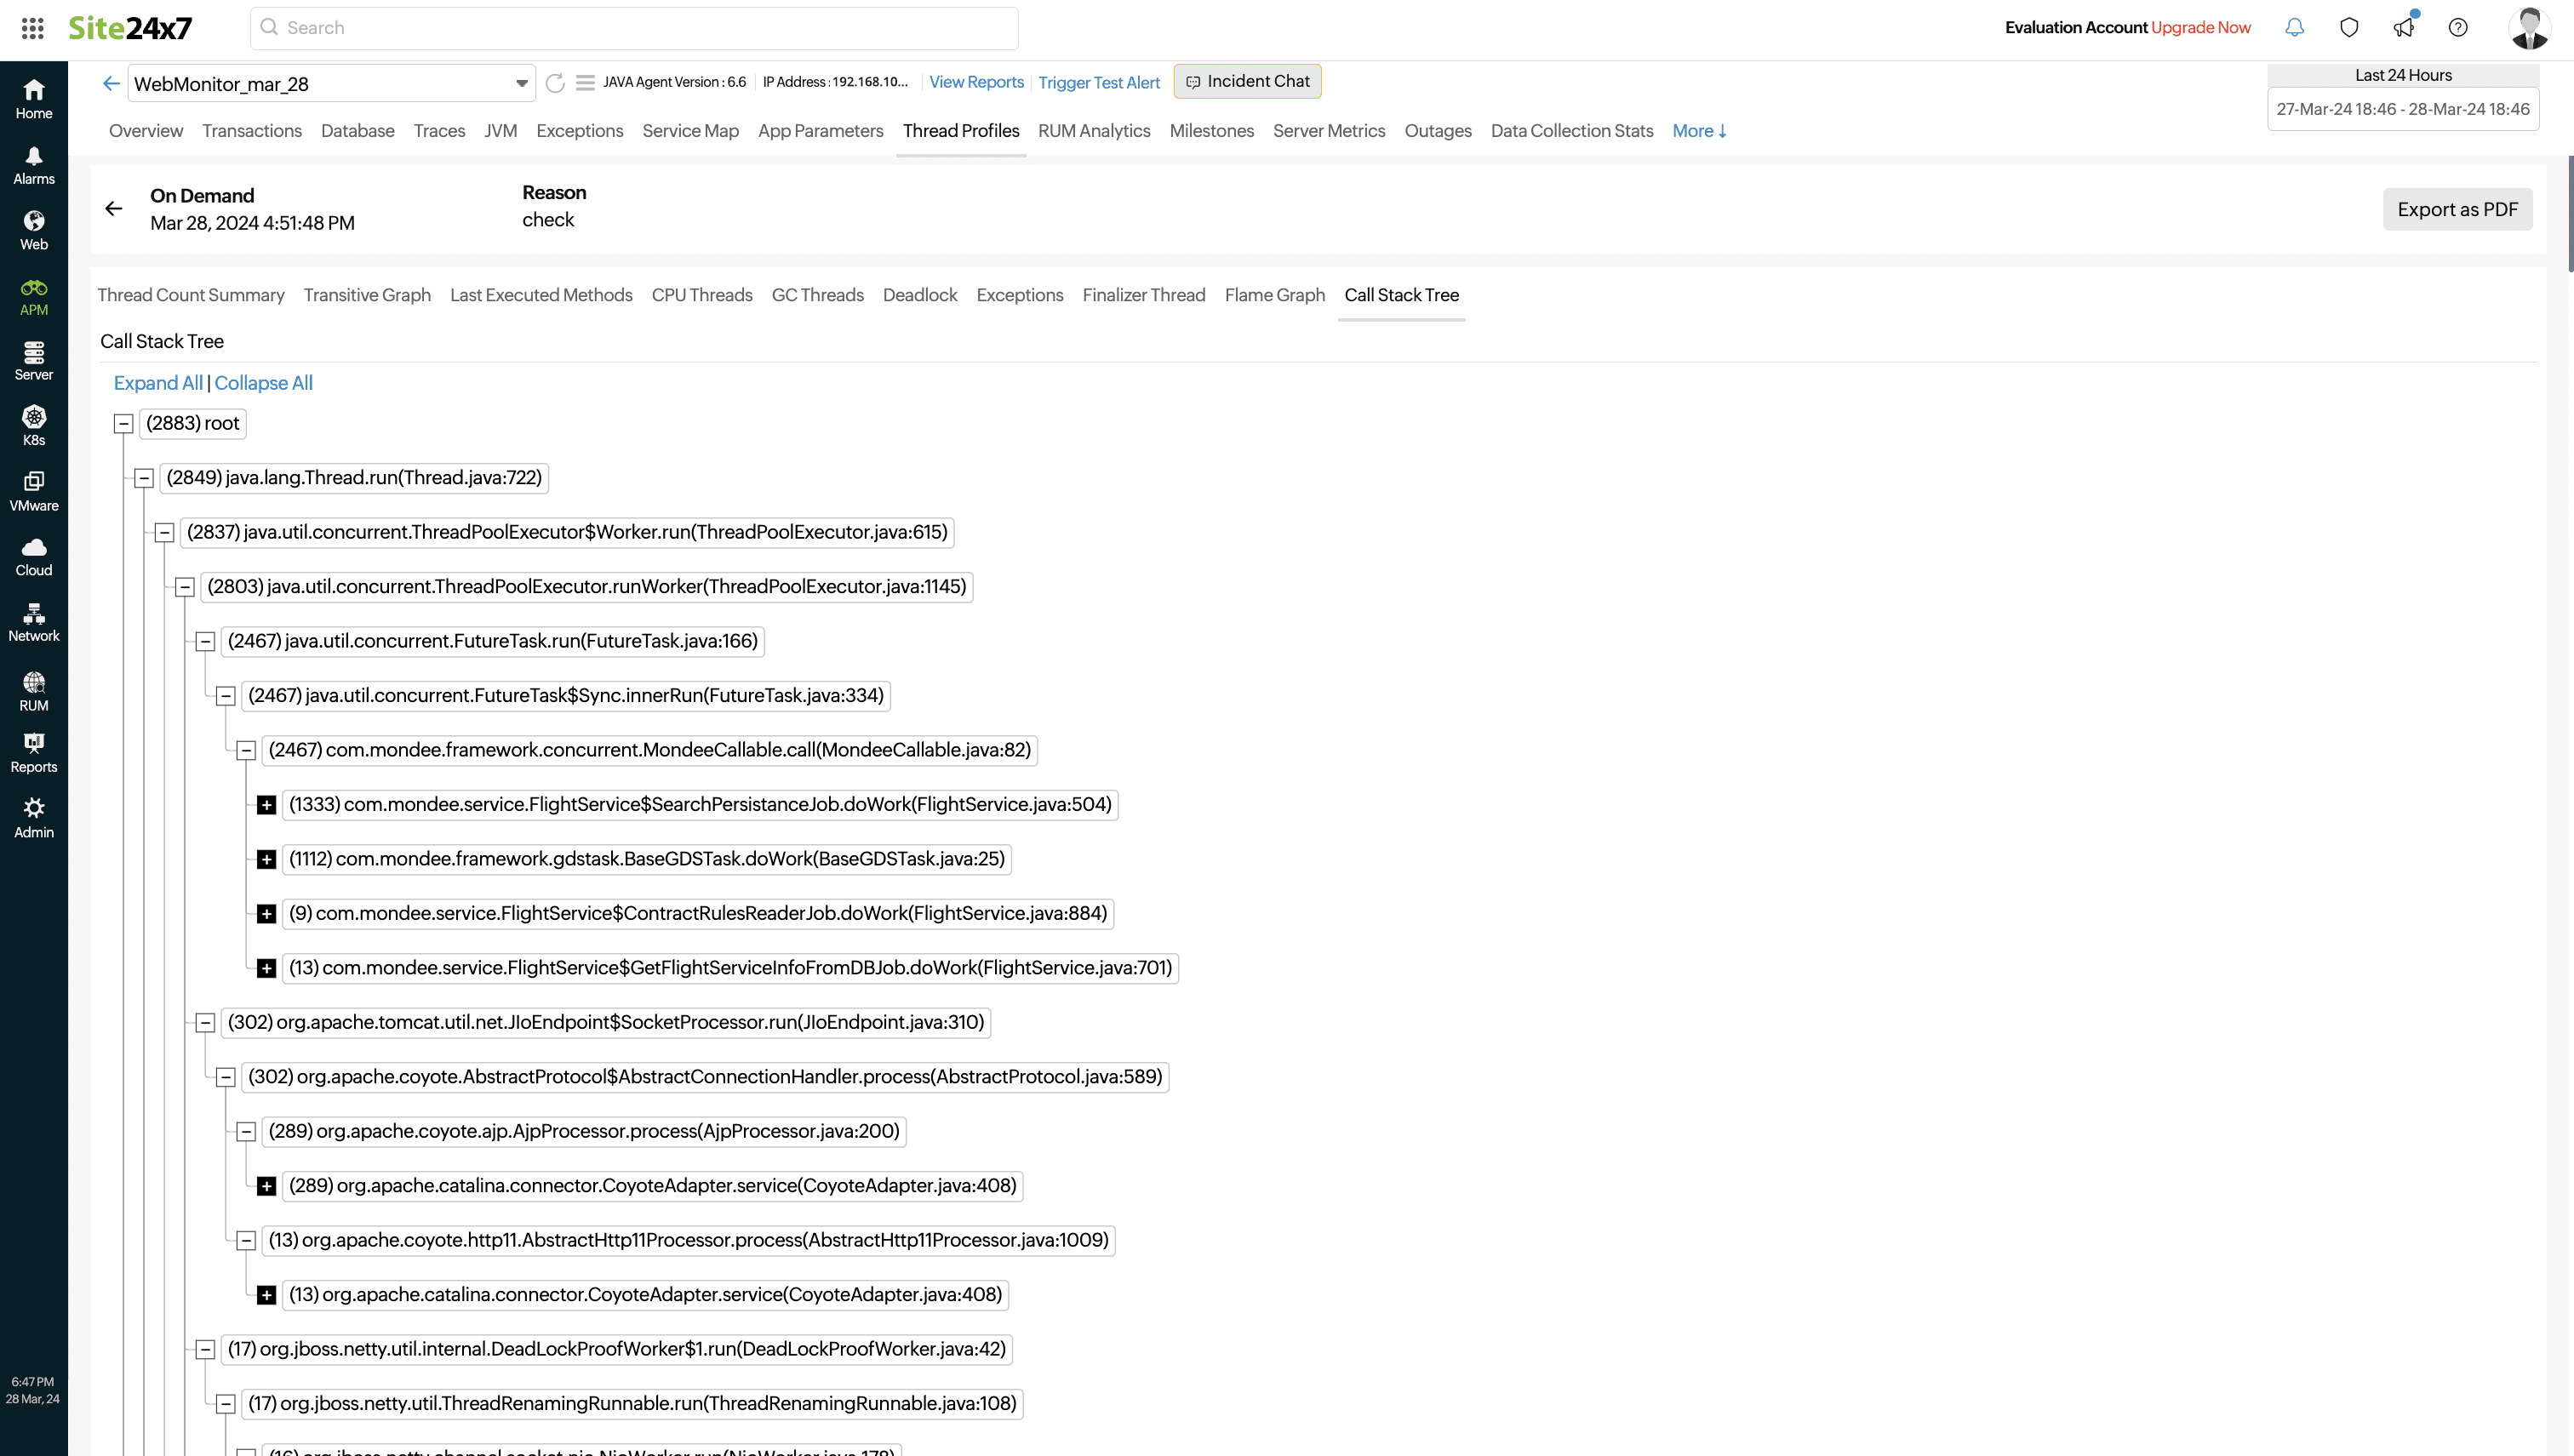
Fig 5. Call Stack Tree
It doesn't stop there
The thread dump analyzer tool has many more functionalities than those mentioned above. For example, the CPU Threads tab provides information on the top five CPU-consuming threads, with an option to view all CPU threads and their respective stack traces, while the GC Threads tab helps you with memory management by quickly identifying and resolving performance issues related to garbage collection.
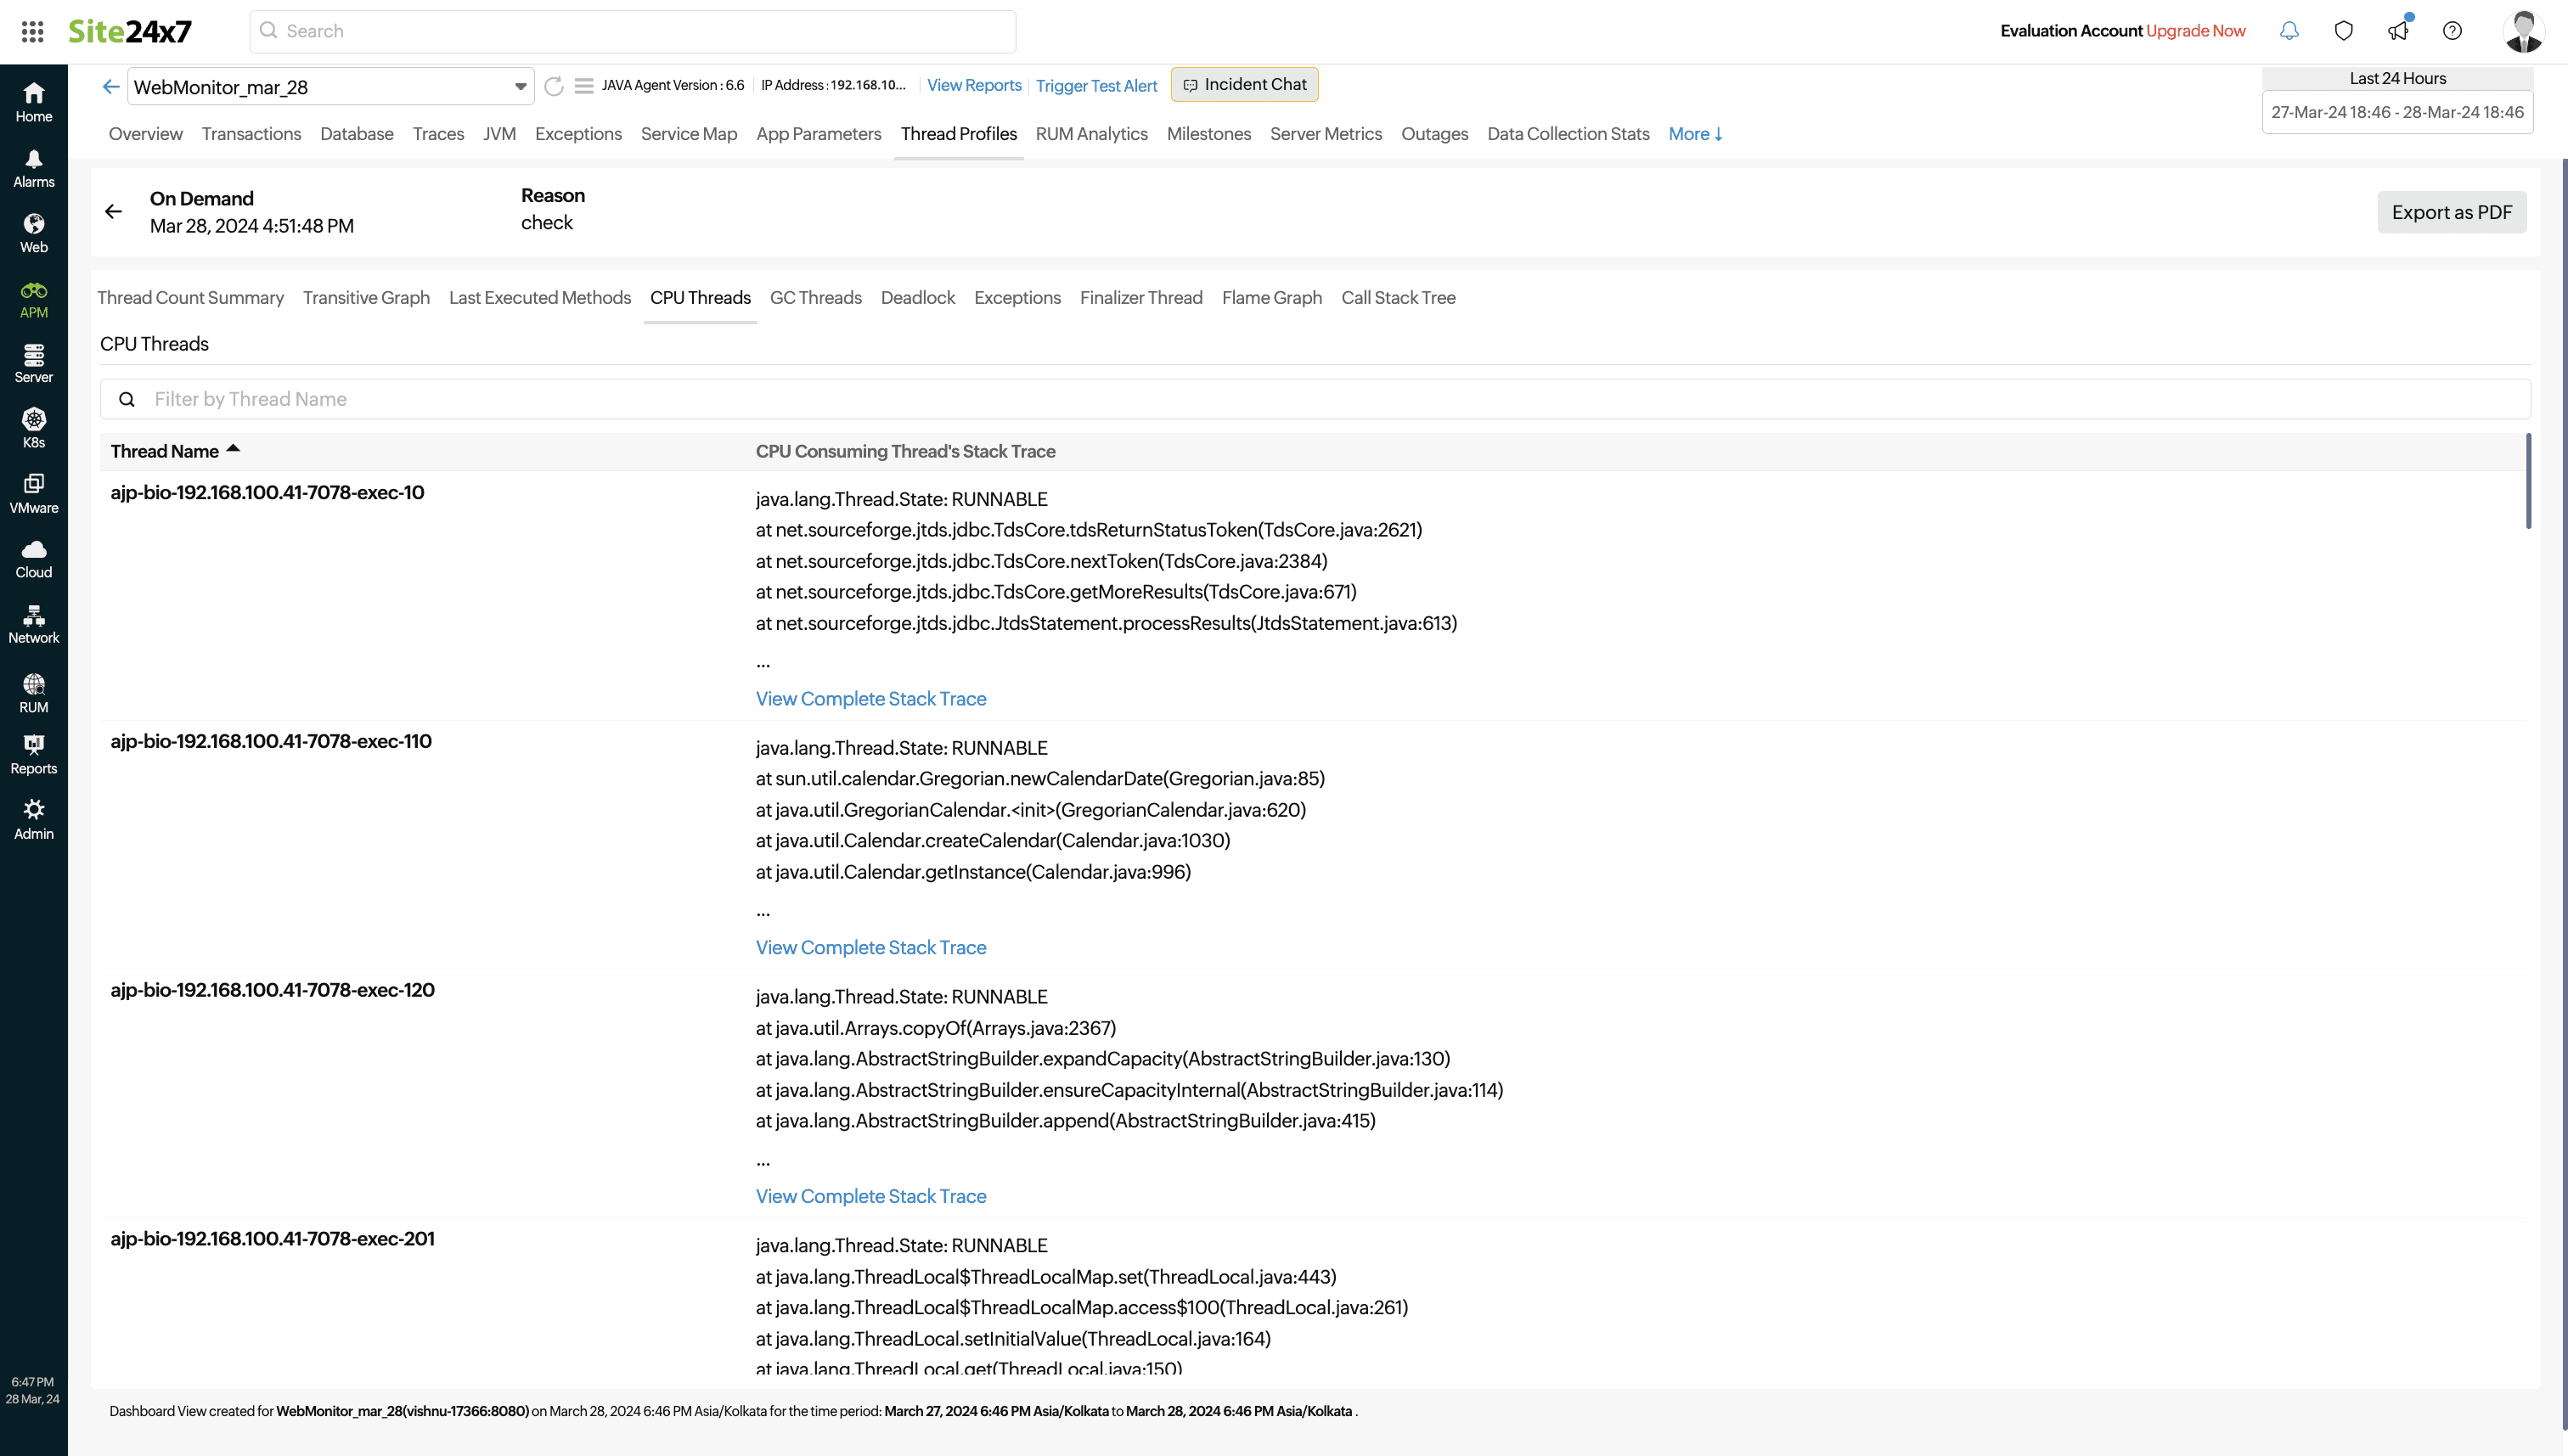
Fig 6. CPU Threads tab
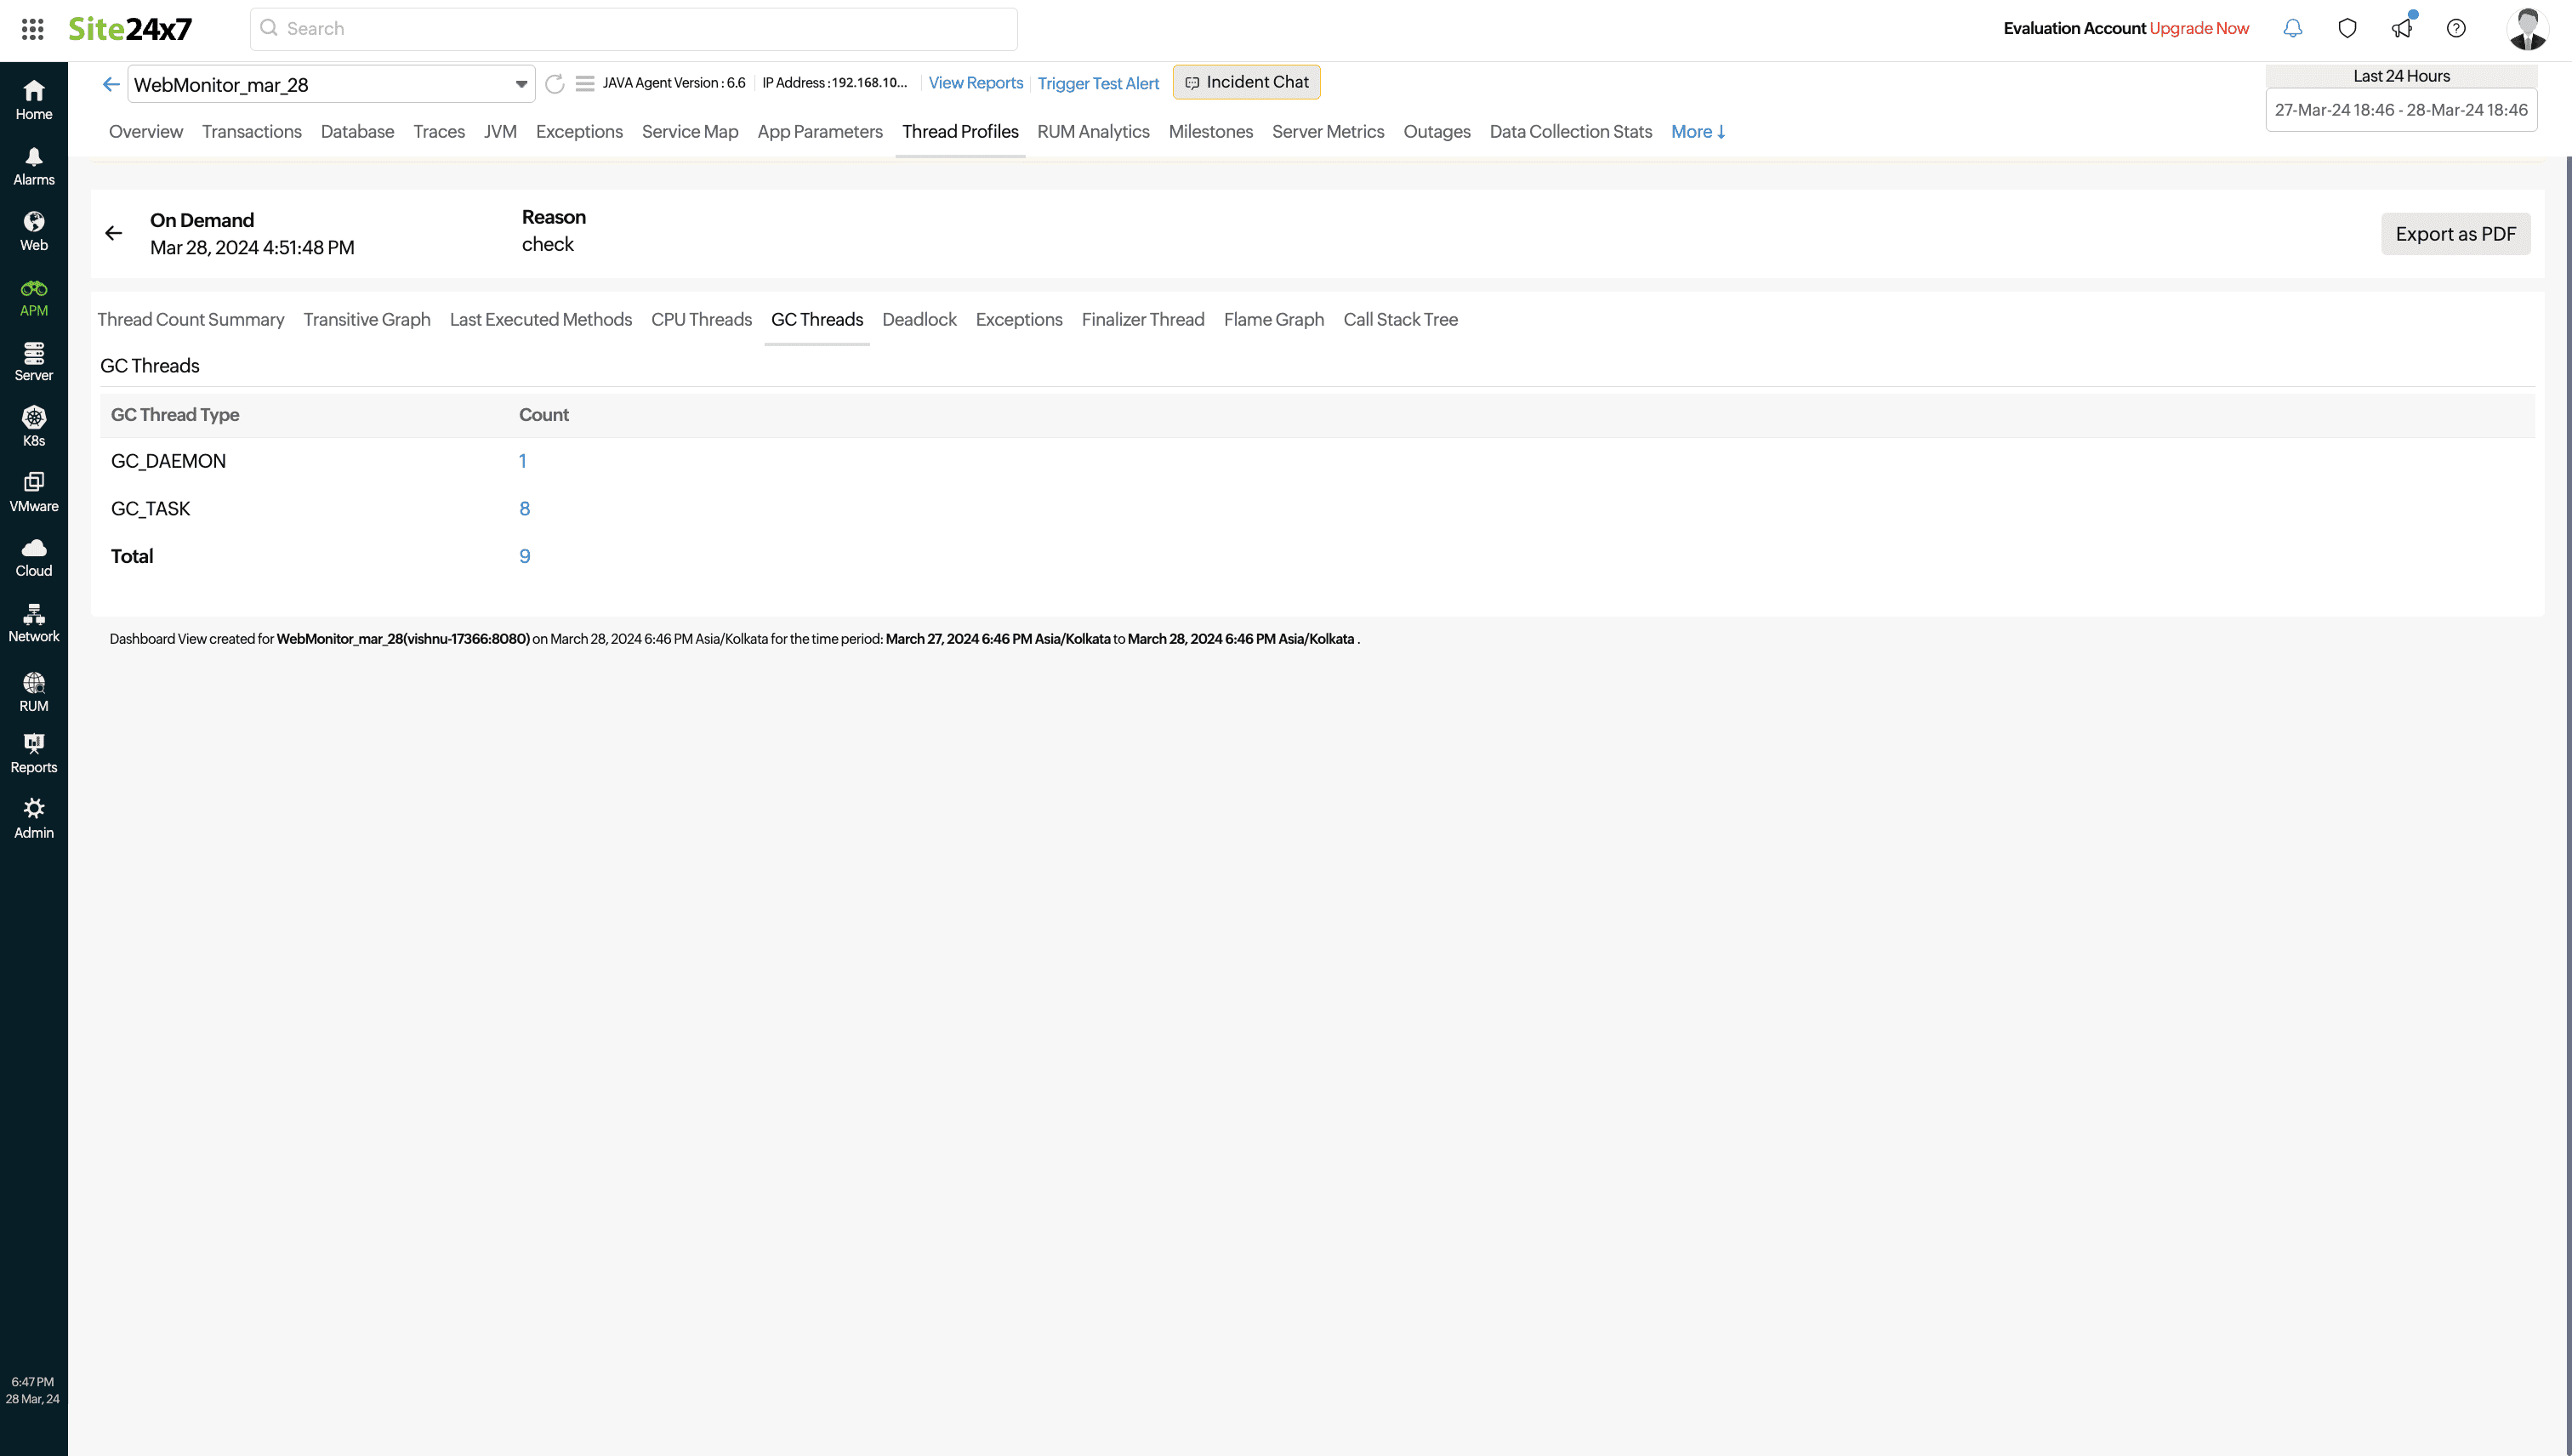
Fig 7. GC Threads tab
Conclusion
Thread dumps are a cornerstone of APM, granting developers invaluable insights into the inner workings of applications. The visual insights provided by the Site24x7 thread dump analyzer tool enable the timely diagnosis of concurrency issues, helping developers optimize resource utilization and prioritize performance enhancements effectively, ultimately leading to improved application responsiveness and a better user experience. Click here to learn more about getting started and sign up today to start using our thread dump analyzer tool.
Comments (0)